By InvestMacro
Here are the latest charts and statistics for the Commitment of Traders (COT) reports data published by the Commodities Futures Trading Commission (CFTC).
The latest COT data is updated through Tuesday May 13th and shows a quick view of how large traders (for-profit speculators and commercial entities) were positioned in the futures markets.
Weekly Speculator Changes led by Soybeans & Lean Hogs

The COT soft commodities markets speculator bets were overall higher this week as seven out of the eleven softs markets we cover had higher positioning while the other four markets had lower speculator contracts.
Leading the gains for the softs markets was Soybeans (15,793 contracts) with Lean Hogs (9,256 contracts), Soybean Oil (7,294 contracts), Sugar (6,490 contracts), Cocoa (3,957 contracts), Soybean Meal (3,027 contracts) and Live Cattle (2,016 contracts) also having positive weeks.
The markets with the declines in speculator bets this week were Corn (-97,793 contracts), Wheat (-10,563 contracts), Coffee (-3,271 contracts) and with Cotton (-7,467 contracts) also registering lower bets on the week.
Soft Commodities Data:

Legend: Weekly Speculators Change | Speculators Current Net Position | Speculators Strength Score compared to last 3-Years (0-100 range)
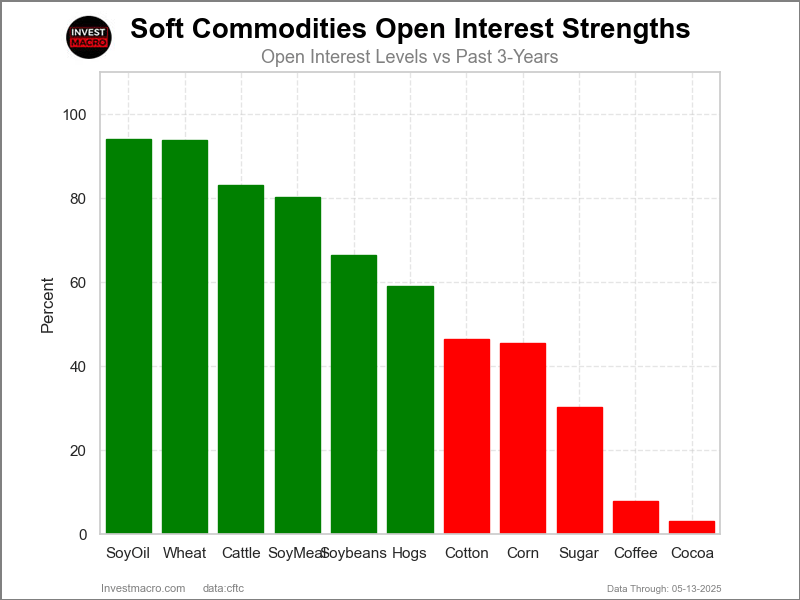
Strength Scores led by Live Cattle & Soybean Oil

COT Strength Scores (a normalized measure of Speculator positions over a 3-Year range, from 0 to 100 where above 80 is Extreme-Bullish and below 20 is Extreme-Bearish) showed that Live Cattle (88 percent) and Soybean Oil (83 percent) lead the softs markets this week. Coffee (71 percent), Soybeans (67 percent) and Lean Hogs (64 percent) come in as the next highest in the weekly strength scores.
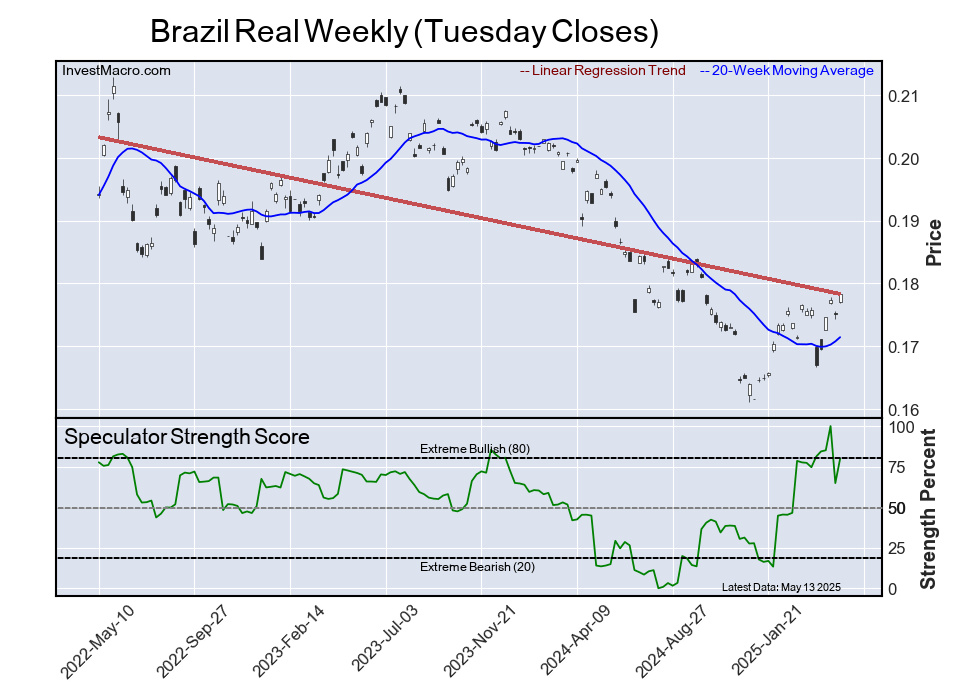
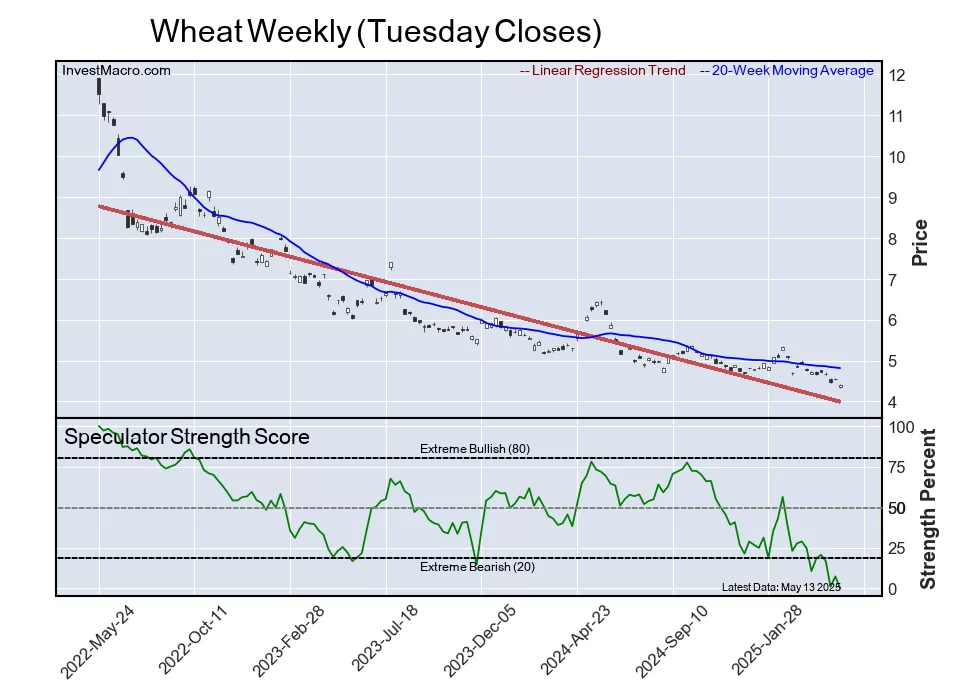
On the downside, Wheat (0 percent) and Soybean Meal (7 percent) come in at the lowest strength levels currently and are in Extreme-Bearish territory (below 20 percent). The next lowest strength scores are the Sugar (20 percent) and the Cotton (27 percent).
Strength Statistics:
Corn (38.7 percent) vs Corn previous week (52.0 percent)
Sugar (19.8 percent) vs Sugar previous week (17.8 percent)
Coffee (70.5 percent) vs Coffee previous week (73.7 percent)
Soybeans (67.2 percent) vs Soybeans previous week (63.2 percent)
Soybean Oil (82.8 percent) vs Soybean Oil previous week (78.8 percent)
Soybean Meal (6.5 percent) vs Soybean Meal previous week (5.3 percent)
Live Cattle (87.5 percent) vs Live Cattle previous week (85.6 percent)
Lean Hogs (64.0 percent) vs Lean Hogs previous week (56.8 percent)
Cotton (27.1 percent) vs Cotton previous week (31.7 percent)
Cocoa (31.2 percent) vs Cocoa previous week (27.2 percent)
Wheat (0.0 percent) vs Wheat previous week (7.3 percent)
Soybean Oil & Soybeans top the 6-Week Strength Trends

COT Strength Score Trends (or move index, calculates the 6-week changes in strength scores) showed that Soybean Oil (34 percent) and Soybeans (18 percent) lead the past six weeks trends for soft commodities. Cotton (15 percent), Lean Hogs (13 percent) and Cocoa (2 percent) are the next highest positive movers in the latest trends data.
Corn (-20 percent) leads the downside trend scores currently with Live Cattle (-12 percent) and Wheat (-11 percent) following next with lower trend scores.
Strength Trend Statistics:
Corn (-20.2 percent) vs Corn previous week (-11.5 percent)
Sugar (-7.7 percent) vs Sugar previous week (-9.5 percent)
Coffee (-7.7 percent) vs Coffee previous week (-8.8 percent)
Soybeans (17.6 percent) vs Soybeans previous week (16.3 percent)
Soybean Oil (34.3 percent) vs Soybean Oil previous week (49.9 percent)
Soybean Meal (1.4 percent) vs Soybean Meal previous week (-1.9 percent)
Live Cattle (-12.5 percent) vs Live Cattle previous week (-9.0 percent)
Lean Hogs (12.6 percent) vs Lean Hogs previous week (6.3 percent)
Cotton (14.9 percent) vs Cotton previous week (26.7 percent)
Cocoa (2.3 percent) vs Cocoa previous week (-1.4 percent)
Wheat (-10.6 percent) vs Wheat previous week (-17.3 percent)
Individual Soft Commodities Markets:
CORN Futures:
 The CORN large speculator standing this week reached a net position of 18,106 contracts in the data reported through Tuesday. This was a weekly reduction of -97,793 contracts from the previous week which had a total of 115,899 net contracts.
This week’s current strength score (the trader positioning range over the past three years, measured from 0 to 100) shows the speculators are currently Bearish with a score of 38.7 percent. The commercials are Bullish with a score of 59.2 percent and the small traders (not shown in chart) are Bullish with a score of 70.2 percent.
Price Trend-Following Model: Strong Downtrend
Our weekly trend-following model classifies the current market price position as: Strong Downtrend.
| CORN Futures Statistics | SPECULATORS | COMMERCIALS | SMALL TRADERS |
| – Percent of Open Interest Longs: | 21.5 | 46.3 | 8.7 |
| – Percent of Open Interest Shorts: | 20.3 | 45.4 | 10.6 |
| – Net Position: | 18,106 | 13,151 | -31,257 |
| – Gross Longs: | 341,178 | 735,478 | 137,591 |
| – Gross Shorts: | 323,072 | 722,327 | 168,848 |
| – Long to Short Ratio: | 1.1 to 1 | 1.0 to 1 | 0.8 to 1 |
| NET POSITION TREND: | | | |
| – Strength Index Score (3 Year Range Pct): | 38.7 | 59.2 | 70.2 |
| – Strength Index Reading (3 Year Range): | Bearish | Bullish | Bullish |
| NET POSITION MOVEMENT INDEX: | | | |
| – 6-Week Change in Strength Index: | -20.2 | 18.9 | 28.3 |
SUGAR Futures:
 The SUGAR large speculator standing this week reached a net position of 28,930 contracts in the data reported through Tuesday. This was a weekly rise of 6,490 contracts from the previous week which had a total of 22,440 net contracts.
This week’s current strength score (the trader positioning range over the past three years, measured from 0 to 100) shows the speculators are currently Bearish-Extreme with a score of 19.8 percent. The commercials are Bullish-Extreme with a score of 82.1 percent and the small traders (not shown in chart) are Bearish with a score of 24.0 percent.
Price Trend-Following Model: Weak Uptrend
Our weekly trend-following model classifies the current market price position as: Weak Uptrend.
| SUGAR Futures Statistics | SPECULATORS | COMMERCIALS | SMALL TRADERS |
| – Percent of Open Interest Longs: | 25.5 | 51.6 | 8.3 |
| – Percent of Open Interest Shorts: | 21.8 | 55.6 | 8.0 |
| – Net Position: | 28,930 | -31,282 | 2,352 |
| – Gross Longs: | 200,858 | 406,500 | 65,256 |
| – Gross Shorts: | 171,928 | 437,782 | 62,904 |
| – Long to Short Ratio: | 1.2 to 1 | 0.9 to 1 | 1.0 to 1 |
| NET POSITION TREND: | | | |
| – Strength Index Score (3 Year Range Pct): | 19.8 | 82.1 | 24.0 |
| – Strength Index Reading (3 Year Range): | Bearish-Extreme | Bullish-Extreme | Bearish |
| NET POSITION MOVEMENT INDEX: | | | |
| – 6-Week Change in Strength Index: | -7.7 | 10.9 | -22.3 |
COFFEE Futures:
 The COFFEE large speculator standing this week reached a net position of 46,070 contracts in the data reported through Tuesday. This was a weekly decrease of -3,271 contracts from the previous week which had a total of 49,341 net contracts.
This week’s current strength score (the trader positioning range over the past three years, measured from 0 to 100) shows the speculators are currently Bullish with a score of 70.5 percent. The commercials are Bearish with a score of 30.8 percent and the small traders (not shown in chart) are Bullish with a score of 57.1 percent.
Price Trend-Following Model: Uptrend
Our weekly trend-following model classifies the current market price position as: Uptrend.
| COFFEE Futures Statistics | SPECULATORS | COMMERCIALS | SMALL TRADERS |
| – Percent of Open Interest Longs: | 36.6 | 38.1 | 5.5 |
| – Percent of Open Interest Shorts: | 6.8 | 69.4 | 4.0 |
| – Net Position: | 46,070 | -48,390 | 2,320 |
| – Gross Longs: | 56,603 | 58,862 | 8,530 |
| – Gross Shorts: | 10,533 | 107,252 | 6,210 |
| – Long to Short Ratio: | 5.4 to 1 | 0.5 to 1 | 1.4 to 1 |
| NET POSITION TREND: | | | |
| – Strength Index Score (3 Year Range Pct): | 70.5 | 30.8 | 57.1 |
| – Strength Index Reading (3 Year Range): | Bullish | Bearish | Bullish |
| NET POSITION MOVEMENT INDEX: | | | |
| – 6-Week Change in Strength Index: | -7.7 | 7.9 | -4.8 |
SOYBEANS Futures:
 The SOYBEANS large speculator standing this week reached a net position of 65,178 contracts in the data reported through Tuesday. This was a weekly lift of 15,793 contracts from the previous week which had a total of 49,385 net contracts.
This week’s current strength score (the trader positioning range over the past three years, measured from 0 to 100) shows the speculators are currently Bullish with a score of 67.2 percent. The commercials are Bearish with a score of 30.0 percent and the small traders (not shown in chart) are Bullish with a score of 78.0 percent.
Price Trend-Following Model: Weak Downtrend
Our weekly trend-following model classifies the current market price position as: Weak Downtrend.
| SOYBEANS Futures Statistics | SPECULATORS | COMMERCIALS | SMALL TRADERS |
| – Percent of Open Interest Longs: | 23.0 | 48.0 | 5.8 |
| – Percent of Open Interest Shorts: | 15.0 | 54.3 | 7.4 |
| – Net Position: | 65,178 | -51,976 | -13,202 |
| – Gross Longs: | 188,820 | 394,900 | 47,999 |
| – Gross Shorts: | 123,642 | 446,876 | 61,201 |
| – Long to Short Ratio: | 1.5 to 1 | 0.9 to 1 | 0.8 to 1 |
| NET POSITION TREND: | | | |
| – Strength Index Score (3 Year Range Pct): | 67.2 | 30.0 | 78.0 |
| – Strength Index Reading (3 Year Range): | Bullish | Bearish | Bullish |
| NET POSITION MOVEMENT INDEX: | | | |
| – 6-Week Change in Strength Index: | 17.6 | -20.9 | 23.1 |
SOYBEAN OIL Futures:
 The SOYBEAN OIL large speculator standing this week reached a net position of 74,199 contracts in the data reported through Tuesday. This was a weekly increase of 7,294 contracts from the previous week which had a total of 66,905 net contracts.
This week’s current strength score (the trader positioning range over the past three years, measured from 0 to 100) shows the speculators are currently Bullish-Extreme with a score of 82.8 percent. The commercials are Bearish-Extreme with a score of 18.9 percent and the small traders (not shown in chart) are Bullish with a score of 58.0 percent.
Price Trend-Following Model: Strong Uptrend
Our weekly trend-following model classifies the current market price position as: Strong Uptrend.
| SOYBEAN OIL Futures Statistics | SPECULATORS | COMMERCIALS | SMALL TRADERS |
| – Percent of Open Interest Longs: | 26.7 | 44.7 | 6.1 |
| – Percent of Open Interest Shorts: | 14.0 | 59.0 | 4.5 |
| – Net Position: | 74,199 | -83,812 | 9,613 |
| – Gross Longs: | 156,359 | 261,556 | 35,793 |
| – Gross Shorts: | 82,160 | 345,368 | 26,180 |
| – Long to Short Ratio: | 1.9 to 1 | 0.8 to 1 | 1.4 to 1 |
| NET POSITION TREND: | | | |
| – Strength Index Score (3 Year Range Pct): | 82.8 | 18.9 | 58.0 |
| – Strength Index Reading (3 Year Range): | Bullish-Extreme | Bearish-Extreme | Bullish |
| NET POSITION MOVEMENT INDEX: | | | |
| – 6-Week Change in Strength Index: | 34.3 | -34.5 | 23.5 |
SOYBEAN MEAL Futures:
 The SOYBEAN MEAL large speculator standing this week reached a net position of -50,928 contracts in the data reported through Tuesday. This was a weekly boost of 3,027 contracts from the previous week which had a total of -53,955 net contracts.
This week’s current strength score (the trader positioning range over the past three years, measured from 0 to 100) shows the speculators are currently Bearish-Extreme with a score of 6.5 percent. The commercials are Bullish-Extreme with a score of 90.7 percent and the small traders (not shown in chart) are Bearish with a score of 44.5 percent.
Price Trend-Following Model: Strong Downtrend
Our weekly trend-following model classifies the current market price position as: Strong Downtrend.
| SOYBEAN MEAL Futures Statistics | SPECULATORS | COMMERCIALS | SMALL TRADERS |
| – Percent of Open Interest Longs: | 21.3 | 48.9 | 8.8 |
| – Percent of Open Interest Shorts: | 30.1 | 43.3 | 5.6 |
| – Net Position: | -50,928 | 32,707 | 18,221 |
| – Gross Longs: | 124,466 | 285,129 | 51,140 |
| – Gross Shorts: | 175,394 | 252,422 | 32,919 |
| – Long to Short Ratio: | 0.7 to 1 | 1.1 to 1 | 1.6 to 1 |
| NET POSITION TREND: | | | |
| – Strength Index Score (3 Year Range Pct): | 6.5 | 90.7 | 44.5 |
| – Strength Index Reading (3 Year Range): | Bearish-Extreme | Bullish-Extreme | Bearish |
| NET POSITION MOVEMENT INDEX: | | | |
| – 6-Week Change in Strength Index: | 1.4 | -0.7 | -9.1 |
LIVE CATTLE Futures:
 The LIVE CATTLE large speculator standing this week reached a net position of 110,647 contracts in the data reported through Tuesday. This was a weekly gain of 2,016 contracts from the previous week which had a total of 108,631 net contracts.
This week’s current strength score (the trader positioning range over the past three years, measured from 0 to 100) shows the speculators are currently Bullish-Extreme with a score of 87.5 percent. The commercials are Bearish-Extreme with a score of 15.3 percent and the small traders (not shown in chart) are Bearish-Extreme with a score of 17.1 percent.
Price Trend-Following Model: Strong Uptrend
Our weekly trend-following model classifies the current market price position as: Strong Uptrend.
| LIVE CATTLE Futures Statistics | SPECULATORS | COMMERCIALS | SMALL TRADERS |
| – Percent of Open Interest Longs: | 51.1 | 25.8 | 8.0 |
| – Percent of Open Interest Shorts: | 22.0 | 48.9 | 14.1 |
| – Net Position: | 110,647 | -87,816 | -22,831 |
| – Gross Longs: | 194,275 | 97,817 | 30,544 |
| – Gross Shorts: | 83,628 | 185,633 | 53,375 |
| – Long to Short Ratio: | 2.3 to 1 | 0.5 to 1 | 0.6 to 1 |
| NET POSITION TREND: | | | |
| – Strength Index Score (3 Year Range Pct): | 87.5 | 15.3 | 17.1 |
| – Strength Index Reading (3 Year Range): | Bullish-Extreme | Bearish-Extreme | Bearish-Extreme |
| NET POSITION MOVEMENT INDEX: | | | |
| – 6-Week Change in Strength Index: | -12.5 | 12.3 | 9.5 |
LEAN HOGS Futures:
 The LEAN HOGS large speculator standing this week reached a net position of 46,757 contracts in the data reported through Tuesday. This was a weekly lift of 9,256 contracts from the previous week which had a total of 37,501 net contracts.
This week’s current strength score (the trader positioning range over the past three years, measured from 0 to 100) shows the speculators are currently Bullish with a score of 64.0 percent. The commercials are Bearish with a score of 33.1 percent and the small traders (not shown in chart) are Bullish with a score of 61.7 percent.
Price Trend-Following Model: Weak Downtrend
Our weekly trend-following model classifies the current market price position as: Weak Downtrend.
| LEAN HOGS Futures Statistics | SPECULATORS | COMMERCIALS | SMALL TRADERS |
| – Percent of Open Interest Longs: | 38.5 | 33.3 | 7.4 |
| – Percent of Open Interest Shorts: | 22.3 | 48.5 | 8.3 |
| – Net Position: | 46,757 | -44,113 | -2,644 |
| – Gross Longs: | 111,314 | 96,248 | 21,292 |
| – Gross Shorts: | 64,557 | 140,361 | 23,936 |
| – Long to Short Ratio: | 1.7 to 1 | 0.7 to 1 | 0.9 to 1 |
| NET POSITION TREND: | | | |
| – Strength Index Score (3 Year Range Pct): | 64.0 | 33.1 | 61.7 |
| – Strength Index Reading (3 Year Range): | Bullish | Bearish | Bullish |
| NET POSITION MOVEMENT INDEX: | | | |
| – 6-Week Change in Strength Index: | 12.6 | -14.2 | 2.6 |
COTTON Futures:
 The COTTON large speculator standing this week reached a net position of -17,543 contracts in the data reported through Tuesday. This was a weekly decline of -7,467 contracts from the previous week which had a total of -10,076 net contracts.
This week’s current strength score (the trader positioning range over the past three years, measured from 0 to 100) shows the speculators are currently Bearish with a score of 27.1 percent. The commercials are Bullish with a score of 76.0 percent and the small traders (not shown in chart) are Bearish-Extreme with a score of 6.2 percent.
Price Trend-Following Model: Strong Downtrend
Our weekly trend-following model classifies the current market price position as: Strong Downtrend.
| COTTON Futures Statistics | SPECULATORS | COMMERCIALS | SMALL TRADERS |
| – Percent of Open Interest Longs: | 28.7 | 47.7 | 5.0 |
| – Percent of Open Interest Shorts: | 36.5 | 38.9 | 6.0 |
| – Net Position: | -17,543 | 19,738 | -2,195 |
| – Gross Longs: | 64,575 | 107,157 | 11,294 |
| – Gross Shorts: | 82,118 | 87,419 | 13,489 |
| – Long to Short Ratio: | 0.8 to 1 | 1.2 to 1 | 0.8 to 1 |
| NET POSITION TREND: | | | |
| – Strength Index Score (3 Year Range Pct): | 27.1 | 76.0 | 6.2 |
| – Strength Index Reading (3 Year Range): | Bearish | Bullish | Bearish-Extreme |
| NET POSITION MOVEMENT INDEX: | | | |
| – 6-Week Change in Strength Index: | 14.9 | -11.2 | -34.9 |
COCOA Futures:
 The COCOA large speculator standing this week reached a net position of 20,868 contracts in the data reported through Tuesday. This was a weekly gain of 3,957 contracts from the previous week which had a total of 16,911 net contracts.
This week’s current strength score (the trader positioning range over the past three years, measured from 0 to 100) shows the speculators are currently Bearish with a score of 31.2 percent. The commercials are Bullish with a score of 66.3 percent and the small traders (not shown in chart) are Bullish-Extreme with a score of 83.6 percent.
Price Trend-Following Model: Weak Downtrend
Our weekly trend-following model classifies the current market price position as: Weak Downtrend.
| COCOA Futures Statistics | SPECULATORS | COMMERCIALS | SMALL TRADERS |
| – Percent of Open Interest Longs: | 31.5 | 37.0 | 12.3 |
| – Percent of Open Interest Shorts: | 10.0 | 64.9 | 5.9 |
| – Net Position: | 20,868 | -27,022 | 6,154 |
| – Gross Longs: | 30,518 | 35,859 | 11,897 |
| – Gross Shorts: | 9,650 | 62,881 | 5,743 |
| – Long to Short Ratio: | 3.2 to 1 | 0.6 to 1 | 2.1 to 1 |
| NET POSITION TREND: | | | |
| – Strength Index Score (3 Year Range Pct): | 31.2 | 66.3 | 83.6 |
| – Strength Index Reading (3 Year Range): | Bearish | Bullish | Bullish-Extreme |
| NET POSITION MOVEMENT INDEX: | | | |
| – 6-Week Change in Strength Index: | 2.3 | -5.2 | 30.7 |
WHEAT Futures:
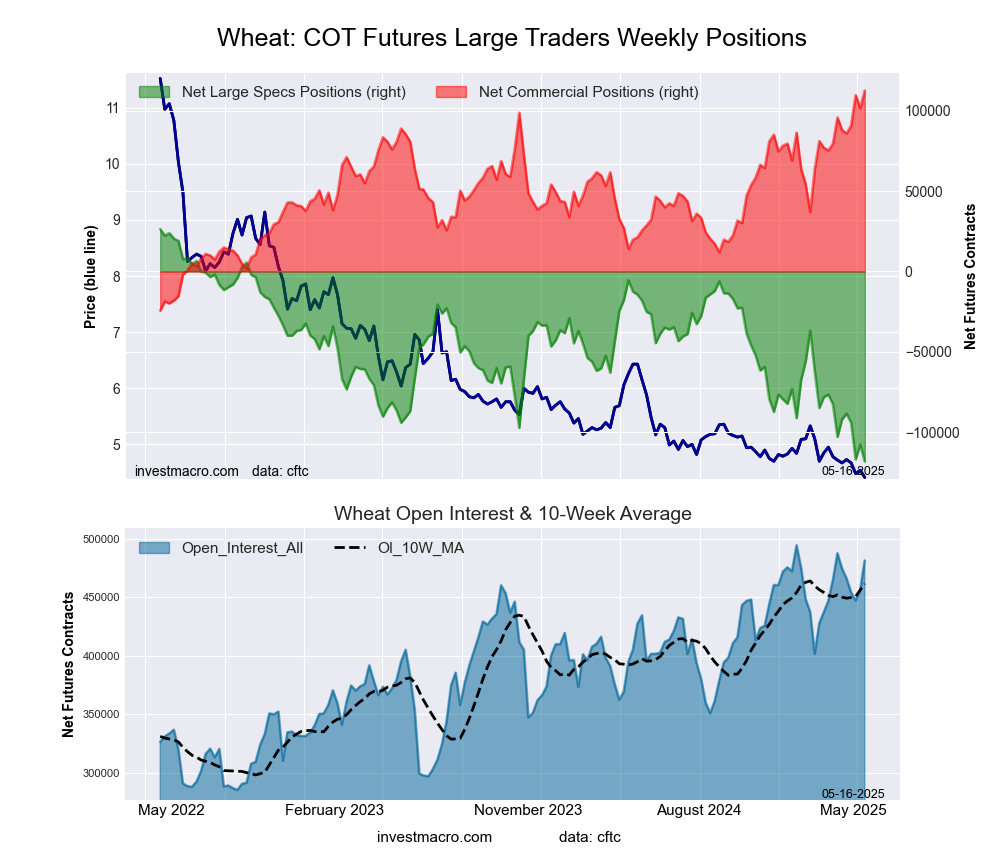 The WHEAT large speculator standing this week reached a net position of -118,100 contracts in the data reported through Tuesday. This was a weekly lowering of -10,563 contracts from the previous week which had a total of -107,537 net contracts.
This week’s current strength score (the trader positioning range over the past three years, measured from 0 to 100) shows the speculators are currently Bearish-Extreme with a score of 0.0 percent. The commercials are Bullish-Extreme with a score of 100.0 percent and the small traders (not shown in chart) are Bullish-Extreme with a score of 87.8 percent.
Price Trend-Following Model: Strong Downtrend
Our weekly trend-following model classifies the current market price position as: Strong Downtrend.
| WHEAT Futures Statistics | SPECULATORS | COMMERCIALS | SMALL TRADERS |
| – Percent of Open Interest Longs: | 26.2 | 38.7 | 8.2 |
| – Percent of Open Interest Shorts: | 50.7 | 15.3 | 7.0 |
| – Net Position: | -118,100 | 112,476 | 5,624 |
| – Gross Longs: | 126,006 | 186,211 | 39,311 |
| – Gross Shorts: | 244,106 | 73,735 | 33,687 |
| – Long to Short Ratio: | 0.5 to 1 | 2.5 to 1 | 1.2 to 1 |
| NET POSITION TREND: | | | |
| – Strength Index Score (3 Year Range Pct): | 0.0 | 100.0 | 87.8 |
| – Strength Index Reading (3 Year Range): | Bearish-Extreme | Bullish-Extreme | Bullish-Extreme |
| NET POSITION MOVEMENT INDEX: | | | |
| – 6-Week Change in Strength Index: | -10.6 | 12.3 | -8.6 |
Article By InvestMacro – Receive our weekly COT Newsletter
*COT Report: The COT data, released weekly to the public each Friday, is updated through the most recent Tuesday (data is 3 days old) and shows a quick view of how large speculators or non-commercials (for-profit traders) were positioned in the futures markets.
The CFTC categorizes trader positions according to commercial hedgers (traders who use futures contracts for hedging as part of the business), non-commercials (large traders who speculate to realize trading profits) and nonreportable traders (usually small traders/speculators) as well as their open interest (contracts open in the market at time of reporting). See CFTC criteria here.