COT Bonds Charts: Weekly Speculator Bets led by 5-Year & 10-Year Bonds

By InvestMacro

Bonds Market Open Interest Comparison
Here are the latest charts and statistics for the Commitment of Traders (COT) reports data published by the Commodities Futures Trading Commission (CFTC).

The latest COT data is updated through Tuesday May 13th and shows a quick view of how large traders (for-profit speculators and commercial hedgers) were positioned in the futures markets.

Weekly Speculator Changes led by 5-Year & 10-Year Bonds

Bonds Market Net Speculators Positions
The COT bond market speculator bets were overall higher this week as six out of the nine bond markets we cover had higher positioning while the other three markets had lower speculator contracts.

Leading the gains for the bond markets was the 5-Year Bonds (116,453 contracts) with the 10-Year Bonds (62,817 contracts), the Fed Funds (36,496 contracts), the US Treasury Bonds (18,160 contracts), the Ultra Treasury Bonds (3,553 contracts) and the SOFR 1-Month (3,019 contracts) also showing positive weeks.

The bond markets with declines in speculator bets for the week were the Ultra 10-Year Bonds (-35,910 contracts), the SOFR 3-Months (-6,465 contracts) and with the 2-Year Bonds (-1,439 contracts) also seeing lower bets on the week.


Bonds Data:

Bonds Market Speculators Data Table
Legend: Open Interest | Speculators Current Net Position | Weekly Specs Change | Specs Strength Score compared to last 3-Years (0-100 range)


Strength Scores led by Ultra Treasury Bonds & SOFR 1-Month

Bonds Market Strength Index Comparison
COT Strength Scores (a normalized measure of Speculator positions over a 3-Year range, from 0 to 100 where above 80 is Extreme-Bullish and below 20 is Extreme-Bearish) showed that the Ultra Treasury Bonds (75 percent) and the SOFR 1-Month (67 percent) lead the bond markets this week. The US Treasury Bonds (56 percent) comes in as the next highest in the weekly strength scores.

On the downside, the Ultra 10-Year Bond (0 percent), the 5-Year Bonds (5 percent) and the 2-Year Bonds (18 percent) come in at the lowest strength level currently and are in Extreme-Bearish territory (below 20 percent). The next lowest strength scores were the SOFR 3-Months (22 percent) and the 10-Year Bonds (24 percent).

Strength Statistics:
Fed Funds (39.9 percent) vs Fed Funds previous week (33.2 percent)
2-Year Bond (18.2 percent) vs 2-Year Bond previous week (18.3 percent)
5-Year Bond (5.3 percent) vs 5-Year Bond previous week (0.0 percent)
10-Year Bond (24.5 percent) vs 10-Year Bond previous week (18.4 percent)
Ultra 10-Year Bond (0.0 percent) vs Ultra 10-Year Bond previous week (11.5 percent)
US Treasury Bond (56.4 percent) vs US Treasury Bond previous week (50.0 percent)
Ultra US Treasury Bond (74.6 percent) vs Ultra US Treasury Bond previous week (73.2 percent)
SOFR 1-Month (67.2 percent) vs SOFR 1-Month previous week (66.5 percent)
SOFR 3-Months (21.8 percent) vs SOFR 3-Months previous week (22.1 percent)


Fed Funds & SOFR 1-Month top the 6-Week Strength Trends

Bonds Market Trend Index Comparison
COT Strength Score Trends (or move index, calculates the 6-week changes in strength scores) showed that the Fed Funds (13 percent) and the SOFR 1-Month (9 percent) lead the past six weeks trends for bonds.

The Ultra 10-Year Bond (-68 percent), the US Treasury Bonds (-16 percent) and the 5-Year Bonds (-7 percent) leads the downside trend scores currently.

Strength Trend Statistics:
Fed Funds (13.0 percent) vs Fed Funds previous week (-0.4 percent)
2-Year Bond (0.3 percent) vs 2-Year Bond previous week (-2.7 percent)
5-Year Bond (-7.2 percent) vs 5-Year Bond previous week (-18.1 percent)
10-Year Bond (-2.6 percent) vs 10-Year Bond previous week (-13.8 percent)
Ultra 10-Year Bond (-68.3 percent) vs Ultra 10-Year Bond previous week (-63.7 percent)
US Treasury Bond (-15.6 percent) vs US Treasury Bond previous week (-20.0 percent)
Ultra US Treasury Bond (-2.7 percent) vs Ultra US Treasury Bond previous week (-12.4 percent)
SOFR 1-Month (8.7 percent) vs SOFR 1-Month previous week (11.0 percent)
SOFR 3-Months (5.5 percent) vs SOFR 3-Months previous week (1.1 percent)


30-Day Federal Funds Futures:

Federal Funds 30-Day Bonds Futures COT Chart
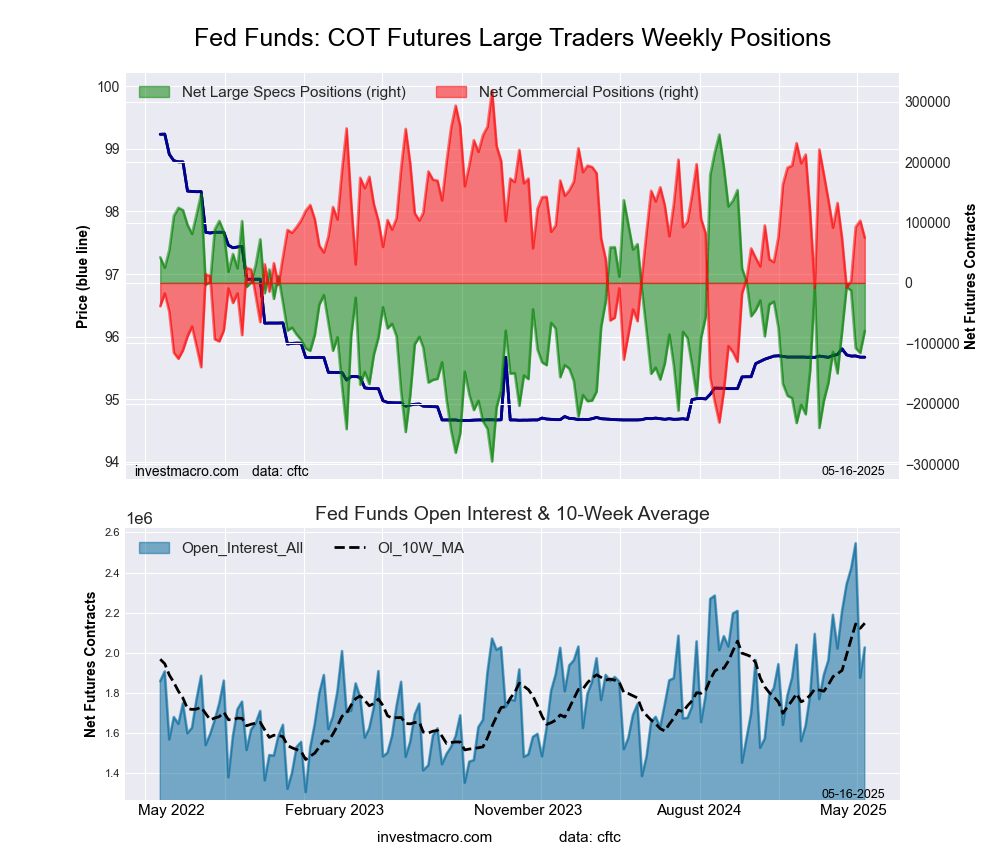
The 30-Day Federal Funds large speculator standing this week resulted in a net position of -79,469 contracts in the data reported through Tuesday. This was a weekly lift of 36,496 contracts from the previous week which had a total of -115,965 net contracts.

This week’s current strength score (the trader positioning range over the past three years, measured from 0 to 100) shows the speculators are currently Bearish with a score of 39.9 percent. The commercials are Bullish with a score of 55.7 percent and the small traders (not shown in chart) are Bullish with a score of 68.0 percent.

Price Trend-Following Model: Downtrend

Our weekly trend-following model classifies the current market price position as: Downtrend.

30-Day Federal Funds StatisticsSPECULATORSCOMMERCIALSSMALL TRADERS
– Percent of Open Interest Longs:18.066.83.0
– Percent of Open Interest Shorts:21.963.12.8
– Net Position:-79,46974,8674,602
– Gross Longs:365,2901,354,08560,600
– Gross Shorts:444,7591,279,21855,998
– Long to Short Ratio:0.8 to 11.1 to 11.1 to 1
NET POSITION TREND:
– Strength Index Score (3 Year Range Pct):39.955.768.0
– Strength Index Reading (3 Year Range):BearishBullishBullish
NET POSITION MOVEMENT INDEX:
– 6-Week Change in Strength Index:13.0-10.4-17.2


Secured Overnight Financing Rate (3-Month) Futures:

SOFR 3-Months Bonds Futures COT Chart
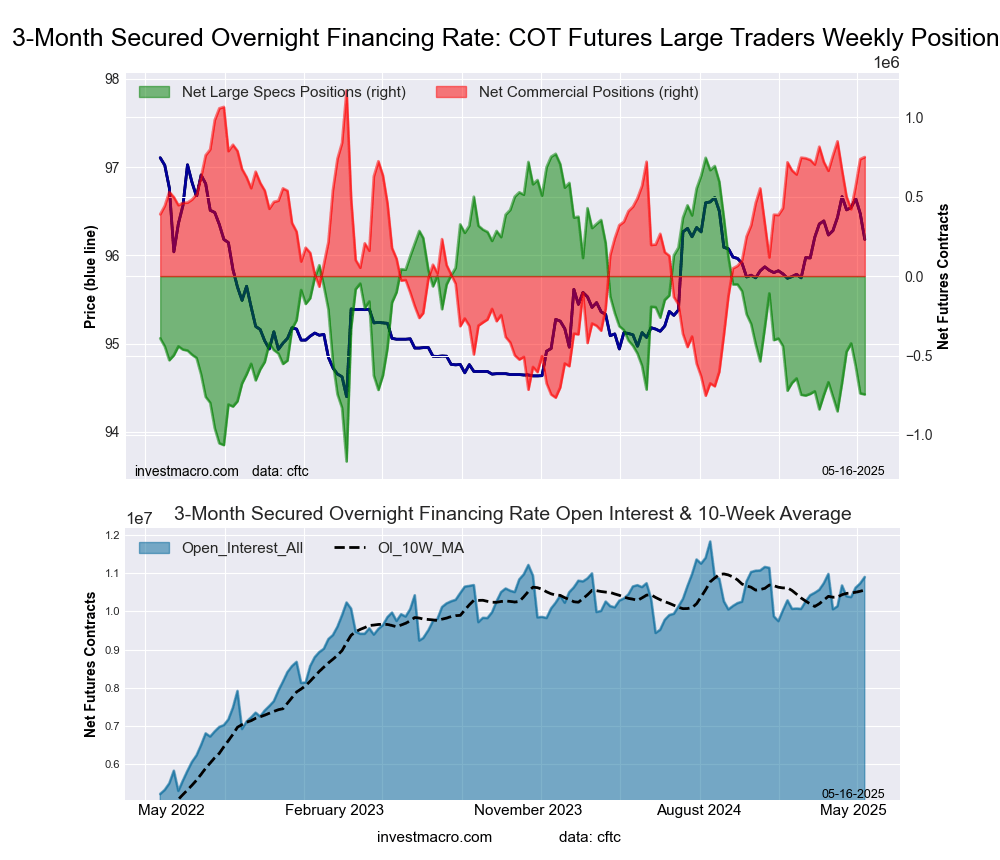
The Secured Overnight Financing Rate (3-Month) large speculator standing this week resulted in a net position of -744,868 contracts in the data reported through Tuesday. This was a weekly reduction of -6,465 contracts from the previous week which had a total of -738,403 net contracts.

This week’s current strength score (the trader positioning range over the past three years, measured from 0 to 100) shows the speculators are currently Bearish with a score of 21.8 percent. The commercials are Bullish with a score of 78.3 percent and the small traders (not shown in chart) are Bullish-Extreme with a score of 81.5 percent.

Price Trend-Following Model: Weak Uptrend

Our weekly trend-following model classifies the current market price position as: Weak Uptrend.

SOFR 3-Months StatisticsSPECULATORSCOMMERCIALSSMALL TRADERS
– Percent of Open Interest Longs:11.760.60.9
– Percent of Open Interest Shorts:18.553.70.9
– Net Position:-744,868749,170-4,302
– Gross Longs:1,274,5386,601,97195,390
– Gross Shorts:2,019,4065,852,80199,692
– Long to Short Ratio:0.6 to 11.1 to 11.0 to 1
NET POSITION TREND:
– Strength Index Score (3 Year Range Pct):21.878.381.5
– Strength Index Reading (3 Year Range):BearishBullishBullish-Extreme
NET POSITION MOVEMENT INDEX:
– 6-Week Change in Strength Index:5.5-5.1-3.9


Individual Bond Markets:

Secured Overnight Financing Rate (1-Month) Futures:

SOFR 1-Month Bonds Futures COT ChartThe Secured Overnight Financing Rate (1-Month) large speculator standing this week resulted in a net position of -5,072 contracts in the data reported through Tuesday. This was a weekly boost of 3,019 contracts from the previous week which had a total of -8,091 net contracts.

This week’s current strength score (the trader positioning range over the past three years, measured from 0 to 100) shows the speculators are currently Bullish with a score of 67.2 percent. The commercials are Bearish with a score of 28.9 percent and the small traders (not shown in chart) are Bullish-Extreme with a score of 100.0 percent.

Price Trend-Following Model: Weak Downtrend

Our weekly trend-following model classifies the current market price position as: Weak Downtrend.

SOFR 1-Month StatisticsSPECULATORSCOMMERCIALSSMALL TRADERS
– Percent of Open Interest Longs:16.563.71.9
– Percent of Open Interest Shorts:16.964.60.6
– Net Position:-5,072-10,92916,001
– Gross Longs:199,970774,06223,195
– Gross Shorts:205,042784,9917,194
– Long to Short Ratio:1.0 to 11.0 to 13.2 to 1
NET POSITION TREND:
– Strength Index Score (3 Year Range Pct):67.228.9100.0
– Strength Index Reading (3 Year Range):BullishBearishBullish-Extreme
NET POSITION MOVEMENT INDEX:
– 6-Week Change in Strength Index:8.7-14.851.4


2-Year Treasury Note Futures:

2-Year Treasury Bonds Futures COT Chart
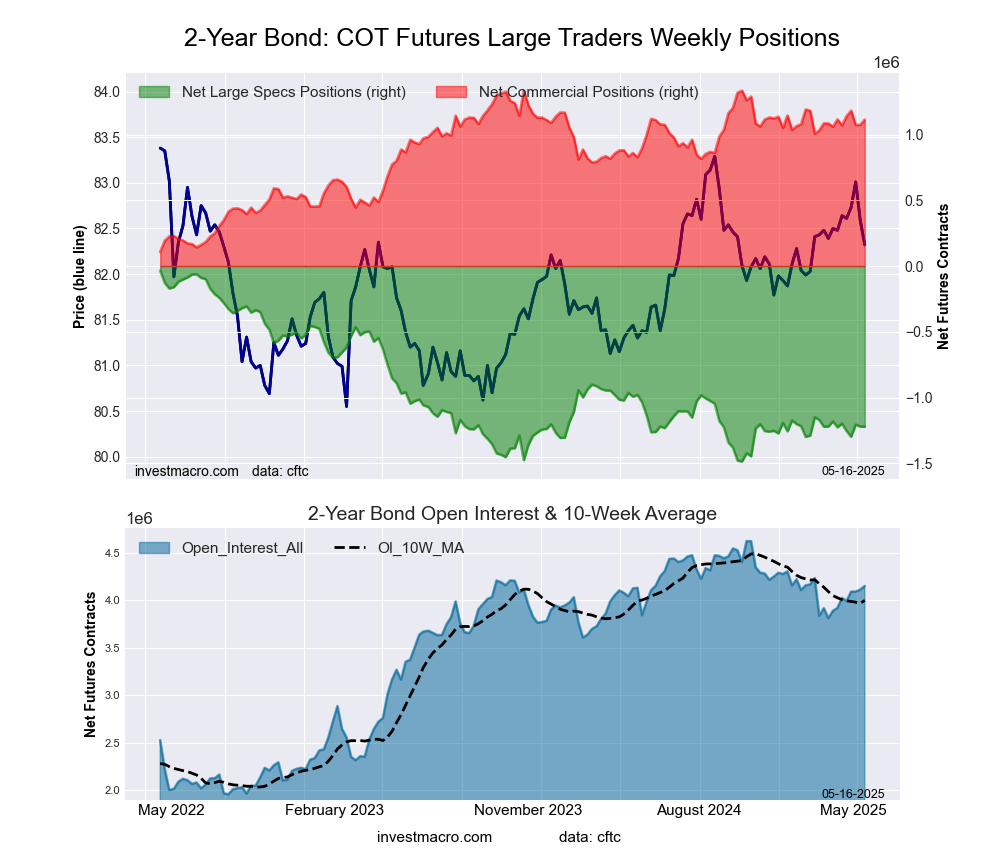
The 2-Year Treasury Note large speculator standing this week resulted in a net position of -1,222,232 contracts in the data reported through Tuesday. This was a weekly decrease of -1,439 contracts from the previous week which had a total of -1,220,793 net contracts.

This week’s current strength score (the trader positioning range over the past three years, measured from 0 to 100) shows the speculators are currently Bearish-Extreme with a score of 18.2 percent. The commercials are Bullish-Extreme with a score of 82.0 percent and the small traders (not shown in chart) are Bullish with a score of 69.5 percent.

Price Trend-Following Model: Uptrend

Our weekly trend-following model classifies the current market price position as: Uptrend.

2-Year Treasury Note StatisticsSPECULATORSCOMMERCIALSSMALL TRADERS
– Percent of Open Interest Longs:13.677.76.0
– Percent of Open Interest Shorts:43.050.93.3
– Net Position:-1,222,2321,113,426108,806
– Gross Longs:562,7623,224,121247,644
– Gross Shorts:1,784,9942,110,695138,838
– Long to Short Ratio:0.3 to 11.5 to 11.8 to 1
NET POSITION TREND:
– Strength Index Score (3 Year Range Pct):18.282.069.5
– Strength Index Reading (3 Year Range):Bearish-ExtremeBullish-ExtremeBullish
NET POSITION MOVEMENT INDEX:
– 6-Week Change in Strength Index:0.3-0.1-0.9


5-Year Treasury Note Futures:

5-Year Treasury Bonds Futures COT Chart
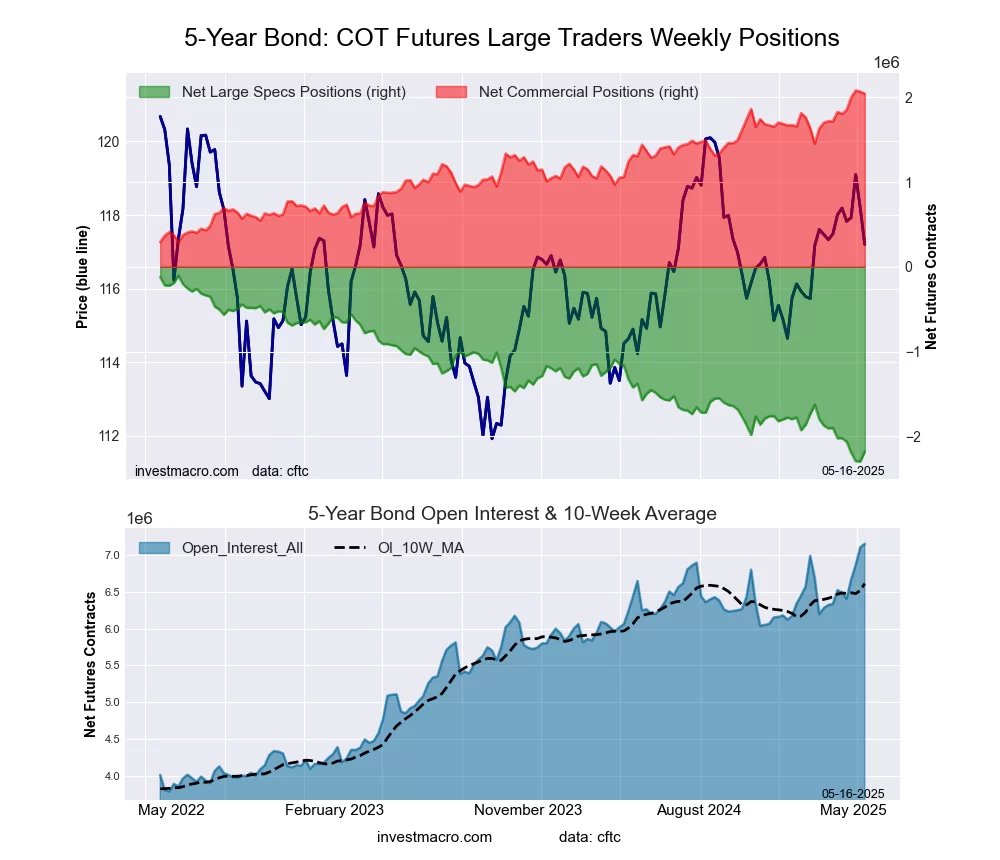
The 5-Year Treasury Note large speculator standing this week resulted in a net position of -2,180,043 contracts in the data reported through Tuesday. This was a weekly boost of 116,453 contracts from the previous week which had a total of -2,296,496 net contracts.

This week’s current strength score (the trader positioning range over the past three years, measured from 0 to 100) shows the speculators are currently Bearish-Extreme with a score of 5.3 percent. The commercials are Bullish-Extreme with a score of 97.9 percent and the small traders (not shown in chart) are Bullish with a score of 74.3 percent.

Price Trend-Following Model: Uptrend

Our weekly trend-following model classifies the current market price position as: Uptrend.

5-Year Treasury Note StatisticsSPECULATORSCOMMERCIALSSMALL TRADERS
– Percent of Open Interest Longs:8.281.26.4
– Percent of Open Interest Shorts:38.752.74.5
– Net Position:-2,180,0432,041,577138,466
– Gross Longs:587,1925,807,519460,064
– Gross Shorts:2,767,2353,765,942321,598
– Long to Short Ratio:0.2 to 11.5 to 11.4 to 1
NET POSITION TREND:
– Strength Index Score (3 Year Range Pct):5.397.974.3
– Strength Index Reading (3 Year Range):Bearish-ExtremeBullish-ExtremeBullish
NET POSITION MOVEMENT INDEX:
– 6-Week Change in Strength Index:-7.212.0-13.0


10-Year Treasury Note Futures:

10-Year Treasury Notes Bonds Futures COT ChartThe 10-Year Treasury Note large speculator standing this week resulted in a net position of -890,351 contracts in the data reported through Tuesday. This was a weekly boost of 62,817 contracts from the previous week which had a total of -953,168 net contracts.

This week’s current strength score (the trader positioning range over the past three years, measured from 0 to 100) shows the speculators are currently Bearish with a score of 24.5 percent. The commercials are Bullish with a score of 77.3 percent and the small traders (not shown in chart) are Bullish with a score of 77.2 percent.

Price Trend-Following Model: Uptrend

Our weekly trend-following model classifies the current market price position as: Uptrend.

10-Year Treasury Note StatisticsSPECULATORSCOMMERCIALSSMALL TRADERS
– Percent of Open Interest Longs:9.377.48.8
– Percent of Open Interest Shorts:26.661.87.2
– Net Position:-890,351805,05385,298
– Gross Longs:480,1713,993,517454,804
– Gross Shorts:1,370,5223,188,464369,506
– Long to Short Ratio:0.4 to 11.3 to 11.2 to 1
NET POSITION TREND:
– Strength Index Score (3 Year Range Pct):24.577.377.2
– Strength Index Reading (3 Year Range):BearishBullishBullish
NET POSITION MOVEMENT INDEX:
– 6-Week Change in Strength Index:-2.67.5-10.1


Ultra 10-Year Notes Futures:

Ultra 10-Year Treasury Notes Bonds Futures COT ChartThe Ultra 10-Year Notes large speculator standing this week resulted in a net position of -319,607 contracts in the data reported through Tuesday. This was a weekly decline of -35,910 contracts from the previous week which had a total of -283,697 net contracts.

This week’s current strength score (the trader positioning range over the past three years, measured from 0 to 100) shows the speculators are currently Bearish-Extreme with a score of 0.0 percent. The commercials are Bullish-Extreme with a score of 95.3 percent and the small traders (not shown in chart) are Bullish-Extreme with a score of 93.6 percent.

Price Trend-Following Model: Weak Uptrend

Our weekly trend-following model classifies the current market price position as: Weak Uptrend.

Ultra 10-Year Notes StatisticsSPECULATORSCOMMERCIALSSMALL TRADERS
– Percent of Open Interest Longs:12.476.410.0
– Percent of Open Interest Shorts:26.161.910.8
– Net Position:-319,607337,514-17,907
– Gross Longs:287,3041,776,279232,514
– Gross Shorts:606,9111,438,765250,421
– Long to Short Ratio:0.5 to 11.2 to 10.9 to 1
NET POSITION TREND:
– Strength Index Score (3 Year Range Pct):0.095.393.6
– Strength Index Reading (3 Year Range):Bearish-ExtremeBullish-ExtremeBullish-Extreme
NET POSITION MOVEMENT INDEX:
– 6-Week Change in Strength Index:-68.381.05.7


US Treasury Bonds Futures:

US Year Treasury Notes Long Bonds Futures COT ChartThe US Treasury Bonds large speculator standing this week resulted in a net position of -77,629 contracts in the data reported through Tuesday. This was a weekly advance of 18,160 contracts from the previous week which had a total of -95,789 net contracts.

This week’s current strength score (the trader positioning range over the past three years, measured from 0 to 100) shows the speculators are currently Bullish with a score of 56.4 percent. The commercials are Bearish with a score of 33.0 percent and the small traders (not shown in chart) are Bullish-Extreme with a score of 85.4 percent.

Price Trend-Following Model: Weak Uptrend

Our weekly trend-following model classifies the current market price position as: Weak Uptrend.

US Treasury Bonds StatisticsSPECULATORSCOMMERCIALSSMALL TRADERS
– Percent of Open Interest Longs:10.174.912.6
– Percent of Open Interest Shorts:14.376.07.2
– Net Position:-77,629-20,57798,206
– Gross Longs:184,7891,369,783230,861
– Gross Shorts:262,4181,390,360132,655
– Long to Short Ratio:0.7 to 11.0 to 11.7 to 1
NET POSITION TREND:
– Strength Index Score (3 Year Range Pct):56.433.085.4
– Strength Index Reading (3 Year Range):BullishBearishBullish-Extreme
NET POSITION MOVEMENT INDEX:
– 6-Week Change in Strength Index:-15.614.6-3.8


Ultra US Treasury Bonds Futures:

Ultra US Year Treasury Notes Long Bonds Futures COT ChartThe Ultra US Treasury Bonds large speculator standing this week resulted in a net position of -261,222 contracts in the data reported through Tuesday. This was a weekly boost of 3,553 contracts from the previous week which had a total of -264,775 net contracts.

This week’s current strength score (the trader positioning range over the past three years, measured from 0 to 100) shows the speculators are currently Bullish with a score of 74.6 percent. The commercials are Bearish with a score of 29.5 percent and the small traders (not shown in chart) are Bearish with a score of 46.9 percent.

Price Trend-Following Model: Weak Uptrend

Our weekly trend-following model classifies the current market price position as: Weak Uptrend.

Ultra US Treasury Bonds StatisticsSPECULATORSCOMMERCIALSSMALL TRADERS
– Percent of Open Interest Longs:6.382.59.5
– Percent of Open Interest Shorts:20.170.18.1
– Net Position:-261,222234,24026,982
– Gross Longs:120,6051,568,207180,961
– Gross Shorts:381,8271,333,967153,979
– Long to Short Ratio:0.3 to 11.2 to 11.2 to 1
NET POSITION TREND:
– Strength Index Score (3 Year Range Pct):74.629.546.9
– Strength Index Reading (3 Year Range):BullishBearishBearish
NET POSITION MOVEMENT INDEX:
– 6-Week Change in Strength Index:-2.74.6-5.9


Article By InvestMacroReceive our weekly COT Newsletter

*COT Report: The COT data, released weekly to the public each Friday, is updated through the most recent Tuesday (data is 3 days old) and shows a quick view of how large speculators or non-commercials (for-profit traders) were positioned in the futures markets.

The CFTC categorizes trader positions according to commercial hedgers (traders who use futures contracts for hedging as part of the business), non-commercials (large traders who speculate to realize trading profits) and nonreportable traders (usually small traders/speculators) as well as their open interest (contracts open in the market at time of reporting). See CFTC criteria here.

COT Soft Commodities Charts: Speculator Bets led higher by Soybeans & Lean Hogs

By InvestMacro

Speculators OI Softs
Here are the latest charts and statistics for the Commitment of Traders (COT) reports data published by the Commodities Futures Trading Commission (CFTC).

The latest COT data is updated through Tuesday May 13th and shows a quick view of how large traders (for-profit speculators and commercial entities) were positioned in the futures markets.

Weekly Speculator Changes led by Soybeans & Lean Hogs

Speculators Nets Softs
The COT soft commodities markets speculator bets were overall higher this week as seven out of the eleven softs markets we cover had higher positioning while the other four markets had lower speculator contracts.

Leading the gains for the softs markets was Soybeans (15,793 contracts) with Lean Hogs (9,256 contracts), Soybean Oil (7,294 contracts), Sugar (6,490 contracts), Cocoa (3,957 contracts), Soybean Meal (3,027 contracts) and Live Cattle (2,016 contracts) also having positive weeks.

The markets with the declines in speculator bets this week were Corn (-97,793 contracts), Wheat (-10,563 contracts), Coffee (-3,271 contracts) and with Cotton (-7,467 contracts) also registering lower bets on the week.


Soft Commodities Data:

Speculators Table Softs
Legend: Weekly Speculators Change | Speculators Current Net Position | Speculators Strength Score compared to last 3-Years (0-100 range)


Strength Scores led by Live Cattle & Soybean Oil

Speculators Strength Softs
COT Strength Scores (a normalized measure of Speculator positions over a 3-Year range, from 0 to 100 where above 80 is Extreme-Bullish and below 20 is Extreme-Bearish) showed that Live Cattle (88 percent) and Soybean Oil (83 percent) lead the softs markets this week. Coffee (71 percent), Soybeans (67 percent) and Lean Hogs (64 percent) come in as the next highest in the weekly strength scores.

On the downside, Wheat (0 percent) and Soybean Meal (7 percent) come in at the lowest strength levels currently and are in Extreme-Bearish territory (below 20 percent). The next lowest strength scores are the Sugar (20 percent) and the Cotton (27 percent).

Strength Statistics:
Corn (38.7 percent) vs Corn previous week (52.0 percent)
Sugar (19.8 percent) vs Sugar previous week (17.8 percent)
Coffee (70.5 percent) vs Coffee previous week (73.7 percent)
Soybeans (67.2 percent) vs Soybeans previous week (63.2 percent)
Soybean Oil (82.8 percent) vs Soybean Oil previous week (78.8 percent)
Soybean Meal (6.5 percent) vs Soybean Meal previous week (5.3 percent)
Live Cattle (87.5 percent) vs Live Cattle previous week (85.6 percent)
Lean Hogs (64.0 percent) vs Lean Hogs previous week (56.8 percent)
Cotton (27.1 percent) vs Cotton previous week (31.7 percent)
Cocoa (31.2 percent) vs Cocoa previous week (27.2 percent)
Wheat (0.0 percent) vs Wheat previous week (7.3 percent)


Soybean Oil & Soybeans top the 6-Week Strength Trends

Speculators Trend Softs
COT Strength Score Trends (or move index, calculates the 6-week changes in strength scores) showed that Soybean Oil (34 percent) and Soybeans (18 percent) lead the past six weeks trends for soft commodities. Cotton (15 percent), Lean Hogs (13 percent) and Cocoa (2 percent) are the next highest positive movers in the latest trends data.

Corn (-20 percent) leads the downside trend scores currently with Live Cattle (-12 percent) and Wheat (-11 percent) following next with lower trend scores.

Strength Trend Statistics:
Corn (-20.2 percent) vs Corn previous week (-11.5 percent)
Sugar (-7.7 percent) vs Sugar previous week (-9.5 percent)
Coffee (-7.7 percent) vs Coffee previous week (-8.8 percent)
Soybeans (17.6 percent) vs Soybeans previous week (16.3 percent)
Soybean Oil (34.3 percent) vs Soybean Oil previous week (49.9 percent)
Soybean Meal (1.4 percent) vs Soybean Meal previous week (-1.9 percent)
Live Cattle (-12.5 percent) vs Live Cattle previous week (-9.0 percent)
Lean Hogs (12.6 percent) vs Lean Hogs previous week (6.3 percent)
Cotton (14.9 percent) vs Cotton previous week (26.7 percent)
Cocoa (2.3 percent) vs Cocoa previous week (-1.4 percent)
Wheat (-10.6 percent) vs Wheat previous week (-17.3 percent)


Individual Soft Commodities Markets:

CORN Futures:

CORN Futures COT ChartThe CORN large speculator standing this week reached a net position of 18,106 contracts in the data reported through Tuesday. This was a weekly reduction of -97,793 contracts from the previous week which had a total of 115,899 net contracts.

This week’s current strength score (the trader positioning range over the past three years, measured from 0 to 100) shows the speculators are currently Bearish with a score of 38.7 percent. The commercials are Bullish with a score of 59.2 percent and the small traders (not shown in chart) are Bullish with a score of 70.2 percent.

Price Trend-Following Model: Strong Downtrend

Our weekly trend-following model classifies the current market price position as: Strong Downtrend.

CORN Futures StatisticsSPECULATORSCOMMERCIALSSMALL TRADERS
– Percent of Open Interest Longs:21.546.38.7
– Percent of Open Interest Shorts:20.345.410.6
– Net Position:18,10613,151-31,257
– Gross Longs:341,178735,478137,591
– Gross Shorts:323,072722,327168,848
– Long to Short Ratio:1.1 to 11.0 to 10.8 to 1
NET POSITION TREND:
– Strength Index Score (3 Year Range Pct):38.759.270.2
– Strength Index Reading (3 Year Range):BearishBullishBullish
NET POSITION MOVEMENT INDEX:
– 6-Week Change in Strength Index:-20.218.928.3


SUGAR Futures:

SUGAR Futures COT ChartThe SUGAR large speculator standing this week reached a net position of 28,930 contracts in the data reported through Tuesday. This was a weekly rise of 6,490 contracts from the previous week which had a total of 22,440 net contracts.

This week’s current strength score (the trader positioning range over the past three years, measured from 0 to 100) shows the speculators are currently Bearish-Extreme with a score of 19.8 percent. The commercials are Bullish-Extreme with a score of 82.1 percent and the small traders (not shown in chart) are Bearish with a score of 24.0 percent.

Price Trend-Following Model: Weak Uptrend

Our weekly trend-following model classifies the current market price position as: Weak Uptrend.

SUGAR Futures StatisticsSPECULATORSCOMMERCIALSSMALL TRADERS
– Percent of Open Interest Longs:25.551.68.3
– Percent of Open Interest Shorts:21.855.68.0
– Net Position:28,930-31,2822,352
– Gross Longs:200,858406,50065,256
– Gross Shorts:171,928437,78262,904
– Long to Short Ratio:1.2 to 10.9 to 11.0 to 1
NET POSITION TREND:
– Strength Index Score (3 Year Range Pct):19.882.124.0
– Strength Index Reading (3 Year Range):Bearish-ExtremeBullish-ExtremeBearish
NET POSITION MOVEMENT INDEX:
– 6-Week Change in Strength Index:-7.710.9-22.3


COFFEE Futures:

COFFEE Futures COT ChartThe COFFEE large speculator standing this week reached a net position of 46,070 contracts in the data reported through Tuesday. This was a weekly decrease of -3,271 contracts from the previous week which had a total of 49,341 net contracts.

This week’s current strength score (the trader positioning range over the past three years, measured from 0 to 100) shows the speculators are currently Bullish with a score of 70.5 percent. The commercials are Bearish with a score of 30.8 percent and the small traders (not shown in chart) are Bullish with a score of 57.1 percent.

Price Trend-Following Model: Uptrend

Our weekly trend-following model classifies the current market price position as: Uptrend.

COFFEE Futures StatisticsSPECULATORSCOMMERCIALSSMALL TRADERS
– Percent of Open Interest Longs:36.638.15.5
– Percent of Open Interest Shorts:6.869.44.0
– Net Position:46,070-48,3902,320
– Gross Longs:56,60358,8628,530
– Gross Shorts:10,533107,2526,210
– Long to Short Ratio:5.4 to 10.5 to 11.4 to 1
NET POSITION TREND:
– Strength Index Score (3 Year Range Pct):70.530.857.1
– Strength Index Reading (3 Year Range):BullishBearishBullish
NET POSITION MOVEMENT INDEX:
– 6-Week Change in Strength Index:-7.77.9-4.8


SOYBEANS Futures:

SOYBEANS Futures COT ChartThe SOYBEANS large speculator standing this week reached a net position of 65,178 contracts in the data reported through Tuesday. This was a weekly lift of 15,793 contracts from the previous week which had a total of 49,385 net contracts.

This week’s current strength score (the trader positioning range over the past three years, measured from 0 to 100) shows the speculators are currently Bullish with a score of 67.2 percent. The commercials are Bearish with a score of 30.0 percent and the small traders (not shown in chart) are Bullish with a score of 78.0 percent.

Price Trend-Following Model: Weak Downtrend

Our weekly trend-following model classifies the current market price position as: Weak Downtrend.

SOYBEANS Futures StatisticsSPECULATORSCOMMERCIALSSMALL TRADERS
– Percent of Open Interest Longs:23.048.05.8
– Percent of Open Interest Shorts:15.054.37.4
– Net Position:65,178-51,976-13,202
– Gross Longs:188,820394,90047,999
– Gross Shorts:123,642446,87661,201
– Long to Short Ratio:1.5 to 10.9 to 10.8 to 1
NET POSITION TREND:
– Strength Index Score (3 Year Range Pct):67.230.078.0
– Strength Index Reading (3 Year Range):BullishBearishBullish
NET POSITION MOVEMENT INDEX:
– 6-Week Change in Strength Index:17.6-20.923.1


SOYBEAN OIL Futures:

SOYBEAN OIL Futures COT ChartThe SOYBEAN OIL large speculator standing this week reached a net position of 74,199 contracts in the data reported through Tuesday. This was a weekly increase of 7,294 contracts from the previous week which had a total of 66,905 net contracts.

This week’s current strength score (the trader positioning range over the past three years, measured from 0 to 100) shows the speculators are currently Bullish-Extreme with a score of 82.8 percent. The commercials are Bearish-Extreme with a score of 18.9 percent and the small traders (not shown in chart) are Bullish with a score of 58.0 percent.

Price Trend-Following Model: Strong Uptrend

Our weekly trend-following model classifies the current market price position as: Strong Uptrend.

SOYBEAN OIL Futures StatisticsSPECULATORSCOMMERCIALSSMALL TRADERS
– Percent of Open Interest Longs:26.744.76.1
– Percent of Open Interest Shorts:14.059.04.5
– Net Position:74,199-83,8129,613
– Gross Longs:156,359261,55635,793
– Gross Shorts:82,160345,36826,180
– Long to Short Ratio:1.9 to 10.8 to 11.4 to 1
NET POSITION TREND:
– Strength Index Score (3 Year Range Pct):82.818.958.0
– Strength Index Reading (3 Year Range):Bullish-ExtremeBearish-ExtremeBullish
NET POSITION MOVEMENT INDEX:
– 6-Week Change in Strength Index:34.3-34.523.5


SOYBEAN MEAL Futures:

SOYBEAN MEAL Futures COT ChartThe SOYBEAN MEAL large speculator standing this week reached a net position of -50,928 contracts in the data reported through Tuesday. This was a weekly boost of 3,027 contracts from the previous week which had a total of -53,955 net contracts.

This week’s current strength score (the trader positioning range over the past three years, measured from 0 to 100) shows the speculators are currently Bearish-Extreme with a score of 6.5 percent. The commercials are Bullish-Extreme with a score of 90.7 percent and the small traders (not shown in chart) are Bearish with a score of 44.5 percent.

Price Trend-Following Model: Strong Downtrend

Our weekly trend-following model classifies the current market price position as: Strong Downtrend.

SOYBEAN MEAL Futures StatisticsSPECULATORSCOMMERCIALSSMALL TRADERS
– Percent of Open Interest Longs:21.348.98.8
– Percent of Open Interest Shorts:30.143.35.6
– Net Position:-50,92832,70718,221
– Gross Longs:124,466285,12951,140
– Gross Shorts:175,394252,42232,919
– Long to Short Ratio:0.7 to 11.1 to 11.6 to 1
NET POSITION TREND:
– Strength Index Score (3 Year Range Pct):6.590.744.5
– Strength Index Reading (3 Year Range):Bearish-ExtremeBullish-ExtremeBearish
NET POSITION MOVEMENT INDEX:
– 6-Week Change in Strength Index:1.4-0.7-9.1


LIVE CATTLE Futures:

LIVE CATTLE Futures COT ChartThe LIVE CATTLE large speculator standing this week reached a net position of 110,647 contracts in the data reported through Tuesday. This was a weekly gain of 2,016 contracts from the previous week which had a total of 108,631 net contracts.

This week’s current strength score (the trader positioning range over the past three years, measured from 0 to 100) shows the speculators are currently Bullish-Extreme with a score of 87.5 percent. The commercials are Bearish-Extreme with a score of 15.3 percent and the small traders (not shown in chart) are Bearish-Extreme with a score of 17.1 percent.

Price Trend-Following Model: Strong Uptrend

Our weekly trend-following model classifies the current market price position as: Strong Uptrend.

LIVE CATTLE Futures StatisticsSPECULATORSCOMMERCIALSSMALL TRADERS
– Percent of Open Interest Longs:51.125.88.0
– Percent of Open Interest Shorts:22.048.914.1
– Net Position:110,647-87,816-22,831
– Gross Longs:194,27597,81730,544
– Gross Shorts:83,628185,63353,375
– Long to Short Ratio:2.3 to 10.5 to 10.6 to 1
NET POSITION TREND:
– Strength Index Score (3 Year Range Pct):87.515.317.1
– Strength Index Reading (3 Year Range):Bullish-ExtremeBearish-ExtremeBearish-Extreme
NET POSITION MOVEMENT INDEX:
– 6-Week Change in Strength Index:-12.512.39.5


LEAN HOGS Futures:

LEAN HOGS Futures COT ChartThe LEAN HOGS large speculator standing this week reached a net position of 46,757 contracts in the data reported through Tuesday. This was a weekly lift of 9,256 contracts from the previous week which had a total of 37,501 net contracts.

This week’s current strength score (the trader positioning range over the past three years, measured from 0 to 100) shows the speculators are currently Bullish with a score of 64.0 percent. The commercials are Bearish with a score of 33.1 percent and the small traders (not shown in chart) are Bullish with a score of 61.7 percent.

Price Trend-Following Model: Weak Downtrend

Our weekly trend-following model classifies the current market price position as: Weak Downtrend.

LEAN HOGS Futures StatisticsSPECULATORSCOMMERCIALSSMALL TRADERS
– Percent of Open Interest Longs:38.533.37.4
– Percent of Open Interest Shorts:22.348.58.3
– Net Position:46,757-44,113-2,644
– Gross Longs:111,31496,24821,292
– Gross Shorts:64,557140,36123,936
– Long to Short Ratio:1.7 to 10.7 to 10.9 to 1
NET POSITION TREND:
– Strength Index Score (3 Year Range Pct):64.033.161.7
– Strength Index Reading (3 Year Range):BullishBearishBullish
NET POSITION MOVEMENT INDEX:
– 6-Week Change in Strength Index:12.6-14.22.6


COTTON Futures:

COTTON Futures COT ChartThe COTTON large speculator standing this week reached a net position of -17,543 contracts in the data reported through Tuesday. This was a weekly decline of -7,467 contracts from the previous week which had a total of -10,076 net contracts.

This week’s current strength score (the trader positioning range over the past three years, measured from 0 to 100) shows the speculators are currently Bearish with a score of 27.1 percent. The commercials are Bullish with a score of 76.0 percent and the small traders (not shown in chart) are Bearish-Extreme with a score of 6.2 percent.

Price Trend-Following Model: Strong Downtrend

Our weekly trend-following model classifies the current market price position as: Strong Downtrend.

COTTON Futures StatisticsSPECULATORSCOMMERCIALSSMALL TRADERS
– Percent of Open Interest Longs:28.747.75.0
– Percent of Open Interest Shorts:36.538.96.0
– Net Position:-17,54319,738-2,195
– Gross Longs:64,575107,15711,294
– Gross Shorts:82,11887,41913,489
– Long to Short Ratio:0.8 to 11.2 to 10.8 to 1
NET POSITION TREND:
– Strength Index Score (3 Year Range Pct):27.176.06.2
– Strength Index Reading (3 Year Range):BearishBullishBearish-Extreme
NET POSITION MOVEMENT INDEX:
– 6-Week Change in Strength Index:14.9-11.2-34.9


COCOA Futures:

COCOA Futures COT ChartThe COCOA large speculator standing this week reached a net position of 20,868 contracts in the data reported through Tuesday. This was a weekly gain of 3,957 contracts from the previous week which had a total of 16,911 net contracts.

This week’s current strength score (the trader positioning range over the past three years, measured from 0 to 100) shows the speculators are currently Bearish with a score of 31.2 percent. The commercials are Bullish with a score of 66.3 percent and the small traders (not shown in chart) are Bullish-Extreme with a score of 83.6 percent.

Price Trend-Following Model: Weak Downtrend

Our weekly trend-following model classifies the current market price position as: Weak Downtrend.

COCOA Futures StatisticsSPECULATORSCOMMERCIALSSMALL TRADERS
– Percent of Open Interest Longs:31.537.012.3
– Percent of Open Interest Shorts:10.064.95.9
– Net Position:20,868-27,0226,154
– Gross Longs:30,51835,85911,897
– Gross Shorts:9,65062,8815,743
– Long to Short Ratio:3.2 to 10.6 to 12.1 to 1
NET POSITION TREND:
– Strength Index Score (3 Year Range Pct):31.266.383.6
– Strength Index Reading (3 Year Range):BearishBullishBullish-Extreme
NET POSITION MOVEMENT INDEX:
– 6-Week Change in Strength Index:2.3-5.230.7


WHEAT Futures:

WHEAT Futures COT ChartThe WHEAT large speculator standing this week reached a net position of -118,100 contracts in the data reported through Tuesday. This was a weekly lowering of -10,563 contracts from the previous week which had a total of -107,537 net contracts.

This week’s current strength score (the trader positioning range over the past three years, measured from 0 to 100) shows the speculators are currently Bearish-Extreme with a score of 0.0 percent. The commercials are Bullish-Extreme with a score of 100.0 percent and the small traders (not shown in chart) are Bullish-Extreme with a score of 87.8 percent.

Price Trend-Following Model: Strong Downtrend

Our weekly trend-following model classifies the current market price position as: Strong Downtrend.

WHEAT Futures StatisticsSPECULATORSCOMMERCIALSSMALL TRADERS
– Percent of Open Interest Longs:26.238.78.2
– Percent of Open Interest Shorts:50.715.37.0
– Net Position:-118,100112,4765,624
– Gross Longs:126,006186,21139,311
– Gross Shorts:244,10673,73533,687
– Long to Short Ratio:0.5 to 12.5 to 11.2 to 1
NET POSITION TREND:
– Strength Index Score (3 Year Range Pct):0.0100.087.8
– Strength Index Reading (3 Year Range):Bearish-ExtremeBullish-ExtremeBullish-Extreme
NET POSITION MOVEMENT INDEX:
– 6-Week Change in Strength Index:-10.612.3-8.6


Article By InvestMacroReceive our weekly COT Newsletter

*COT Report: The COT data, released weekly to the public each Friday, is updated through the most recent Tuesday (data is 3 days old) and shows a quick view of how large speculators or non-commercials (for-profit traders) were positioned in the futures markets.

The CFTC categorizes trader positions according to commercial hedgers (traders who use futures contracts for hedging as part of the business), non-commercials (large traders who speculate to realize trading profits) and nonreportable traders (usually small traders/speculators) as well as their open interest (contracts open in the market at time of reporting). See CFTC criteria here.

COT Stock Market Charts: Weekly Speculator Bets led by MSCI EAFE-Mini

By InvestMacro

Speculators OI Stocks COT Chart

Here are the latest charts and statistics for the Commitment of Traders (COT) data published by the Commodities Futures Trading Commission (CFTC).

The latest COT data is updated through Tuesday May 13th and shows a quick view of how large traders (for-profit speculators and commercial entities) were positioned in the futures markets.

Weekly Speculator Changes led by MSCI EAFE-Mini

Speculators Nets Stocks COT Chart

The COT stock markets speculator bets were overall lower this week as three out of the seven stock markets we cover had higher positioning while the other four markets had lower speculator contracts.

Leading the gains for the stock markets was the MSCI EAFE-Mini (7,301 contracts) with the Nikkei 225 (2,025 contracts) and the DowJones-Mini (1,319 contracts) also showing positive weeks.

The markets with the declines in speculator bets this week were the S&P500-Mini (-45,789 contracts), the Nasdaq-Mini (-13,300 contracts), the Russell-Mini (-13,528 contracts) and with the VIX (-4,844 contracts) also registering lower bets on the week.


Stock Market Data:

Speculators Table Stocks COT Chart

Legend: Weekly Speculators Change | Speculators Current Net Position | Speculators Strength Score compared to last 3-Years (0-100 range)


Strength Scores led by Nikkei 225 & VIX

Speculators Strength Stocks COT Chart

COT Strength Scores (a normalized measure of Speculator positions over a 3-Year range, from 0 to 100 where above 80 is Extreme-Bullish and below 20 is Extreme-Bearish) showed that the Nikkei 225 (96 percent) and the VIX (96 percent) lead the stock markets this week. The MSCI EAFE-Mini (93 percent) and DowJones-Mini (72 percent) come in as the next highest in the weekly strength scores.

On the downside, the S&P500-Mini (57 percent) comes in at the lowest strength level currently but is still above the 50 percent midpoint for the past 3-years.

Strength Statistics:
VIX (95.9 percent) vs VIX previous week (100.0 percent)
S&P500-Mini (57.0 percent) vs S&P500-Mini previous week (65.3 percent)
DowJones-Mini (71.9 percent) vs DowJones-Mini previous week (69.7 percent)
Nasdaq-Mini (69.5 percent) vs Nasdaq-Mini previous week (90.1 percent)
Russell2000-Mini (62.6 percent) vs Russell2000-Mini previous week (71.9 percent)
Nikkei USD (96.4 percent) vs Nikkei USD previous week (79.1 percent)
EAFE-Mini (93.1 percent) vs EAFE-Mini previous week (83.0 percent)


Nikkei 225 & MSCI EAFE-Mini top the 6-Week Strength Trends

Speculators Trend Stocks COT Chart

COT Strength Score Trends (or move index, calculates the 6-week changes in strength scores) showed that the Nikkei 225 (35 percent) leads the past six weeks trends for the stock markets. The MSCI EAFE-Mini (17 percent), the DowJones-Mini (16 percent) and the VIX (14 percent) are the next highest positive movers in the latest trends data.

The S&P500-Mini (-19 percent) leads the downside trend scores currently with the Russell-Mini (-8 percent) coming in as the next market with lower trend scores.

Strength Trend Statistics:
VIX (14.0 percent) vs VIX previous week (17.0 percent)
S&P500-Mini (-18.8 percent) vs S&P500-Mini previous week (-4.2 percent)
DowJones-Mini (15.8 percent) vs DowJones-Mini previous week (16.3 percent)
Nasdaq-Mini (6.8 percent) vs Nasdaq-Mini previous week (37.4 percent)
Russell2000-Mini (-7.6 percent) vs Russell2000-Mini previous week (0.4 percent)
Nikkei USD (35.0 percent) vs Nikkei USD previous week (25.1 percent)
EAFE-Mini (17.2 percent) vs EAFE-Mini previous week (10.3 percent)


Individual Stock Market Charts:

VIX Volatility Futures:

VIX Volatility Futures COT ChartThe VIX Volatility large speculator standing this week totaled a net position of 6,099 contracts in the data reported through Tuesday. This was a weekly fall of -4,844 contracts from the previous week which had a total of 10,943 net contracts.

This week’s current strength score (the trader positioning range over the past three years, measured from 0 to 100) shows the speculators are currently Bullish-Extreme with a score of 95.9 percent. The commercials are Bearish-Extreme with a score of 2.8 percent and the small traders (not shown in chart) are Bullish-Extreme with a score of 88.7 percent.

Price Trend-Following Model: Weak Uptrend

Our weekly trend-following model classifies the current market price position as: Weak Uptrend.

VIX Volatility Futures StatisticsSPECULATORSCOMMERCIALSSMALL TRADERS
– Percent of Open Interest Longs:23.641.313.9
– Percent of Open Interest Shorts:21.444.912.4
– Net Position:6,099-10,1644,065
– Gross Longs:65,347114,11438,350
– Gross Shorts:59,248124,27834,285
– Long to Short Ratio:1.1 to 10.9 to 11.1 to 1
NET POSITION TREND:
– Strength Index Score (3 Year Range Pct):95.92.888.7
– Strength Index Reading (3 Year Range):Bullish-ExtremeBearish-ExtremeBullish-Extreme
NET POSITION MOVEMENT INDEX:
– 6-Week Change in Strength Index:14.0-15.09.5


S&P500 Mini Futures:

SP500 Mini Futures COT ChartThe S&P500 Mini large speculator standing this week totaled a net position of -122,194 contracts in the data reported through Tuesday. This was a weekly lowering of -45,789 contracts from the previous week which had a total of -76,405 net contracts.

This week’s current strength score (the trader positioning range over the past three years, measured from 0 to 100) shows the speculators are currently Bullish with a score of 57.0 percent. The commercials are Bearish with a score of 44.1 percent and the small traders (not shown in chart) are Bullish with a score of 61.3 percent.

Price Trend-Following Model: Weak Downtrend

Our weekly trend-following model classifies the current market price position as: Weak Downtrend.

S&P500 Mini Futures StatisticsSPECULATORSCOMMERCIALSSMALL TRADERS
– Percent of Open Interest Longs:11.474.011.8
– Percent of Open Interest Shorts:17.271.18.9
– Net Position:-122,19461,66960,525
– Gross Longs:243,2911,572,344250,278
– Gross Shorts:365,4851,510,675189,753
– Long to Short Ratio:0.7 to 11.0 to 11.3 to 1
NET POSITION TREND:
– Strength Index Score (3 Year Range Pct):57.044.161.3
– Strength Index Reading (3 Year Range):BullishBearishBullish
NET POSITION MOVEMENT INDEX:
– 6-Week Change in Strength Index:-18.817.6-5.8


Dow Jones Mini Futures:

Dow Jones Mini Futures COT ChartThe Dow Jones Mini large speculator standing this week totaled a net position of 7,114 contracts in the data reported through Tuesday. This was a weekly advance of 1,319 contracts from the previous week which had a total of 5,795 net contracts.

This week’s current strength score (the trader positioning range over the past three years, measured from 0 to 100) shows the speculators are currently Bullish with a score of 71.9 percent. The commercials are Bearish with a score of 32.0 percent and the small traders (not shown in chart) are Bearish with a score of 37.0 percent.

Price Trend-Following Model: Weak Downtrend

Our weekly trend-following model classifies the current market price position as: Weak Downtrend.

Dow Jones Mini Futures StatisticsSPECULATORSCOMMERCIALSSMALL TRADERS
– Percent of Open Interest Longs:17.161.912.4
– Percent of Open Interest Shorts:7.967.516.0
– Net Position:7,114-4,300-2,814
– Gross Longs:13,25947,9879,602
– Gross Shorts:6,14552,28712,416
– Long to Short Ratio:2.2 to 10.9 to 10.8 to 1
NET POSITION TREND:
– Strength Index Score (3 Year Range Pct):71.932.037.0
– Strength Index Reading (3 Year Range):BullishBearishBearish
NET POSITION MOVEMENT INDEX:
– 6-Week Change in Strength Index:15.8-11.5-10.7


Nasdaq Mini Futures:

Nasdaq Mini Futures COT ChartThe Nasdaq Mini large speculator standing this week totaled a net position of 19,547 contracts in the data reported through Tuesday. This was a weekly decline of -13,300 contracts from the previous week which had a total of 32,847 net contracts.

This week’s current strength score (the trader positioning range over the past three years, measured from 0 to 100) shows the speculators are currently Bullish with a score of 69.5 percent. The commercials are Bearish with a score of 42.6 percent and the small traders (not shown in chart) are Bearish with a score of 36.5 percent.

Price Trend-Following Model: Weak Downtrend

Our weekly trend-following model classifies the current market price position as: Weak Downtrend.

Nasdaq Mini Futures StatisticsSPECULATORSCOMMERCIALSSMALL TRADERS
– Percent of Open Interest Longs:30.255.412.1
– Percent of Open Interest Shorts:23.359.015.4
– Net Position:19,547-10,153-9,394
– Gross Longs:85,720157,12534,258
– Gross Shorts:66,173167,27843,652
– Long to Short Ratio:1.3 to 10.9 to 10.8 to 1
NET POSITION TREND:
– Strength Index Score (3 Year Range Pct):69.542.636.5
– Strength Index Reading (3 Year Range):BullishBearishBearish
NET POSITION MOVEMENT INDEX:
– 6-Week Change in Strength Index:6.819.7-43.2


Russell 2000 Mini Futures:

Russell 2000 Mini Futures COT ChartThe Russell 2000 Mini large speculator standing this week totaled a net position of -28,356 contracts in the data reported through Tuesday. This was a weekly fall of -13,528 contracts from the previous week which had a total of -14,828 net contracts.

This week’s current strength score (the trader positioning range over the past three years, measured from 0 to 100) shows the speculators are currently Bullish with a score of 62.6 percent. The commercials are Bearish with a score of 42.9 percent and the small traders (not shown in chart) are Bearish-Extreme with a score of 17.2 percent.

Price Trend-Following Model: Weak Downtrend

Our weekly trend-following model classifies the current market price position as: Weak Downtrend.

Russell 2000 Mini Futures StatisticsSPECULATORSCOMMERCIALSSMALL TRADERS
– Percent of Open Interest Longs:14.075.65.2
– Percent of Open Interest Shorts:20.468.65.8
– Net Position:-28,35630,861-2,505
– Gross Longs:62,021335,02223,084
– Gross Shorts:90,377304,16125,589
– Long to Short Ratio:0.7 to 11.1 to 10.9 to 1
NET POSITION TREND:
– Strength Index Score (3 Year Range Pct):62.642.917.2
– Strength Index Reading (3 Year Range):BullishBearishBearish-Extreme
NET POSITION MOVEMENT INDEX:
– 6-Week Change in Strength Index:-7.613.5-30.6


Nikkei Stock Average (USD) Futures:

Nikkei Stock Average (USD) Futures COT ChartThe Nikkei Stock Average (USD) large speculator standing this week totaled a net position of 1,904 contracts in the data reported through Tuesday. This was a weekly lift of 2,025 contracts from the previous week which had a total of -121 net contracts.

This week’s current strength score (the trader positioning range over the past three years, measured from 0 to 100) shows the speculators are currently Bullish-Extreme with a score of 96.4 percent. The commercials are Bearish-Extreme with a score of 15.4 percent and the small traders (not shown in chart) are Bearish with a score of 37.1 percent.

Price Trend-Following Model: Weak Uptrend

Our weekly trend-following model classifies the current market price position as: Weak Uptrend.

Nikkei Stock Average Futures StatisticsSPECULATORSCOMMERCIALSSMALL TRADERS
– Percent of Open Interest Longs:20.360.519.2
– Percent of Open Interest Shorts:2.575.422.1
– Net Position:1,904-1,590-314
– Gross Longs:2,1696,4802,056
– Gross Shorts:2658,0702,370
– Long to Short Ratio:8.2 to 10.8 to 10.9 to 1
NET POSITION TREND:
– Strength Index Score (3 Year Range Pct):96.415.437.1
– Strength Index Reading (3 Year Range):Bullish-ExtremeBearish-ExtremeBearish
NET POSITION MOVEMENT INDEX:
– 6-Week Change in Strength Index:35.0-26.7-5.5


MSCI EAFE Mini Futures:

MSCI EAFE Mini Futures COT ChartThe MSCI EAFE Mini large speculator standing this week totaled a net position of 2,709 contracts in the data reported through Tuesday. This was a weekly advance of 7,301 contracts from the previous week which had a total of -4,592 net contracts.

This week’s current strength score (the trader positioning range over the past three years, measured from 0 to 100) shows the speculators are currently Bullish-Extreme with a score of 93.1 percent. The commercials are Bearish-Extreme with a score of 15.9 percent and the small traders (not shown in chart) are Bearish with a score of 46.2 percent.

Price Trend-Following Model: Strong Uptrend

Our weekly trend-following model classifies the current market price position as: Strong Uptrend.

MSCI EAFE Mini Futures StatisticsSPECULATORSCOMMERCIALSSMALL TRADERS
– Percent of Open Interest Longs:9.088.42.4
– Percent of Open Interest Shorts:8.490.31.1
– Net Position:2,709-8,5685,859
– Gross Longs:41,277406,70710,913
– Gross Shorts:38,568415,2755,054
– Long to Short Ratio:1.1 to 11.0 to 12.2 to 1
NET POSITION TREND:
– Strength Index Score (3 Year Range Pct):93.115.946.2
– Strength Index Reading (3 Year Range):Bullish-ExtremeBearish-ExtremeBearish
NET POSITION MOVEMENT INDEX:
– 6-Week Change in Strength Index:17.2-11.2-15.1


Article By InvestMacroReceive our weekly COT Newsletter

*COT Report: The COT data, released weekly to the public each Friday, is updated through the most recent Tuesday (data is 3 days old) and shows a quick view of how large speculators or non-commercials (for-profit traders) were positioned in the futures markets.

The CFTC categorizes trader positions according to commercial hedgers (traders who use futures contracts for hedging as part of the business), non-commercials (large traders who speculate to realize trading profits) and nonreportable traders (usually small traders/speculators) as well as their open interest (contracts open in the market at time of reporting). See CFTC criteria here.

Banxico cut the rate by 0.50%. Natural gas prices fell to a 2-week low

By JustMarkets

The Dow Jones Index (US30) gained 0.21% on Thursday. The S&P 500 Index (US500) added 0.41%. The Nasdaq Technology Index (US100) closed lower by 0.18%. The GE stocks rose by 2.8% as Qatar placed Boeing’s most significant order for wide-body airplanes powered only by GE engines. Economic data showed retail sales slowed in April, and wholesale inflation unexpectedly fell, easing price concerns and lowering Treasury yields. Fed Chairman Powell warned of lingering economic uncertainty and potential supply-side shocks, keeping markets cautious despite recent optimism on US-China trade.

The Mexican peso slipped to 19.50 per US dollar from a seven-month peak of 19.38 as markets perceived a 50 bps cut in Banxico’s interest rate to 8.50% on May 15. With core and core inflation still at 3.9% and first-quarter GDP growth at just 0.2% after contraction, the Board decided that a modest rate cut would support the fragile economic recovery, keeping disinflation on track to meet the 3% target.

Equity markets in Europe were mostly down yesterday. Germany’s DAX (DE40) rose by 0.72%, France’s CAC 40 (FR40) closed higher by 0.21%, Spain’s IBEX35 (ES35) added 0.65%, and the UK’s FTSE 100 (UK100) closed 0.57%. Defense stocks rose amid fading prospects for peace talks to end Russia’s war in Ukraine. Shares of Hensoldt, Rheinmetall and Renk rose by 4-8%. Merck shares fell nearly 6% after the company cut its full-year forecast. Meanwhile, Siemens fell by 1.3% after disappointing second-quarter profit despite reiterating a positive outlook for fiscal 2025.

European Union officials said the bloc is pushing for a more comprehensive deal on tariff cuts with the US than those currently being negotiated with Britain and China. EU negotiators expressed confidence in the bloc’s economic clout and said they would not be pressured to reach unfavorable terms.

The US natural gas (XNG/USD) prices fell below $3.5/MMBtu, their lowest in two weeks, mainly due to weaker near-term demand expectations and lower LNG exports. Forecasts of warmer-than-normal weather through the end of May are expected to limit heating demand, while moderate temperatures are also expected to reduce cooling needs, reducing overall consumption.

Asian markets were mostly down yesterday. Japan’s Nikkei 225 (JP225) was down 0.98%, China’s FTSE China A50 (CHA50) lost 0.41%, Hong Kong’s Hang Seng (HK50) decreased by 0.79% and Australia’s ASX 200 (AU200) was positive 0.22% for yesterday.

The Reserve Bank of New Zealand’s (RBNZ) quarterly expectations survey showed that business executives now see inflation at 2.29% over the next two years as of Q2 2025, up from 2.06% in the previous quarter, the highest over a year. One-year inflation expectations also rose to 2.41% from 2.15%, the highest in the past four quarters.

S&P 500 (US500) 5,916.93 +24.35 (+0.41%)

Dow Jones (US30) 42,322.75 +271.69 (+0.65%)

DAX (DE40) 23,695.59 +168.58 (+0.72%)

FTSE 100 (UK100) 8,633.75 +48.74 (+0.57%)

USD index 100.81 -0.23 (-0.23%)

News feed for: 2025.05.16

  • Japan GDP (q/q) at 02:50 (GMT+3);
  • Japan Industrial Production (m/m) at 07:00 (GMT+3);
  • Switzerland Industrial Production (m/m) at 09:30 (GMT+3);
  • Eurozone Trade Balance (m/m) at 12:00 (GMT+3);
  • Switzerland SNB Chairman Schlegel Speaks at 14:00 (GMT+3);
  • US Building Permits (m/m) at 15:30 (GMT+3);
  • US Housing Starts (m/m) at 15:30 (GMT+3);
  • US Michigan Inflation Expectations (m/m) at 17:00 (GMT+3).

By JustMarkets


This article reflects a personal opinion and should not be interpreted as an investment advice, and/or offer, and/or a persistent request for carrying out financial transactions, and/or a guarantee, and/or a forecast of future events.

EUR/USD Unchanged Amid Mixed News and Lingering Risks

By RoboForex Analytical Department 

The EUR/USD pair remained steady near 1.1196 on Friday, closing the week with little movement.

Key drivers influencing EUR/USD

Earlier in the week, the US dollar strengthened as the US-China trade dispute showed signs of easing. However, this optimism was short-lived due to disappointing economic data.

The greenback initially rose by around 1% after Washington and Beijing agreed to reduce tariffs temporarily for 90 days, fuelling hopes of progress toward a broader trade deal. Yet, weak US economic indicators soon dampened sentiment:

  • The April producer price index (PPI) fell to 2.4% year-on-year, down from 3.4% and below the forecast of 2.5%
  • Month-on-month PPI dropped 0.5%, against expectations of no change
  • US retail sales growth slowed sharply to 0.1% in March, following February’s 1.7% surge
  • Industrial production stagnated in March after a 0.3% decline in February

These concerning figures have led traders to price in additional Fed rate cuts for 2025.

Technical analysis: EUR/USD

H4 Chart:

The EUR/USD continues to consolidate around 1.1173. A temporary rise to 1.1276 (testing resistance from below) remains possible, but this uptick is considered a corrective phase within the broader downtrend. Once complete, the pair may resume its decline toward 1.0950, this being the first key support level. The MACD indicator confirms this outlook, with its signal line below zero and pointing downward.

H1 Chart:

The pair has already met a local bullish target at 1.12653, followed by a pullback to 1.1170. Today, another test of 1.1276 is plausible, but the broader expectation remains bearish, with a potential drop towards 1.1100. This scenario is reinforced by the Stochastic oscillator, whose signal line is above 80, suggesting an imminent downward reversal towards 20.

Conclusion

The EUR/USD remains range-bound amid mixed fundamentals and technical signals. While a short-term rebound is possible, the dominant downtrend is expected to prevail, with key support levels at 1.0950 (H4) and 1.1100 (H1). Traders should monitor Fed policy expectations and upcoming economic data for further direction.


Disclaimer

Any forecasts contained herein are based on the author’s particular opinion. This analysis may not be treated as trading advice. RoboForex bears no responsibility for trading results based on trading recommendations and reviews contained herein.

Piper Sandler leads latest Small-Cap Stock System Scores

By InvestMacro Research | Stock Market Ideas

The second quarter of 2025 is underway and we wanted to highlight three of the top small-cap companies that have been just recently added to our Cosmic Rays Watchlist. Today’s group includes a financial services company, an industrial company and a communications provider.

The Cosmic Rays Watchlist is the output from our proprietary fundamental analysis algorithm. The algo examines company fundamental metrics, earnings trends and overall sector strength trends. The aim is identify quality dividend-paying companies on the NYSE and Nasdaq stock exchanges. If a company scores over 50, it gets added to our Watchlist for further analysis.

We use this system as a stock market ideas generator and to update our Watchlist every quarter. However, be aware the fundamental system does not take the stock price as a direct element in our rating so one must compare each idea with their current stock prices (this is not a timing tool).

Currently, the total number of stocks in our model is 1,291. We have scored 12,949 quarterly earnings reports so far and overall, only 7.74% of company earnings reports have come in with a 50 or above score.

Many studies are consistently showing overvalued markets and that has to be taken into consideration with any stock market idea. As with all investment ideas, past performance does not guarantee future results. A stock added to our list is not a recommendation to buy or sell the security.

Here we go with 3 of our Top Small-Cap Stocks scored in Q1 2025:


Piper Sandler Companies (PIPR):

Piper Sandler Companies (Symbol: PIPR) was recently added to our Cosmic Rays WatchList. PIPR scored a 81 in our fundamental rating system on May 5th, 2025.

At time of writing, only 0.66% of stocks have scored a 80 or better out of a total of 12,949 scores in our earnings database. This stock has made our Watchlist a total of 2 times.

PIPR is a Small-Cap stock and part of the Financial Services sector. The industry focus for PIPR is the Capital Markets.

Piper Sandler

– P.E. ratio: 23.38
– Dividend: approximately 1.00%
– Dividend payout ratio: approximately 25%
– Earnings: Earnings PerShare (EPS) has risen 3 out of the last 4 quarters, beating analyst expectations for the last 2 quarters in a row

Piper Sandler Price Performance:
– Trades above 0.382 fibonacci retracement level (2022 to present)
– Down 11% year to date
– Up 20% in the last month

Company Description (courtesy of SEC.gov):

Piper Sandler Companies operates as an investment bank and institutional securities firm that serves corporations, private equity groups, public entities, non-profit entities, and institutional investors in the United States and internationally. The company offers investment banking and institutional sales, trading, and research services for various equity and fixed income products. Company Website: https://www.pipersandler.com


Asset vs Sector Benchmark:*P/E Ratio (TTM)*52-Week Price Return
– Stock: Piper Sandler Companies (PIPR)23.3825.84
– Benchmark Symbol: XLF17.0121.85


* Data through May 14, 2025


Griffon Corporation (GFF):

Griffon Corporation (Symbol: GFF) was recently added to our Cosmic Rays WatchList. GFF scored a 56 in our fundamental rating system on May 9th, 2025.

At time of writing, only 7.74% of stocks have scored a 50 or better out of a total of 12,949 scores in our earnings database. This stock is on our Watchlist for the first time after rising by 10 system points from our last update.

GFF is a Small-Cap stock and part of the Industrials sector. The industry focus for GFF is Conglomerates.

Griffon Company:
– P.E. ratio: 15.45
– Dividend ratio: approximately 1%
– Payout ratio: approximately 15%
– Beaten analysts’ EPS expectations for three straight quarters
– EPS, P.E., and 5-year average P.E. below the industry average

Griffon Corporation Price Performance:
– Uptrend since 2022
– Trades above 0.236 fibonacci retracement level (2020 to present)
– Up 2.50% year to date
– Up 3.60% in the last month

Company Description (courtesy of SEC.gov):

Griffon Corporation, through its subsidiaries, provides consumer and professional, and home and building products in the United States, Europe, Canada, Australia, and internationally. Company Website: https://www.griffon.com


Asset vs Sector Benchmark:*P/E Ratio (TTM)*52-Week Price Return
– Stock: Griffon Corporation (GFF)15.453.26
– Benchmark Symbol: XLI24.5112.01


* Data through May 14, 2025


TEGNA Inc. (TGNA):

TEGNA Inc. (Symbol: TGNA) was recently added to our Cosmic Rays WatchList. TGNA scored a 61 in our fundamental rating system on May 9th, 2025.

At time of writing, only 4.43% of stocks have scored a 60 or better out of a total of 12,949 scores in our earnings database. This stock has made our Watchlist a total of 4 times and rose by 25 system points from our last update.

TGNA is a Small-Cap stock and part of the Communication Services sector. The industry focus for TGNA is Broadcasting.

Tenga:
– P.E. ratio: 6.26
– Dividend ratio: slightly under 3%
– Dividend payout ratio: around 18%
– Beaten analysts’ expectations for four quarters
– EPS, P.E., and 5-year P.E. average below the industry average

Price Performance:
– Down 4% year-to-date
– Trading off the April lows
– Up over 13% in the last month
– Trades above 0.50 fibonacci retracement level (2020 to present)

Company Description (courtesy of SEC.gov):

TEGNA Inc. operates as a media company in the United States. The company operates television stations that deliver television programming and digital content. It offers news content to consumers across various platforms, including online, mobile, and social platforms; owns and operates multicast networks under the names True Crime Network, Quest, and Twist that offer on-demand episodes of shows; and operates VAULT Studios, which provides True Crime Network and Quest. Company Website: https://www.tegna.com


Asset vs Sector Benchmark:*P/E Ratio (TTM)*52-Week Price Return
– Stock: TEGNA Inc. (TGNA)6.2616.93
– Benchmark Symbol: XLC19.0920.18


* Data through May 14, 2025


By InvestMacro – Be sure to join our stock market newsletter to get our updates and to see more top companies we add to our stock watch list.

All information, stock ideas and opinions on this website are for general informational purposes only and do not constitute investment advice. Stock scores are a data driven process through company fundamentals and are not a recommendation to buy or sell a security. Company descriptions provided by sec.gov.

Traders have lowered expectations of further easing from the RBA. Oversupply puts pressure on oil

By JustMarkets 

The US stocks ended Wednesday trading mixed as investors weighed changing trade policies and recent strength in the technology sector. The Dow Jones Index (US30) was down 0.21% at Wednesday’s close. The S&P500 Index (US500) added 0.10%. The Nasdaq Technology Index (US100) closed higher by 0.72%. Nvidia was up 3% after reports of artificial intelligence chip shipments to Saudi Arabia, while AMD jumped 4% after unveiling a $6 billion share repurchase plan. A broader rally in support of artificial intelligence contributed to a 17% rise in Super Micro Computer shares, helping to lift overall market sentiment. Meanwhile, President Trump’s visit to the Middle East led to several new business deals, including an agreement between Boeing and Qatar Airways and artificial intelligence initiatives in the Gulf.

The Canadian dollar weakened to 1.40 per dollar, retreating from a five-month high of 1.378, which reached May 6 amid dovish Bank of Canada (BoC) expectations and ongoing trade uncertainty. A marginal jobs increase of just 7,400 and a rise in the unemployment rate to 6.9% in April reinforced market bets on a possible rate cut by the Bank of Canada as early as June, weakening the loonie’s appeal.

Equity markets in Europe were mostly down yesterday. Germany’s DAX (DE40) was down 0.47%, France’s CAC 40 (FR40) closed down 0.47%, Spain’s IBEX35 (ES35) added 0.52%, and the UK’s FTSE 100 (UK100) closed down 0.21%. Meanwhile, President Trump’s visit to the Middle East led to several new business deals, including an agreement between Boeing and Qatar Airways and artificial intelligence initiatives in the Gulf. The consumer discretionary sector continued its volatile performance, recording record losses, with LVMH and Kering down 2 and 3% and L’Oreal down 3.3%. In turn, the healthcare sector continued to decline as US President Trump was expected to adopt a policy to cap drug prices, with Sanofi and Bayer losing 1% and 2%, respectively.

WTI crude oil prices fell more than 2% to $61 per barrel on Thursday, extending losses from the previous session amid renewed oversupply concerns following an unexpected increase in US crude inventories. EIA data showed a 3.454 million barrel increase in crude inventories last week after industry data reported a significant 4.3 million barrel increase. On the supply side, OPEC lowered its forecast for non-OPEC+ production growth in 2025 to 800,000 bpd from 900,000 bpd, citing softer expectations for producers such as the US.

Asian markets were predominantly up. Japan’s Nikkei 225 (JP225) was down 0.14%, China’s FTSE China A50 (CHA50) added 1.71%, Hong Kong’s Hang Seng (HK50) was up 2.30%, and Australia’s ASX 200 (AU200) was positive 0.13% for yesterday.

China lifted export restrictions on rare earth metals and military technology for 28 US companies just two days after a major agreement between the US and China to reduce tariffs temporarily. In a sign of further improvement in relations, China also announced the temporary lifting of trade and investment bans for 17 US companies, calling the latest developments a potential reset in bilateral relations.

The Australian dollar rose to $0.644 on Thursday, rebounding some of the previous session’s losses after stronger-than-expected employment data underpinned a more hawkish outlook for monetary policy. Official data showed the Australian economy added 89,000 new jobs in April, bringing total employment to a record 14.64 million, well above the forecast of 20,000. The unemployment rate remained unchanged at 4.1%, which aligns with expectations. Although the Reserve Bank of Australia (RBA) is expected to cut the money rate by 25 basis points to 3.85% at next week’s meeting, traders have lowered expectations of further easing. Markets now estimate a total rate cut to end the year at around 76 basis points, down from 100 basis points a few weeks earlier.

S&P 500 (US500) 5,892.58 +6.03 (+0.10%)

Dow Jones (US30) 42,051.06 −89.37 (−0.21%)

DAX (DE40) 23,527.01 −111.55 (−0.47%)

FTSE 100 (UK100) 8,585.01 −17.91 (−0.21%)

USD index 101.02 +0.01 (+0.01%)

News feed for: 2025.05.15

  • Australia Unemployment Rate (m/m) at 04:30 (GMT+3);
  • UK GDP (m/m) at 09:00 (GMT+3);
  • UK Industrial Production (m/m) at 09:00 (GMT+3);
  • Switzerland Producer Price Index (m/m) at 09:30 (GMT+3);
  • Eurozone GDP (q/q) at 12:00 (GMT+3);
  • Eurozone Industrial Production (m/m) at 12:00 (GMT+3);
  • US Retail Sales (m/m) at 15:30 (GMT+3);
  • US Producer Price Index (m/m) at 15:30 (GMT+3);
  • US Initial Jobless Claims (w/w) at 15:30 (GMT+3);
  • US Fed Chair Powell Speaks at 15:40 (GMT+3);
  • US Industrial Production (m/m) at 16:15 (GMT+3);
  • US Natural Gas Storage (w/w) at 17:30 (GMT+3);
  • Mexico Banxico Interest Rate Decision at 22:00 (GMT+3).

By JustMarkets


This article reflects a personal opinion and should not be interpreted as an investment advice, and/or offer, and/or a persistent request for carrying out financial transactions, and/or a guarantee, and/or a forecast of future events.

GBP/USD at a Crossroads: Momentum Needed for New Buying Opportunities

By RoboForex Analytical Department 

The GBP/USD pair has again lost direction, hovering around 1.3283 on Thursday after hitting a seven-day high mid-week.

Key drivers influencing GBP/USD movement

The US dollar weakened on Wednesday, allowing the pound to regain ground. This shift followed ongoing currency negotiations between the US and South Korea, where both parties agreed to continue discussions on exchange rate policies. The reduced demand for the greenback lent support to most major currencies, including sterling.

Domestically, the market focus shifted to the Bank of England (BoE) commentary. Deputy Governor Sarah Breeden emphasised the necessity of long-term reforms in the bond market. At the same time, Monetary Policy Committee (MPC) member Catherine Mann noted that further rate cuts would require more evident signs of easing price pressures – essentially, a sustained drop in inflation.

Meanwhile, the latest UK labour market data revealed an increase in the unemployment rate to 4.5%, the highest since 2021, accompanied by a slowdown in wage growth.

These factors have collectively reinforced expectations of further monetary policy easing by the BoE. Despite internal MPC dissent, last week’s 25bps rate cut caught markets off guard, as many expected a pause in the easing cycle.

Technical analysis: GBP/USD

H4 Chart:

The pair continues to trade within a broad consolidation range around 1.3260

The current range extends to 1.3360, with a technical pullback to 1.3260 (testing from above) now underway

A drop towards 1.3200 is anticipated. A break below this level could extend the downtrend to 1.3100, potentially stretching further to 1.3030

This bearish outlook is supported by the MACD indicator, whose signal line remains above zero but is trending sharply upward

H1 Chart:

The pair broke above 1.3260, reaching the local upside target of 1.3360

Today’s corrective decline is testing 1.3260 again

A renewed upward move towards 1.3380 is possible if support holds

The Stochastic oscillator aligns with this scenario, with its signal line above 50 and rising towards 80


Conclusion

The GBP/USD remains in a holding pattern, awaiting fresh catalysts for a decisive move. While technical indicators suggest near-term volatility, the broader trend hinges on BoE policy signals and global risk sentiment. Traders should watch for a breakout beyond 1.3360 or a drop below 1.3200 for clearer directional bias.


Disclaimer

Any forecasts contained herein are based on the author’s particular opinion. This analysis may not be treated as trading advice. RoboForex bears no responsibility for trading results based on trading recommendations and reviews contained herein.

Utilities choosing coal, solar, nuclear or other power sources have a lot to consider, beyond just cost

By Erin Baker, UMass Amherst and Paola Pimentel Furlanetto, UMass Amherst 

The Trump administration is working to lift regulations on coal-fired power plants in the hopes of making its energy less expensive. But while cost is one important aspect, utilities have a lot more to consider when they choose their power sources.

Different technologies play different roles in the power system. Some sources, like nuclear energy, are reliable but inflexible. Other sources, like oil, are flexible but expensive and polluting.

How utilities choose which power source to invest in depends in large part on two key aspects: price and reliability.

Power prices

One way to compare power sources is by their levelized cost of electricity. This shows how much it costs to produce one unit of electricity on average over the life of the generator.

The asset management firm Lazard has produced levelized cost of electricity calculations for the major U.S. electricity sources annually for years, and it has tracked a sharp decline in solar power costs in particular.

Coal is one of the more expensive technologies for utilities today, making it less competitive compared with solar, wind and natural gas, by Lazard’s calculations. Only nuclear, offshore wind and “peaker” plants, which are used only during periods of high electricity demand, are more expensive.

Land-based wind and solar power have the lowest estimated costs, far below what consumers are paying for electricity today. The National Renewable Energy Lab has found similar levelized costs for renewable energy, though its estimates for nuclear are lower than Lazard’s.

Upfront costs are also important and can make the difference for whether new power projects can be built, as the East Coast has seen lately.

Several offshore wind farms planned along the Northeast were canceled in recent years as costs rose due to inflation and supply chain problems during the pandemic. Construction costs for the two newest nuclear generators built in the U.S. also rose considerably as the projects, both in the Southeast, faced delays.

Reliability and flexibility matter

But cost is not the whole story. Utilities must balance a number of criteria when investing in power sources.

Most important is matching supply and demand at every moment of the day. Due to the technical characteristics of electricity and how it flows, if the supply of electricity is even a little bit lower than the demand, that can trigger a blackout. This means power companies and consumers need generation that can ramp down when demand is low and ramp up when demand is high.

Since wind and solar generation depend on the wind blowing and the sun shining, these sources must be combined with other types of generation or with storage, such as batteries, to ensure the power grid has exactly as much power as it needs at all times.

Nuclear and coal are predictable and run reliably, but they are inflexible – they take time to ramp up and down, and doing so is expensive. Steam turbines are simply not built for flexibility. The multiple days it took to shut down Japan’s Fukushima Daiichi Nuclear Power Plant after an earthquake and tsunami damaged its backup power sources in 2011 illustrated the challenges and safety issues related to ramping down nuclear plants.

That means coal and nuclear aren’t as helpful on those hot summer days when utilities need a quick power increase to keep air conditioners running. These peaks may only happen a few days a year, but keeping the power on is crucial for human health and the economy.

In today’s energy system, the most flexible generation sources are natural gas and hydro. They can quickly adjust to meet changing electricity demand without the safety and cost concerns of coal and nuclear. Hydro can ramp in minutes but can only be built where large dams are feasible. The most cost-effective natural gas technology can ramp up within hours.

The big picture, by power source

Over the past two decades, natural gas use has risen quickly to overtake coal as the most common fuel for generating electricity in the U.S. The boom was largely driven by the growing use of fracking technology, which allowed producers to extract gas from rock and lowered the price.

Natural gas’s low price and high flexibility make it an attractive choice. Its rise is a large part of the reason coal use has plummeted.

But natural gas has its challenges. Natural gas requires pipelines to carry it across the country, leading to disruptive construction. As Texas saw during its February 2021 blackouts, natural gas equipment can also fail in extreme cold. And like coal, natural gas is a fossil fuel that releases greenhouse gases during combustion, so it is also helping to cause climate change and contributes to air pollution that can harm human health.

Nuclear power has been gaining interest recently since it does not contribute to climate change or local air pollution. It also provides a steady baseload of power, which is useful for computing centers as their demand does not fluctuate as much as households.

Of course, nuclear has ongoing challenges around the storage of radioactive waste and security concerns, and construction of large nuclear plants takes many years.

Coal is more flexible than nuclear, but far less so than natural gas or hydropower. Most concerning, coal is extremely dirty, emitting more climate-change-causing gases, and far more air pollution than natural gas.

Solar and wind have grown rapidly in recent years due to their falling costs and environmental benefits. According to Lazard, the cost of solar combined with batteries, which would be as flexible as hydropower, is well below the cost of coal with its limited flexibility.

However, wind and solar tend to take up a lot of space, which has led to challenges in local approvals for new sites and transmission lines. In addition, the sheer number of new projects is overwhelming power system operators’ ability to evaluate them, leading to increasing wait times for new generation to come online.

What’s ahead?

Utilities have another consideration: Federal, state and local governments can also influence and sometimes limit utilities’ choices. Tariffs, for example, can increase the cost of critical components for new construction. Permitting and regulations can slow down development. Subsidies can artificially lower costs.

In our view, policies that are done right can help utilities move toward more reliable and cost-effective choices which are also cleaner. Done wrong, they can be costly to the economy and the environment.The Conversation

About the Author:

Erin Baker, Distinguished Professor of Industrial Engineering and Faculty Director of The Energy Transition Institute, UMass Amherst and Paola Pimentel Furlanetto, Ph.D. candidate in Industrial Engineering and Operations Research, UMass Amherst

This article is republished from The Conversation under a Creative Commons license. Read the original article.


Challenges to high-performance computing threaten US innovation

By Jack Dongarra, University of Tennessee 

High-performance computing, or HPC for short, might sound like something only scientists use in secret labs, but it’s actually one of the most important technologies in the world today. From predicting the weather to finding new medicines and even training artificial intelligence, high-performance computing systems help solve problems that are too hard or too big for regular computers.

This technology has helped make huge discoveries in science and engineering over the past 40 years. But now, high-performance computing is at a turning point, and the choices the government, researchers and the technology industry make today could affect the future of innovation, national security and global leadership.

High-performance computing systems are basically superpowerful computers made up of thousands or even millions of processors working together at the same time. They also use advanced memory and storage systems to move and save huge amounts of data quickly.


Oak Ridge National Laboratory’s Frontier supercomputer is one of the world’s fastest.
Oak Ridge Leadership Computing Facility, CC BY

With all this power, high-performance computing systems can run extremely detailed simulations and calculations. For example, they can simulate how a new drug interacts with the human body, or how a hurricane might move across the ocean. They’re also used in fields such as automotive design, energy production and space exploration.

Lately, high-performance computing has become even more important because of artificial intelligence. AI models, especially the ones used for things such as voice recognition and self-driving cars, require enormous amounts of computing power to train. High-performance computing systems are well suited for this job. As a result, AI and high-performance computing are now working closely together, pushing each other forward.

Lawrence Livermore National Laboratory’s supercomputer El Capitan is currently the world’s fastest.

I’m a computer scientist with a long career working in high-performance computing. I’ve observed that high-performance computing systems are under more pressure than ever, with higher demands on the systems for speed, data and energy. At the same time, I see that high-performance computing faces some serious technical problems.

Technical challenges

One big challenge for high-performance computing is the gap between how fast processors are and how well memory systems can keep up with the processors’ output. Imagine having a superfast car but being stuck in traffic – it doesn’t help to have speed if the road can’t handle it. In the same way, high-performance computing processors often have to wait around because memory systems can’t send data quickly enough. This makes the whole system less efficient.

Another problem is energy use. Today’s supercomputers use a huge amount of electricity, sometimes as much as a small town. That’s expensive and not very good for the environment. In the past, as computer parts got smaller, they also used less power. But that trend, called Dennard scaling, stopped in the mid-2000s. Now, making computers more powerful usually means they use more energy too. To fix this, researchers are looking for new ways to design both the hardware and the software of high-performance computing systems.

There’s also a problem with the kinds of chips being made. The chip industry is mainly focused on AI, which works fine with lower-precision math like 16-bit or 8-bit numbers. But many scientific applications still need 64-bit precision to be accurate. The greater the bit count, the more digits to the right of the decimal point a chip can process, hence the greater precision. If chip companies stop making the parts that scientists need, then it could become harder to do important research.

This report discusses how trends in semiconductor manufacturing and commercial priorities may diverge from the needs of the scientific computing community, and how a lack of tailored hardware could hinder progress in research.

One solution might be to build custom chips for high-performance computing, but that’s expensive and complicated. Still, researchers are exploring new designs, including chiplets – small chips that can be combined like Lego bricks – to make high-precision processors more affordable.

A global race

Globally, many countries are investing heavily in high-performance computing. Europe has the EuroHPC program, which is building supercomputers in places such as Finland and Italy. Their goal is to reduce dependence on foreign technology and take the lead in areas such as climate modeling and personalized medicine. Japan built the Fugaku supercomputer, which supports both academic research and industrial work. China has also made major advances, using homegrown technology to build some of the world’s fastest computers. All of these countries’ governments understand that high-performance computing is key to their national security, economic strength and scientific leadership.

The U.S.-China supercomputer rivalry explained.

The United States, which has been a leader in high-performance computing for decades, recently completed the Department of Energy’s Exascale Computing Project. This project created computers that can perform a billion billion operations per second. That’s an incredible achievement. But even with that success, the U.S. still doesn’t have a clear, long-term plan for what comes next. Other countries are moving quickly, and without a national strategy, the U.S. risks falling behind.

I believe that a U.S. national strategy should include funding new machines and training for people to use them. It would also include partnerships with universities, national labs and private companies. Most importantly, the plan would focus not just on hardware but also on the software and algorithms that make high-performance computing useful.

Hopeful signs

One exciting area for the future is quantum computing. This is a completely new way of doing computation based on the laws of physics at the atomic level. Quantum computers could someday solve problems that are impossible for regular computers. But they are still in the early stages and are likely to complement rather than replace traditional high-performance computing systems. That’s why it’s important to keep investing in both kinds of computing.

The good news is that some steps have already been taken. The CHIPS and Science Act, passed in 2022, provides funding to expand chip manufacturing in the U.S. It also created an office to help turn scientific research into real-world products. The task force Vision for American Science and Technology, launched on Feb. 25, 2025, and led by American Association for the Advancement of Science CEO Sudip Parikh, aims to marshal nonprofits, academia and industry to help guide the government’s decisions. Private companies are also spending billions of dollars on data centers and AI infrastructure.

All of these are positive signs, but they don’t fully solve the problem of how to support high-performance computing in the long run. In addition to short-term funding and infrastructure investments, this means:

  • Long-term federal investment in high-performance computing R&D, including advanced hardware, software and energy-efficient architectures.
  • Procurement and deployment of leadership-class computing systems at national labs and universities.
  • Workforce development, including training in parallel programming, numerical methods and AI-HPC integration.
  • Hardware road map alignment, ensuring commercial chip development remains compatible with the needs of scientific and engineering applications.
  • Sustainable funding models that prevent boom-and-bust cycles tied to one-off milestones or geopolitical urgency.
  • Public-private collaboration to bridge gaps between academic research, industry innovation and national security needs.

High-performance computing is more than just fast computers. It’s the foundation of scientific discovery, economic growth and national security. With other countries pushing forward, the U.S. is under pressure to come up with a clear, coordinated plan. That means investing in new hardware, developing smarter software, training a skilled workforce and building partnerships between government, industry and academia. If the U.S. does that, the country can make sure high-performance computing continues to power innovation for decades to come.The Conversation

About the Author:

Jack Dongarra, Emeritus Professor of Computer Science, University of Tennessee

This article is republished from The Conversation under a Creative Commons license. Read the original article.