By InvestMacro

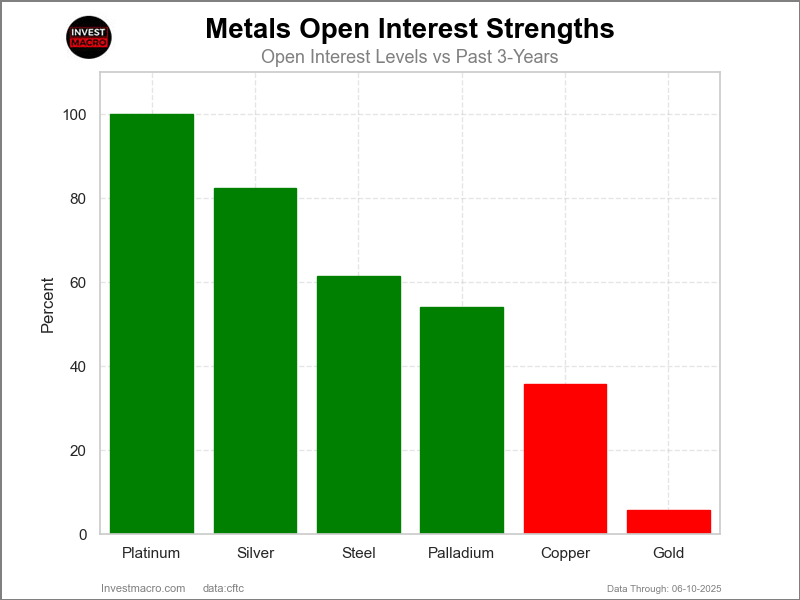
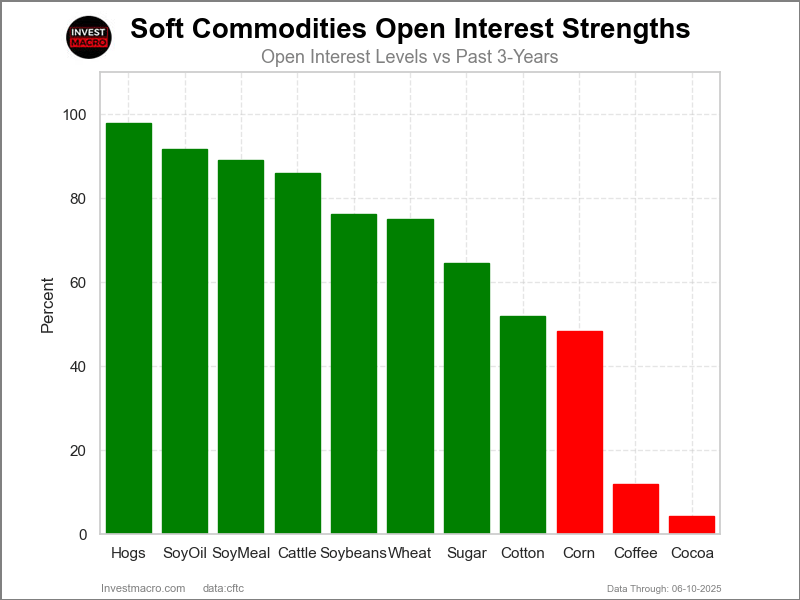
Open Interest Levels show where open contracts are in the markets.
Here are the latest charts and statistics for the Commitment of Traders (COT) data published by the Commodities Futures Trading Commission (CFTC).
The latest COT data is updated through Tuesday June 10th and shows a quick view of how large market participants (for-profit speculators and commercial traders) were positioned in the futures markets. All currency positions are in direct relation to the US dollar where, for example, a bet for the euro is a bet that the euro will rise versus the dollar while a bet against the euro will be a bet that the euro will decline versus the dollar.
Weekly Speculator Changes led by British Pound & Canadian Dollar

The COT currency market speculator bets were overall higher this week as eight out of the eleven currency markets we cover had higher positioning while the other three markets had lower speculator contracts.
Leading the gains for the currency markets was the British Pound (16,419 contracts) with the Canadian Dollar (15,303 contracts), the EuroFX (10,261 contracts), the Brazilian Real (8,508 contracts), the Swiss Franc (4,798 contracts), New Zealand Dollar (2,439 contracts), the US Dollar Index (785 contracts) and also Bitcoin (303 contracts) showing positive weeks.
The currencies seeing declines in speculator bets on the week were the Australian Dollar (-6,789 contracts), the Japanese Yen (-6,554 contracts) and the Mexican Peso (-1,723 contracts) seeing lower bets on the week.
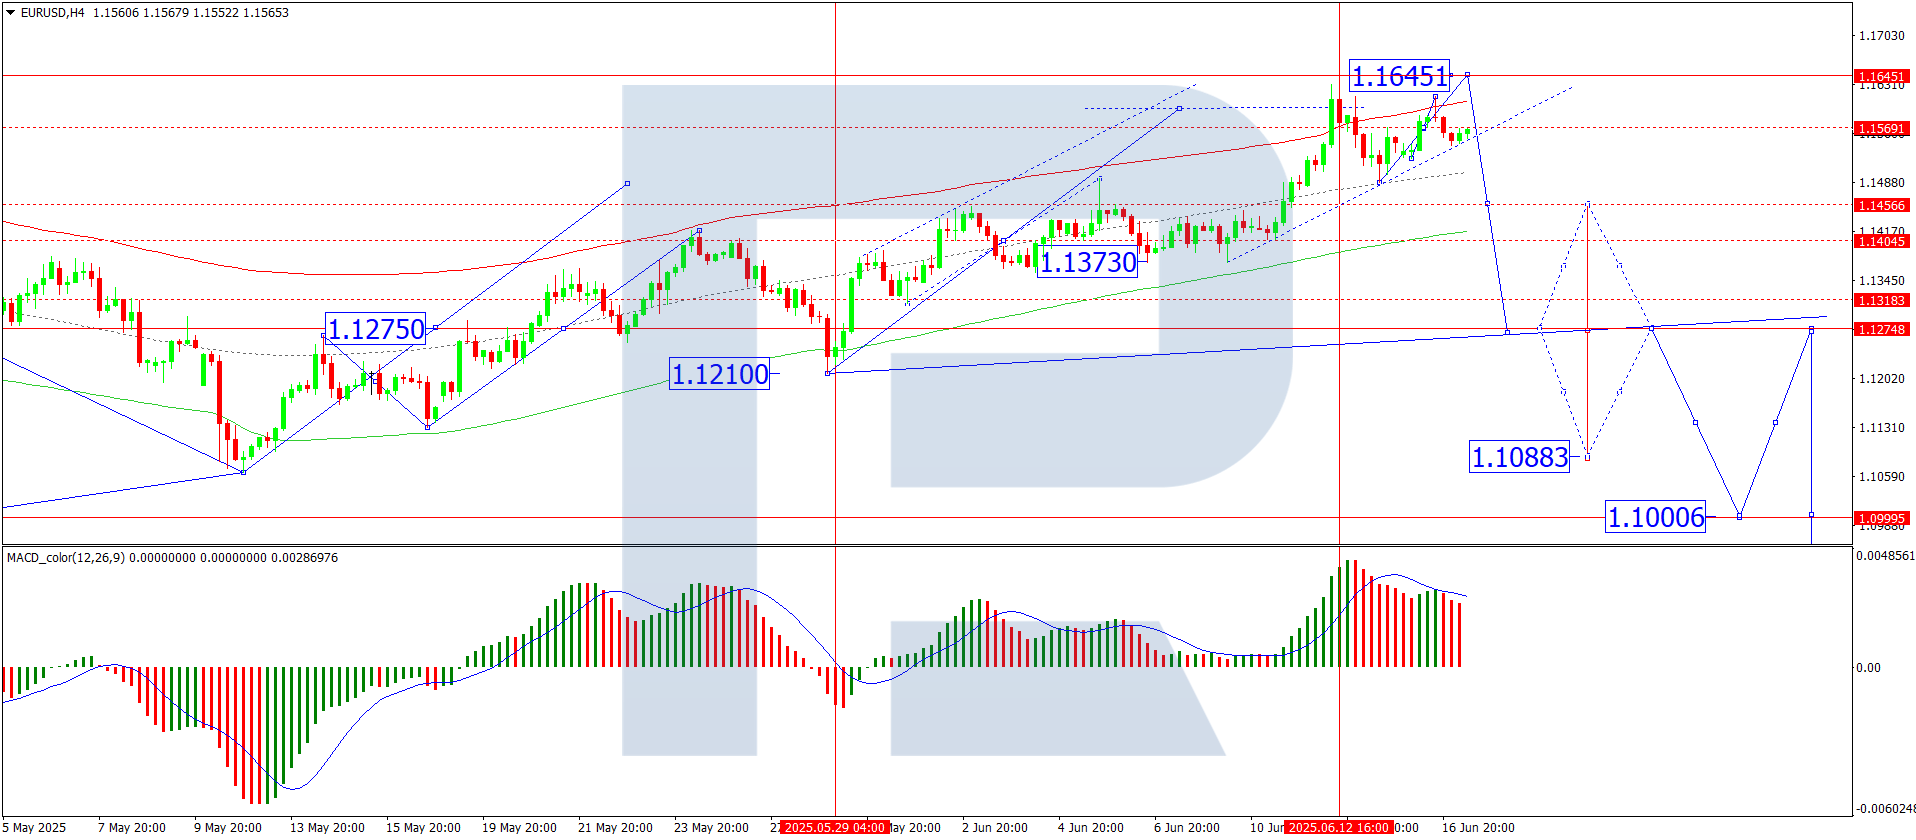
Euro Speculator Bets rise for 3rd Week to 9-Month High
Currency Data Highlights this week include the Euro and the British pound sterling seeing stronger speculator positioning that has pushed the overall net positions to multi-month highs.
Euro FX Positions rise to 40-week high
– Euro positions rose by over 10,000 contracts this week, marking the fourth increase in the last six weeks.
– Speculators’ Euro positions have risen for 13 out of the last 17 weeks, totaling a change of +157,450 contracts over that time-frame.
– The Euro positions have increased from negative contracts in mid-February to over 93,000 contracts this week, the highest level for Euro speculators since September 3, 2024, when the net position was over 100,000 contracts.
British Pound Sterling
– British Pound Sterling contracts jumped by over 16,000 positions this week.
– Speculator bets on the Pound Sterling have risen in 5 out of the last 8 weeks, totaling over +45,000 contracts in that period.
– The Pound Sterling speculator position is currently at its highest level since November with the current standing above the 50,000 contract level.
Canadian Dollar
– Canadian Dollar speculator bets increased by over 15,000 contracts this week.
– The overall standing for the Canadian Dollar, however, remains bearish at -93,140 contracts level.
Japanese Yen
– The Japanese Yen contracts fell by over 6,000 contracts this week as yen speculator bets have been cooling off.
– The Yen position has decreased for 6 consecutive weeks after reaching an all-time high in April above +179,000 contracts.
Swiss Franc
– Swiss Franc contracts rose by almost 5,000 contracts this week.
– Over the last 10 weeks, Swiss Franc positions have improved in 7 out of the last 10 weeks, reducing the overall bearish level by almost half (from approximately -42,000 to -21,000 contracts).
U.S. Dollar Index
– The U.S. Dollar index positions slightly improved this week and have now risen for five straight weeks (following declines in 8 out of previous 11 weeks)
– The current standing is currently still a small, bullish position of just +1,402 net contracts.
Market Price Changes this week:
Currency markets saw the euro and Swiss franc both rise by over 1%. The Mexican peso, Bitcoin, and the Canadian dollar each gained nearly 1%. The Brazilian real, Japanese yen, and British pound all increased by around 0.5%. The U.S. Dollar index, however, was the week’s biggest loser, dropping nearly 1%.
Currencies Data:

Legend: Open Interest | Speculators Current Net Position | Weekly Specs Change | Specs Strength Score compared to last 3-Years (0-100 range)
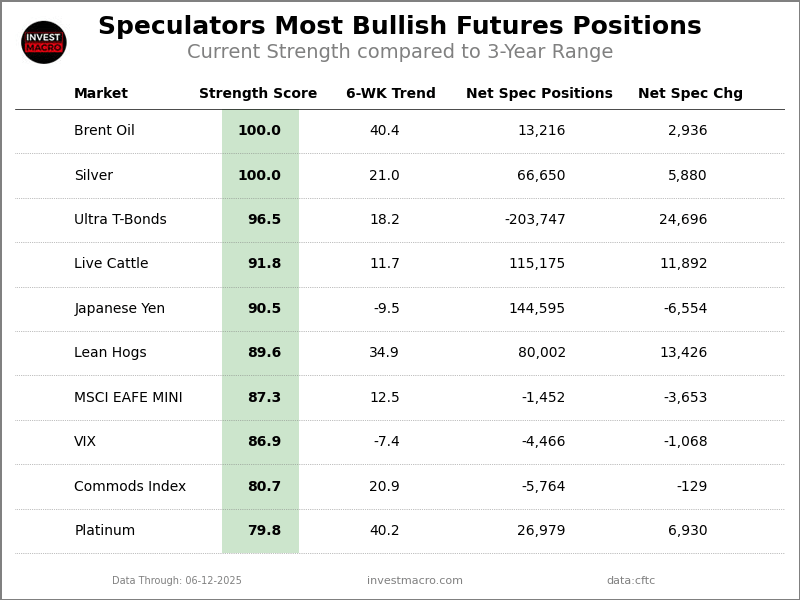
Strength Scores led by Japanese Yen & Brazilian Real

COT Strength Scores (a normalized measure of Speculator positions over a 3-Year range, from 0 to 100 where above 80 is Extreme-Bullish and below 20 is Extreme-Bearish) showed that the Japanese Yen (90 percent) and the Brazilian Real (76 percent) lead the currency markets this week. The EuroFX (64 percent), Mexican Peso (61 percent) and the Swiss Franc (58 percent) come in as the next highest in the weekly strength scores.
On the downside, Bitcoin (7 percent) and the US Dollar Index (10 percent) come in at the lowest strength levels currently and are in Extreme-Bearish territory (below 20 percent).
3-Year Strength Statistics:
US Dollar Index (9.6 percent) vs US Dollar Index previous week (8.0 percent)
EuroFX (64.2 percent) vs EuroFX previous week (60.3 percent)
British Pound Sterling (56.9 percent) vs British Pound Sterling previous week (49.1 percent)
Japanese Yen (90.5 percent) vs Japanese Yen previous week (92.3 percent)
Swiss Franc (57.8 percent) vs Swiss Franc previous week (48.1 percent)
Canadian Dollar (46.2 percent) vs Canadian Dollar previous week (39.4 percent)
Australian Dollar (26.7 percent) vs Australian Dollar previous week (31.5 percent)
New Zealand Dollar (39.9 percent) vs New Zealand Dollar previous week (37.1 percent)
Mexican Peso (60.7 percent) vs Mexican Peso previous week (61.6 percent)
Brazilian Real (76.4 percent) vs Brazilian Real previous week (69.5 percent)
Bitcoin (7.5 percent) vs Bitcoin previous week (0.9 percent)
British Pound & EuroFX top the 6-Week Strength Trends

COT Strength Score Trends (or move index, calculates the 6-week changes in strength scores) showed that the British Pound (13 percent) and the EuroFX (7 percent) lead the past six weeks trends for the currencies. The Swiss Franc (6 percent), the US Dollar Index (4 percent) and the Mexican Peso (2 percent) are the next highest positive movers in the 3-Year trends data.
The Brazilian Real (-24 percent) leads the downside trend scores currently with Bitcoin (-17 percent), the Australian Dollar (-14 percent) and the Canadian Dollar (-12 percent) following next with lower trend scores.
3-Year Strength Trends:
US Dollar Index (3.8 percent) vs US Dollar Index previous week (3.3 percent)
EuroFX (6.6 percent) vs EuroFX previous week (6.8 percent)
British Pound Sterling (13.2 percent) vs British Pound Sterling previous week (7.0 percent)
Japanese Yen (-9.5 percent) vs Japanese Yen previous week (-7.3 percent)
Swiss Franc (6.2 percent) vs Swiss Franc previous week (-1.2 percent)
Canadian Dollar (-11.6 percent) vs Canadian Dollar previous week (-18.5 percent)
Australian Dollar (-14.2 percent) vs Australian Dollar previous week (-6.1 percent)
New Zealand Dollar (0.3 percent) vs New Zealand Dollar previous week (3.7 percent)
Mexican Peso (1.6 percent) vs Mexican Peso previous week (11.9 percent)
Brazilian Real (-23.6 percent) vs Brazilian Real previous week (-15.5 percent)
Bitcoin (-17.0 percent) vs Bitcoin previous week (-32.9 percent)
Individual COT Forex Markets:
US Dollar Index Futures:
 The US Dollar Index large speculator standing this week recorded a net position of 1,402 contracts in the data reported through Tuesday. This was a weekly boost of 785 contracts from the previous week which had a total of 617 net contracts.
This week’s current strength score (the trader positioning range over the past three years, measured from 0 to 100) shows the speculators are currently Bearish-Extreme with a score of 9.6 percent. The commercials are Bullish-Extreme with a score of 93.9 percent and the small traders (not shown in chart) are Bearish-Extreme with a score of 11.8 percent.
Price Trend-Following Model: Downtrend
Our weekly trend-following model classifies the current market price position as: Downtrend.
| US DOLLAR INDEX Statistics | SPECULATORS | COMMERCIALS | SMALL TRADERS |
| – Percent of Open Interest Longs: | 55.5 | 24.0 | 7.6 |
| – Percent of Open Interest Shorts: | 51.0 | 24.1 | 12.1 |
| – Net Position: | 1,402 | -35 | -1,367 |
| – Gross Longs: | 17,027 | 7,344 | 2,345 |
| – Gross Shorts: | 15,625 | 7,379 | 3,712 |
| – Long to Short Ratio: | 1.1 to 1 | 1.0 to 1 | 0.6 to 1 |
| NET POSITION TREND: | | | |
| – Strength Index Score (3 Year Range Pct): | 9.6 | 93.9 | 11.8 |
| – Strength Index Reading (3 Year Range): | Bearish-Extreme | Bullish-Extreme | Bearish-Extreme |
| NET POSITION MOVEMENT INDEX: | | | |
| – 6-Week Change in Strength Index: | 3.8 | -3.2 | -3.6 |
Euro Currency Futures:
 The Euro Currency large speculator standing this week recorded a net position of 93,025 contracts in the data reported through Tuesday. This was a weekly boost of 10,261 contracts from the previous week which had a total of 82,764 net contracts.
This week’s current strength score (the trader positioning range over the past three years, measured from 0 to 100) shows the speculators are currently Bullish with a score of 64.2 percent. The commercials are Bearish with a score of 29.7 percent and the small traders (not shown in chart) are Bullish-Extreme with a score of 100.0 percent.
Price Trend-Following Model: Uptrend
Our weekly trend-following model classifies the current market price position as: Uptrend.
| EURO Currency Statistics | SPECULATORS | COMMERCIALS | SMALL TRADERS |
| – Percent of Open Interest Longs: | 25.8 | 55.4 | 12.6 |
| – Percent of Open Interest Shorts: | 14.3 | 74.1 | 5.5 |
| – Net Position: | 93,025 | -151,256 | 58,231 |
| – Gross Longs: | 208,754 | 449,157 | 102,489 |
| – Gross Shorts: | 115,729 | 600,413 | 44,258 |
| – Long to Short Ratio: | 1.8 to 1 | 0.7 to 1 | 2.3 to 1 |
| NET POSITION TREND: | | | |
| – Strength Index Score (3 Year Range Pct): | 64.2 | 29.7 | 100.0 |
| – Strength Index Reading (3 Year Range): | Bullish | Bearish | Bullish-Extreme |
| NET POSITION MOVEMENT INDEX: | | | |
| – 6-Week Change in Strength Index: | 6.6 | -6.7 | 5.5 |
British Pound Sterling Futures:
 The British Pound Sterling large speculator standing this week recorded a net position of 51,634 contracts in the data reported through Tuesday. This was a weekly lift of 16,419 contracts from the previous week which had a total of 35,215 net contracts.
This week’s current strength score (the trader positioning range over the past three years, measured from 0 to 100) shows the speculators are currently Bullish with a score of 56.9 percent. The commercials are Bearish with a score of 38.8 percent and the small traders (not shown in chart) are Bullish-Extreme with a score of 81.0 percent.
Price Trend-Following Model: Uptrend
Our weekly trend-following model classifies the current market price position as: Uptrend.
| BRITISH POUND Statistics | SPECULATORS | COMMERCIALS | SMALL TRADERS |
| – Percent of Open Interest Longs: | 51.9 | 28.4 | 16.9 |
| – Percent of Open Interest Shorts: | 27.8 | 56.7 | 12.7 |
| – Net Position: | 51,634 | -60,562 | 8,928 |
| – Gross Longs: | 111,076 | 60,665 | 36,199 |
| – Gross Shorts: | 59,442 | 121,227 | 27,271 |
| – Long to Short Ratio: | 1.9 to 1 | 0.5 to 1 | 1.3 to 1 |
| NET POSITION TREND: | | | |
| – Strength Index Score (3 Year Range Pct): | 56.9 | 38.8 | 81.0 |
| – Strength Index Reading (3 Year Range): | Bullish | Bearish | Bullish-Extreme |
| NET POSITION MOVEMENT INDEX: | | | |
| – 6-Week Change in Strength Index: | 13.2 | -12.8 | 6.7 |
Japanese Yen Futures:
 The Japanese Yen large speculator standing this week recorded a net position of 144,595 contracts in the data reported through Tuesday. This was a weekly lowering of -6,554 contracts from the previous week which had a total of 151,149 net contracts.
This week’s current strength score (the trader positioning range over the past three years, measured from 0 to 100) shows the speculators are currently Bullish-Extreme with a score of 90.5 percent. The commercials are Bearish-Extreme with a score of 8.3 percent and the small traders (not shown in chart) are Bullish-Extreme with a score of 100.0 percent.
Price Trend-Following Model: Uptrend
Our weekly trend-following model classifies the current market price position as: Uptrend.
| JAPANESE YEN Statistics | SPECULATORS | COMMERCIALS | SMALL TRADERS |
| – Percent of Open Interest Longs: | 47.4 | 34.0 | 13.9 |
| – Percent of Open Interest Shorts: | 10.2 | 77.6 | 7.6 |
| – Net Position: | 144,595 | -169,077 | 24,482 |
| – Gross Longs: | 184,195 | 132,044 | 54,124 |
| – Gross Shorts: | 39,600 | 301,121 | 29,642 |
| – Long to Short Ratio: | 4.7 to 1 | 0.4 to 1 | 1.8 to 1 |
| NET POSITION TREND: | | | |
| – Strength Index Score (3 Year Range Pct): | 90.5 | 8.3 | 100.0 |
| – Strength Index Reading (3 Year Range): | Bullish-Extreme | Bearish-Extreme | Bullish-Extreme |
| NET POSITION MOVEMENT INDEX: | | | |
| – 6-Week Change in Strength Index: | -9.5 | 8.3 | 4.1 |
Swiss Franc Futures:
 The Swiss Franc large speculator standing this week recorded a net position of -21,268 contracts in the data reported through Tuesday. This was a weekly rise of 4,798 contracts from the previous week which had a total of -26,066 net contracts.
This week’s current strength score (the trader positioning range over the past three years, measured from 0 to 100) shows the speculators are currently Bullish with a score of 57.8 percent. The commercials are Bearish with a score of 31.9 percent and the small traders (not shown in chart) are Bullish-Extreme with a score of 84.8 percent.
Price Trend-Following Model: Uptrend
Our weekly trend-following model classifies the current market price position as: Uptrend.
| SWISS FRANC Statistics | SPECULATORS | COMMERCIALS | SMALL TRADERS |
| – Percent of Open Interest Longs: | 10.6 | 62.5 | 19.3 |
| – Percent of Open Interest Shorts: | 35.1 | 39.7 | 17.7 |
| – Net Position: | -21,268 | 19,842 | 1,426 |
| – Gross Longs: | 9,240 | 54,331 | 16,806 |
| – Gross Shorts: | 30,508 | 34,489 | 15,380 |
| – Long to Short Ratio: | 0.3 to 1 | 1.6 to 1 | 1.1 to 1 |
| NET POSITION TREND: | | | |
| – Strength Index Score (3 Year Range Pct): | 57.8 | 31.9 | 84.8 |
| – Strength Index Reading (3 Year Range): | Bullish | Bearish | Bullish-Extreme |
| NET POSITION MOVEMENT INDEX: | | | |
| – 6-Week Change in Strength Index: | 6.2 | -8.8 | 10.1 |
Canadian Dollar Futures:
 The Canadian Dollar large speculator standing this week recorded a net position of -93,143 contracts in the data reported through Tuesday. This was a weekly advance of 15,303 contracts from the previous week which had a total of -108,446 net contracts.
This week’s current strength score (the trader positioning range over the past three years, measured from 0 to 100) shows the speculators are currently Bearish with a score of 46.2 percent. The commercials are Bullish with a score of 52.3 percent and the small traders (not shown in chart) are Bearish with a score of 49.5 percent.
Price Trend-Following Model: Strong Uptrend
Our weekly trend-following model classifies the current market price position as: Strong Uptrend.
| CANADIAN DOLLAR Statistics | SPECULATORS | COMMERCIALS | SMALL TRADERS |
| – Percent of Open Interest Longs: | 6.8 | 77.4 | 9.5 |
| – Percent of Open Interest Shorts: | 39.1 | 45.8 | 8.9 |
| – Net Position: | -93,143 | 91,207 | 1,936 |
| – Gross Longs: | 19,651 | 223,285 | 27,489 |
| – Gross Shorts: | 112,794 | 132,078 | 25,553 |
| – Long to Short Ratio: | 0.2 to 1 | 1.7 to 1 | 1.1 to 1 |
| NET POSITION TREND: | | | |
| – Strength Index Score (3 Year Range Pct): | 46.2 | 52.3 | 49.5 |
| – Strength Index Reading (3 Year Range): | Bearish | Bullish | Bearish |
| NET POSITION MOVEMENT INDEX: | | | |
| – 6-Week Change in Strength Index: | -11.6 | 6.7 | 28.8 |
Australian Dollar Futures:
 The Australian Dollar large speculator standing this week recorded a net position of -69,944 contracts in the data reported through Tuesday. This was a weekly fall of -6,789 contracts from the previous week which had a total of -63,155 net contracts.
This week’s current strength score (the trader positioning range over the past three years, measured from 0 to 100) shows the speculators are currently Bearish with a score of 26.7 percent. The commercials are Bullish with a score of 68.0 percent and the small traders (not shown in chart) are Bullish with a score of 65.4 percent.
Price Trend-Following Model: Strong Uptrend
Our weekly trend-following model classifies the current market price position as: Strong Uptrend.
| AUSTRALIAN DOLLAR Statistics | SPECULATORS | COMMERCIALS | SMALL TRADERS |
| – Percent of Open Interest Longs: | 10.7 | 68.5 | 11.9 |
| – Percent of Open Interest Shorts: | 41.9 | 40.0 | 9.2 |
| – Net Position: | -69,944 | 63,770 | 6,174 |
| – Gross Longs: | 23,997 | 153,541 | 26,785 |
| – Gross Shorts: | 93,941 | 89,771 | 20,611 |
| – Long to Short Ratio: | 0.3 to 1 | 1.7 to 1 | 1.3 to 1 |
| NET POSITION TREND: | | | |
| – Strength Index Score (3 Year Range Pct): | 26.7 | 68.0 | 65.4 |
| – Strength Index Reading (3 Year Range): | Bearish | Bullish | Bullish |
| NET POSITION MOVEMENT INDEX: | | | |
| – 6-Week Change in Strength Index: | -14.2 | 8.9 | 13.3 |
New Zealand Dollar Futures:
 The New Zealand Dollar large speculator standing this week recorded a net position of -21,235 contracts in the data reported through Tuesday. This was a weekly rise of 2,439 contracts from the previous week which had a total of -23,674 net contracts.
This week’s current strength score (the trader positioning range over the past three years, measured from 0 to 100) shows the speculators are currently Bearish with a score of 39.9 percent. The commercials are Bullish with a score of 57.5 percent and the small traders (not shown in chart) are Bullish with a score of 59.2 percent.
Price Trend-Following Model: Strong Uptrend
Our weekly trend-following model classifies the current market price position as: Strong Uptrend.
| NEW ZEALAND DOLLAR Statistics | SPECULATORS | COMMERCIALS | SMALL TRADERS |
| – Percent of Open Interest Longs: | 11.8 | 73.9 | 5.8 |
| – Percent of Open Interest Shorts: | 38.7 | 47.6 | 5.2 |
| – Net Position: | -21,235 | 20,783 | 452 |
| – Gross Longs: | 9,312 | 58,294 | 4,562 |
| – Gross Shorts: | 30,547 | 37,511 | 4,110 |
| – Long to Short Ratio: | 0.3 to 1 | 1.6 to 1 | 1.1 to 1 |
| NET POSITION TREND: | | | |
| – Strength Index Score (3 Year Range Pct): | 39.9 | 57.5 | 59.2 |
| – Strength Index Reading (3 Year Range): | Bearish | Bullish | Bullish |
| NET POSITION MOVEMENT INDEX: | | | |
| – 6-Week Change in Strength Index: | 0.3 | -0.6 | 2.9 |
Mexican Peso Futures:
 The Mexican Peso large speculator standing this week recorded a net position of 62,726 contracts in the data reported through Tuesday. This was a weekly fall of -1,723 contracts from the previous week which had a total of 64,449 net contracts.
This week’s current strength score (the trader positioning range over the past three years, measured from 0 to 100) shows the speculators are currently Bullish with a score of 60.7 percent. The commercials are Bearish with a score of 40.3 percent and the small traders (not shown in chart) are Bearish with a score of 40.4 percent.
Price Trend-Following Model: Strong Uptrend
Our weekly trend-following model classifies the current market price position as: Strong Uptrend.
| MEXICAN PESO Statistics | SPECULATORS | COMMERCIALS | SMALL TRADERS |
| – Percent of Open Interest Longs: | 54.8 | 31.8 | 3.5 |
| – Percent of Open Interest Shorts: | 20.1 | 68.3 | 1.8 |
| – Net Position: | 62,726 | -65,910 | 3,184 |
| – Gross Longs: | 99,017 | 57,439 | 6,351 |
| – Gross Shorts: | 36,291 | 123,349 | 3,167 |
| – Long to Short Ratio: | 2.7 to 1 | 0.5 to 1 | 2.0 to 1 |
| NET POSITION TREND: | | | |
| – Strength Index Score (3 Year Range Pct): | 60.7 | 40.3 | 40.4 |
| – Strength Index Reading (3 Year Range): | Bullish | Bearish | Bearish |
| NET POSITION MOVEMENT INDEX: | | | |
| – 6-Week Change in Strength Index: | 1.6 | -2.3 | 6.8 |
Brazilian Real Futures:
 The Brazilian Real large speculator standing this week recorded a net position of 39,301 contracts in the data reported through Tuesday. This was a weekly increase of 8,508 contracts from the previous week which had a total of 30,793 net contracts.
This week’s current strength score (the trader positioning range over the past three years, measured from 0 to 100) shows the speculators are currently Bullish with a score of 76.4 percent. The commercials are Bearish with a score of 22.2 percent and the small traders (not shown in chart) are Bearish with a score of 41.0 percent.
Price Trend-Following Model: Strong Uptrend
Our weekly trend-following model classifies the current market price position as: Strong Uptrend.
| BRAZIL REAL Statistics | SPECULATORS | COMMERCIALS | SMALL TRADERS |
| – Percent of Open Interest Longs: | 64.5 | 29.9 | 4.7 |
| – Percent of Open Interest Shorts: | 23.2 | 75.0 | 1.0 |
| – Net Position: | 39,301 | -42,872 | 3,571 |
| – Gross Longs: | 61,321 | 28,434 | 4,511 |
| – Gross Shorts: | 22,020 | 71,306 | 940 |
| – Long to Short Ratio: | 2.8 to 1 | 0.4 to 1 | 4.8 to 1 |
| NET POSITION TREND: | | | |
| – Strength Index Score (3 Year Range Pct): | 76.4 | 22.2 | 41.0 |
| – Strength Index Reading (3 Year Range): | Bullish | Bearish | Bearish |
| NET POSITION MOVEMENT INDEX: | | | |
| – 6-Week Change in Strength Index: | -23.6 | 22.2 | 7.5 |
Bitcoin Futures:
 The Bitcoin large speculator standing this week recorded a net position of -2,009 contracts in the data reported through Tuesday. This was a weekly gain of 303 contracts from the previous week which had a total of -2,312 net contracts.
This week’s current strength score (the trader positioning range over the past three years, measured from 0 to 100) shows the speculators are currently Bearish-Extreme with a score of 7.5 percent. The commercials are Bullish-Extreme with a score of 95.4 percent and the small traders (not shown in chart) are Bullish with a score of 51.2 percent.
Price Trend-Following Model: Strong Uptrend
Our weekly trend-following model classifies the current market price position as: Strong Uptrend.
| BITCOIN Statistics | SPECULATORS | COMMERCIALS | SMALL TRADERS |
| – Percent of Open Interest Longs: | 81.9 | 7.3 | 5.1 |
| – Percent of Open Interest Shorts: | 88.5 | 1.5 | 4.2 |
| – Net Position: | -2,009 | 1,741 | 268 |
| – Gross Longs: | 24,781 | 2,198 | 1,529 |
| – Gross Shorts: | 26,790 | 457 | 1,261 |
| – Long to Short Ratio: | 0.9 to 1 | 4.8 to 1 | 1.2 to 1 |
| NET POSITION TREND: | | | |
| – Strength Index Score (3 Year Range Pct): | 7.5 | 95.4 | 51.2 |
| – Strength Index Reading (3 Year Range): | Bearish-Extreme | Bullish-Extreme | Bullish |
| NET POSITION MOVEMENT INDEX: | | | |
| – 6-Week Change in Strength Index: | -17.0 | 18.4 | -2.5 |
Article By InvestMacro – Receive our weekly COT Newsletter
*COT Report: The COT data, released weekly to the public each Friday, is updated through the most recent Tuesday (data is 3 days old) and shows a quick view of how large speculators or non-commercials (for-profit traders) were positioned in the futures markets.
The CFTC categorizes trader positions according to commercial hedgers (traders who use futures contracts for hedging as part of the business), non-commercials (large traders who speculate to realize trading profits) and nonreportable traders (usually small traders/speculators) as well as their open interest (contracts open in the market at time of reporting). See CFTC criteria here.