
By RoboForex Analytical Department
The price of a troy ounce of gold fell to 3,273 USD on Monday, losing about 1% compared to the previous session’s level.
Key factors driving gold’s movement
The primary reason for the decline is positive signals regarding trade talks between the US and China, which have reduced the demand for safe-haven assets.
Negotiations between representatives of the two countries concluded over the weekend, and the results offer some grounds for optimism. Beijing announced plans to initiate formal talks, while Washington reported progress towards an agreement.
US Treasury Secretary Scott Bessent stated that he could provide further details at a full briefing on Monday. Today’s developments are expected to generate significant market reactions.
Free Reports:
 Get our Weekly Commitment of Traders Reports - See where the biggest traders (Hedge Funds and Commercial Hedgers) are positioned in the futures markets on a weekly basis.
 Download Our Metatrader 4 Indicators – Put Our Free MetaTrader 4 Custom Indicators on your charts when you join our Weekly Newsletter
Geopolitically, the ceasefire between India and Pakistan remained in place until Sunday, despite mutual accusations of violations shortly after its conclusion.
Earlier, additional pressure on gold came from statements made by the Federal Reserve. The regulator warned of rising inflation and risks within the labour market. At the same time, Chairman Jerome Powell ruled out the possibility of a pre-emptive rate cut in response to tariff threats.
Technical analysis: XAU/USD
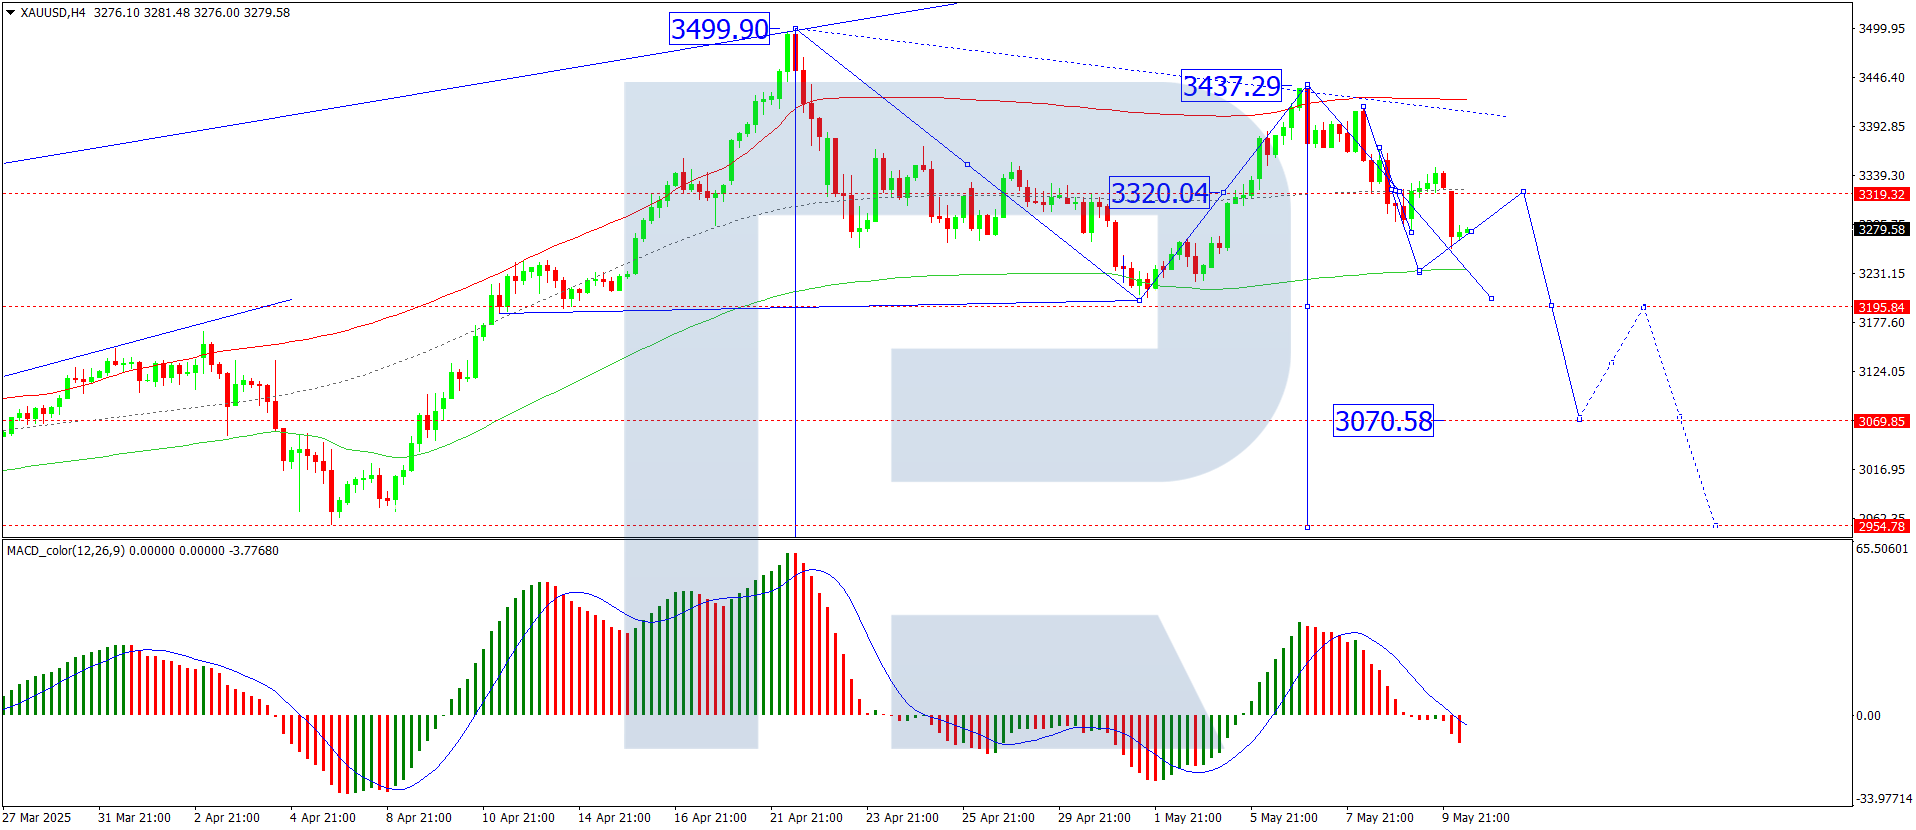
On the H4 chart, XAU/USD has formed a consolidation range around the 3,322 level. Today, we expect a possible decline to 3,195. After reaching this target, a correction to the 3,255 level is possible. Upon completing this correction, a new wave of decline to the local target of 3,070 may follow. Technically, this scenario is confirmed by the MACD indicator, as its signal line is below the zero level and is pointed decisively downwards.

On the H1 chart, XAU/USD has broken below the 3,290 level and continues to move towards 3,235. This target level will likely be reached today. A corrective move towards the 3,322 level cannot be ruled out. Subsequently, a decline to at least 3,200 is expected. Technically, this scenario is confirmed by the Stochastic oscillator; its signal line is below the 80 level and is directed steadily downwards towards the 20 level.
Conclusion
Gold remains under pressure amid improving trade sentiment and hawkish commentary from the Fed, with technical indicators pointing to further downside potential. Traders will be closely watching today’s briefing for any new market-moving details.
Disclaimer
Any forecasts contained herein are based on the author’s particular opinion. This analysis may not be treated as trading advice. RoboForex bears no responsibility for trading results based on trading recommendations and reviews contained herein.

- This week will be one of the most crowded for central‑bank meetings Jul 27, 2026
- EUR/USD Ahead of a Key Week: Holding Near Lows Jul 27, 2026
- COT Metals Charts: Weekly Speculator Changes led by Copper Jul 26, 2026
- COT Bonds Charts: Speculator Bets led by SOFR 3-Months & 5-Year Bonds Jul 26, 2026
- COT Energy Charts: Weekly Speculator Bets led by WTI Crude & Natural Gas Jul 26, 2026
- COT Soft Commodities Charts: Weekly Speculator Bets led by Corn & Soybeans Jul 26, 2026
- The US introduces new import tariffs for 60 countries. Brent crude surpasses $100 per barrel Jul 24, 2026
- USD/JPY Breaks Records: Nothing Slows the Yen’s Decline Jul 24, 2026
- Oil prices reached a 6‑week high. The AUD strengthened on the back of a strong labor‑market report Jul 23, 2026
- EUR/USD Recovers as Dollar Weakens Jul 23, 2026