COT Soft Commodities Charts: Weekly Speculator Bets led by Corn & Sugar

By InvestMacro

Speculators OI Softs
Here are the latest charts and statistics for the Commitment of Traders (COT) reports data published by the Commodities Futures Trading Commission (CFTC).

The latest COT data is updated through Tuesday July 15th and shows a quick view of how large traders (for-profit speculators and commercial entities) were positioned in the futures markets.

Weekly Speculator Changes led by Corn & Sugar

Speculators Nets Softs
The COT soft commodities markets speculator bets were overall higher this week as seven out of the eleven softs markets we cover had higher positioning while the other four markets had lower speculator contracts.

Leading the gains for the softs markets was Corn (12,305 contracts) with Sugar (8,352 contracts), Soybean Meal (5,859 contracts), Soybean Oil (4,963 contracts), Cotton (4,662 contracts), Live Cattle (3,123 contracts) and Coffee (2,212 contracts) also showing positive weeks.

The markets with the declines in speculator bets this week were Soybeans (-22,774 contracts), Lean Hogs (-8,097 contracts), Wheat (-3,681 contracts) and with Cocoa (-761 contracts) also seeing lower bets on the week.

The biggest positive mover this week was Corn, with a gain of over 12,000 contracts. Although Corn saw higher bets this week, overall the position has been in an extreme bearish level compared to the last three years. The corn price in the markets has been on the decline and has been touching the lowest levels in a year.

On the downside, Soybeans saw the biggest retreat this week, with a decrease of over 20,000 contracts. Soybean prices have also been lower over the last couple of years, and in fact, are almost 40% off the highs from 2022.


Soft Commodities Data:

Speculators Table Softs
Legend: Weekly Speculators Change | Speculators Current Net Position | Speculators Strength Score compared to last 3-Years (0-100 range)


Strength Scores led by Lean Hogs & Live Cattle

Speculators Strength Softs
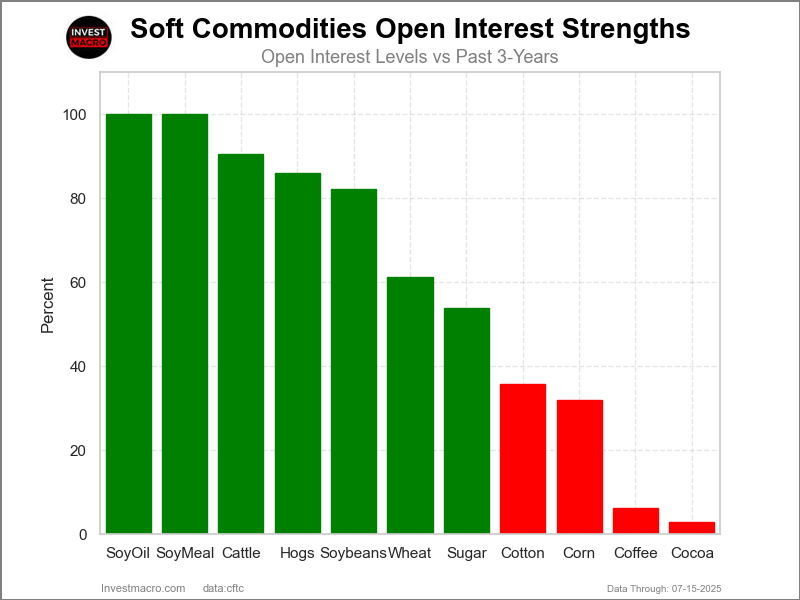
COT Strength Scores (a normalized measure of Speculator positions over a 3-Year range, from 0 to 100 where above 80 is Extreme-Bullish and below 20 is Extreme-Bearish) showed that Lean Hogs (90 percent) and Live Cattle (81 percent) lead the softs markets this week. Soybean Oil (77 percent), Coffee (56 percent) and Soybeans (54 percent) come in as the next highest in the weekly strength scores.

On the downside, Soybean Meal (3 percent), Sugar (4 percent) and Corn (19 percent) come in at the lowest strength levels currently and are in Extreme-Bearish territory (below 20 percent).

Strength Statistics:
Corn (18.6 percent) vs Corn previous week (16.9 percent)
Sugar (4.3 percent) vs Sugar previous week (1.9 percent)
Coffee (56.0 percent) vs Coffee previous week (53.9 percent)
Soybeans (54.4 percent) vs Soybeans previous week (60.3 percent)
Soybean Oil (77.3 percent) vs Soybean Oil previous week (74.5 percent)
Soybean Meal (2.7 percent) vs Soybean Meal previous week (0.5 percent)
Live Cattle (81.0 percent) vs Live Cattle previous week (77.9 percent)
Lean Hogs (89.8 percent) vs Lean Hogs previous week (95.9 percent)
Cotton (22.5 percent) vs Cotton previous week (19.7 percent)
Cocoa (22.0 percent) vs Cocoa previous week (22.8 percent)
Wheat (42.5 percent) vs Wheat previous week (45.5 percent)


Wheat & Soybean Oil top the 6-Week Strength Trends

Speculators Trend Softs
COT Strength Score Trends (or move index, calculates the 6-week changes in strength scores) showed that Wheat (26 percent) and Soybean Oil (12 percent) lead the past six weeks trends for soft commodities. Lean Hogs (12 percent) and Cotton (4 percent) are the next highest positive movers in the latest trends data.

Sugar (-14 percent) leads the downside trend scores currently with Soybeans (-11 percent), Soybean Meal (-10 percent) and Cocoa (-8 percent) following next with lower trend scores.

Strength Trend Statistics:
Corn (-6.6 percent) vs Corn previous week (-16.5 percent)
Sugar (-13.9 percent) vs Sugar previous week (-23.1 percent)
Coffee (-3.8 percent) vs Coffee previous week (-11.2 percent)
Soybeans (-11.4 percent) vs Soybeans previous week (-8.8 percent)
Soybean Oil (12.3 percent) vs Soybean Oil previous week (-1.1 percent)
Soybean Meal (-9.6 percent) vs Soybean Meal previous week (-13.8 percent)
Live Cattle (1.2 percent) vs Live Cattle previous week (0.7 percent)
Lean Hogs (12.3 percent) vs Lean Hogs previous week (24.3 percent)
Cotton (4.4 percent) vs Cotton previous week (-0.2 percent)
Cocoa (-7.8 percent) vs Cocoa previous week (-8.7 percent)
Wheat (25.5 percent) vs Wheat previous week (29.8 percent)


Individual Soft Commodities Markets:

CORN Futures:

CORN Futures COT ChartThe CORN large speculator standing this week recorded a net position of -129,457 contracts in the data reported through Tuesday. This was a weekly rise of 12,305 contracts from the previous week which had a total of -141,762 net contracts.

This week’s current strength score (the trader positioning range over the past three years, measured from 0 to 100) shows the speculators are currently Bearish-Extreme with a score of 18.6 percent. The commercials are Bullish-Extreme with a score of 81.0 percent and the small traders (not shown in chart) are Bullish with a score of 74.2 percent.

Price Trend-Following Model: Strong Downtrend

Our weekly trend-following model classifies the current market price position as: Strong Downtrend.

CORN Futures StatisticsSPECULATORSCOMMERCIALSSMALL TRADERS
– Percent of Open Interest Longs:20.044.29.6
– Percent of Open Interest Shorts:28.833.511.5
– Net Position:-129,457157,267-27,810
– Gross Longs:293,548649,577141,147
– Gross Shorts:423,005492,310168,957
– Long to Short Ratio:0.7 to 11.3 to 10.8 to 1
NET POSITION TREND:
– Strength Index Score (3 Year Range Pct):18.681.074.2
– Strength Index Reading (3 Year Range):Bearish-ExtremeBullish-ExtremeBullish
NET POSITION MOVEMENT INDEX:
– 6-Week Change in Strength Index:-6.68.0-4.8


SUGAR Futures:

SUGAR Futures COT ChartThe SUGAR large speculator standing this week recorded a net position of -52,099 contracts in the data reported through Tuesday. This was a weekly lift of 8,352 contracts from the previous week which had a total of -60,451 net contracts.

This week’s current strength score (the trader positioning range over the past three years, measured from 0 to 100) shows the speculators are currently Bearish-Extreme with a score of 4.3 percent. The commercials are Bullish-Extreme with a score of 97.4 percent and the small traders (not shown in chart) are Bearish-Extreme with a score of 2.4 percent.

Price Trend-Following Model: Downtrend

Our weekly trend-following model classifies the current market price position as: Downtrend.

SUGAR Futures StatisticsSPECULATORSCOMMERCIALSSMALL TRADERS
– Percent of Open Interest Longs:23.651.87.2
– Percent of Open Interest Shorts:29.644.28.7
– Net Position:-52,09965,399-13,300
– Gross Longs:204,179448,59062,405
– Gross Shorts:256,278383,19175,705
– Long to Short Ratio:0.8 to 11.2 to 10.8 to 1
NET POSITION TREND:
– Strength Index Score (3 Year Range Pct):4.397.42.4
– Strength Index Reading (3 Year Range):Bearish-ExtremeBullish-ExtremeBearish-Extreme
NET POSITION MOVEMENT INDEX:
– 6-Week Change in Strength Index:-13.913.3-8.9


COFFEE Futures:

COFFEE Futures COT ChartThe COFFEE large speculator standing this week recorded a net position of 31,133 contracts in the data reported through Tuesday. This was a weekly lift of 2,212 contracts from the previous week which had a total of 28,921 net contracts.

This week’s current strength score (the trader positioning range over the past three years, measured from 0 to 100) shows the speculators are currently Bullish with a score of 56.0 percent. The commercials are Bearish with a score of 46.4 percent and the small traders (not shown in chart) are Bearish with a score of 31.9 percent.

Price Trend-Following Model: Strong Downtrend

Our weekly trend-following model classifies the current market price position as: Strong Downtrend.

COFFEE Futures StatisticsSPECULATORSCOMMERCIALSSMALL TRADERS
– Percent of Open Interest Longs:32.541.54.6
– Percent of Open Interest Shorts:11.862.74.0
– Net Position:31,133-31,971838
– Gross Longs:48,94062,4726,921
– Gross Shorts:17,80794,4436,083
– Long to Short Ratio:2.7 to 10.7 to 11.1 to 1
NET POSITION TREND:
– Strength Index Score (3 Year Range Pct):56.046.431.9
– Strength Index Reading (3 Year Range):BullishBearishBearish
NET POSITION MOVEMENT INDEX:
– 6-Week Change in Strength Index:-3.84.9-20.5


SOYBEANS Futures:

SOYBEANS Futures COT ChartThe SOYBEANS large speculator standing this week recorded a net position of 15,294 contracts in the data reported through Tuesday. This was a weekly decrease of -22,774 contracts from the previous week which had a total of 38,068 net contracts.

This week’s current strength score (the trader positioning range over the past three years, measured from 0 to 100) shows the speculators are currently Bullish with a score of 54.4 percent. The commercials are Bearish with a score of 44.0 percent and the small traders (not shown in chart) are Bullish with a score of 72.7 percent.

Price Trend-Following Model: Uptrend

Our weekly trend-following model classifies the current market price position as: Uptrend.

SOYBEANS Futures StatisticsSPECULATORSCOMMERCIALSSMALL TRADERS
– Percent of Open Interest Longs:21.251.75.4
– Percent of Open Interest Shorts:19.551.77.1
– Net Position:15,294-82-15,212
– Gross Longs:186,780455,50747,563
– Gross Shorts:171,486455,58962,775
– Long to Short Ratio:1.1 to 11.0 to 10.8 to 1
NET POSITION TREND:
– Strength Index Score (3 Year Range Pct):54.444.072.7
– Strength Index Reading (3 Year Range):BullishBearishBullish
NET POSITION MOVEMENT INDEX:
– 6-Week Change in Strength Index:-11.412.00.9


SOYBEAN OIL Futures:

SOYBEAN OIL Futures COT ChartThe SOYBEAN OIL large speculator standing this week recorded a net position of 64,125 contracts in the data reported through Tuesday. This was a weekly lift of 4,963 contracts from the previous week which had a total of 59,162 net contracts.

This week’s current strength score (the trader positioning range over the past three years, measured from 0 to 100) shows the speculators are currently Bullish with a score of 77.3 percent. The commercials are Bearish with a score of 22.6 percent and the small traders (not shown in chart) are Bullish-Extreme with a score of 83.6 percent.

Price Trend-Following Model: Strong Uptrend

Our weekly trend-following model classifies the current market price position as: Strong Uptrend.

SOYBEAN OIL Futures StatisticsSPECULATORSCOMMERCIALSSMALL TRADERS
– Percent of Open Interest Longs:22.045.36.4
– Percent of Open Interest Shorts:11.657.74.4
– Net Position:64,125-76,48112,356
– Gross Longs:135,739279,00139,591
– Gross Shorts:71,614355,48227,235
– Long to Short Ratio:1.9 to 10.8 to 11.5 to 1
NET POSITION TREND:
– Strength Index Score (3 Year Range Pct):77.322.683.6
– Strength Index Reading (3 Year Range):BullishBearishBullish-Extreme
NET POSITION MOVEMENT INDEX:
– 6-Week Change in Strength Index:12.3-14.634.0


SOYBEAN MEAL Futures:

SOYBEAN MEAL Futures COT ChartThe SOYBEAN MEAL large speculator standing this week recorded a net position of -79,742 contracts in the data reported through Tuesday. This was a weekly advance of 5,859 contracts from the previous week which had a total of -85,601 net contracts.

This week’s current strength score (the trader positioning range over the past three years, measured from 0 to 100) shows the speculators are currently Bearish-Extreme with a score of 2.7 percent. The commercials are Bullish-Extreme with a score of 97.5 percent and the small traders (not shown in chart) are Bullish with a score of 77.8 percent.

Price Trend-Following Model: Strong Downtrend

Our weekly trend-following model classifies the current market price position as: Strong Downtrend.

SOYBEAN MEAL Futures StatisticsSPECULATORSCOMMERCIALSSMALL TRADERS
– Percent of Open Interest Longs:18.950.48.8
– Percent of Open Interest Shorts:30.742.15.3
– Net Position:-79,74255,78723,955
– Gross Longs:128,060340,58959,734
– Gross Shorts:207,802284,80235,779
– Long to Short Ratio:0.6 to 11.2 to 11.7 to 1
NET POSITION TREND:
– Strength Index Score (3 Year Range Pct):2.797.577.8
– Strength Index Reading (3 Year Range):Bearish-ExtremeBullish-ExtremeBullish
NET POSITION MOVEMENT INDEX:
– 6-Week Change in Strength Index:-9.69.8-0.6


LIVE CATTLE Futures:

LIVE CATTLE Futures COT ChartThe LIVE CATTLE large speculator standing this week recorded a net position of 104,445 contracts in the data reported through Tuesday. This was a weekly increase of 3,123 contracts from the previous week which had a total of 101,322 net contracts.

This week’s current strength score (the trader positioning range over the past three years, measured from 0 to 100) shows the speculators are currently Bullish-Extreme with a score of 81.0 percent. The commercials are Bearish with a score of 22.6 percent and the small traders (not shown in chart) are Bearish-Extreme with a score of 17.9 percent.

Price Trend-Following Model: Strong Uptrend

Our weekly trend-following model classifies the current market price position as: Strong Uptrend.

LIVE CATTLE Futures StatisticsSPECULATORSCOMMERCIALSSMALL TRADERS
– Percent of Open Interest Longs:49.328.97.7
– Percent of Open Interest Shorts:22.949.613.4
– Net Position:104,445-81,860-22,585
– Gross Longs:194,938114,27330,461
– Gross Shorts:90,493196,13353,046
– Long to Short Ratio:2.2 to 10.6 to 10.6 to 1
NET POSITION TREND:
– Strength Index Score (3 Year Range Pct):81.022.617.9
– Strength Index Reading (3 Year Range):Bullish-ExtremeBearishBearish-Extreme
NET POSITION MOVEMENT INDEX:
– 6-Week Change in Strength Index:1.21.6-8.3


LEAN HOGS Futures:

LEAN HOGS Futures COT ChartThe LEAN HOGS large speculator standing this week recorded a net position of 82,803 contracts in the data reported through Tuesday. This was a weekly decrease of -8,097 contracts from the previous week which had a total of 90,900 net contracts.

This week’s current strength score (the trader positioning range over the past three years, measured from 0 to 100) shows the speculators are currently Bullish-Extreme with a score of 89.8 percent. The commercials are Bearish-Extreme with a score of 9.9 percent and the small traders (not shown in chart) are Bearish with a score of 42.7 percent.

Price Trend-Following Model: Uptrend

Our weekly trend-following model classifies the current market price position as: Uptrend.

LEAN HOGS Futures StatisticsSPECULATORSCOMMERCIALSSMALL TRADERS
– Percent of Open Interest Longs:44.928.16.0
– Percent of Open Interest Shorts:21.350.07.6
– Net Position:82,803-77,017-5,786
– Gross Longs:157,62398,66921,044
– Gross Shorts:74,820175,68626,830
– Long to Short Ratio:2.1 to 10.6 to 10.8 to 1
NET POSITION TREND:
– Strength Index Score (3 Year Range Pct):89.89.942.7
– Strength Index Reading (3 Year Range):Bullish-ExtremeBearish-ExtremeBearish
NET POSITION MOVEMENT INDEX:
– 6-Week Change in Strength Index:12.3-11.8-9.7


COTTON Futures:

COTTON Futures COT ChartThe COTTON large speculator standing this week recorded a net position of -25,083 contracts in the data reported through Tuesday. This was a weekly lift of 4,662 contracts from the previous week which had a total of -29,745 net contracts.

This week’s current strength score (the trader positioning range over the past three years, measured from 0 to 100) shows the speculators are currently Bearish with a score of 22.5 percent. The commercials are Bullish with a score of 78.9 percent and the small traders (not shown in chart) are Bearish with a score of 24.0 percent.

Price Trend-Following Model: Weak Downtrend

Our weekly trend-following model classifies the current market price position as: Weak Downtrend.

COTTON Futures StatisticsSPECULATORSCOMMERCIALSSMALL TRADERS
– Percent of Open Interest Longs:30.247.55.0
– Percent of Open Interest Shorts:42.035.74.9
– Net Position:-25,08324,866217
– Gross Longs:63,934100,51510,668
– Gross Shorts:89,01775,64910,451
– Long to Short Ratio:0.7 to 11.3 to 11.0 to 1
NET POSITION TREND:
– Strength Index Score (3 Year Range Pct):22.578.924.0
– Strength Index Reading (3 Year Range):BearishBullishBearish
NET POSITION MOVEMENT INDEX:
– 6-Week Change in Strength Index:4.4-4.910.7


COCOA Futures:

COCOA Futures COT ChartThe COCOA large speculator standing this week recorded a net position of 11,823 contracts in the data reported through Tuesday. This was a weekly fall of -761 contracts from the previous week which had a total of 12,584 net contracts.

This week’s current strength score (the trader positioning range over the past three years, measured from 0 to 100) shows the speculators are currently Bearish with a score of 22.0 percent. The commercials are Bullish with a score of 77.6 percent and the small traders (not shown in chart) are Bullish with a score of 62.1 percent.

Price Trend-Following Model: Strong Uptrend

Our weekly trend-following model classifies the current market price position as: Strong Uptrend.

COCOA Futures StatisticsSPECULATORSCOMMERCIALSSMALL TRADERS
– Percent of Open Interest Longs:27.541.211.5
– Percent of Open Interest Shorts:15.157.97.1
– Net Position:11,823-16,0214,198
– Gross Longs:26,36039,58711,035
– Gross Shorts:14,53755,6086,837
– Long to Short Ratio:1.8 to 10.7 to 11.6 to 1
NET POSITION TREND:
– Strength Index Score (3 Year Range Pct):22.077.662.1
– Strength Index Reading (3 Year Range):BearishBullishBullish
NET POSITION MOVEMENT INDEX:
– 6-Week Change in Strength Index:-7.89.8-21.2


WHEAT Futures:

WHEAT Futures COT ChartThe WHEAT large speculator standing this week recorded a net position of -65,521 contracts in the data reported through Tuesday. This was a weekly decrease of -3,681 contracts from the previous week which had a total of -61,840 net contracts.

This week’s current strength score (the trader positioning range over the past three years, measured from 0 to 100) shows the speculators are currently Bearish with a score of 42.5 percent. The commercials are Bullish with a score of 62.6 percent and the small traders (not shown in chart) are Bearish with a score of 25.5 percent.

Price Trend-Following Model: Downtrend

Our weekly trend-following model classifies the current market price position as: Downtrend.

WHEAT Futures StatisticsSPECULATORSCOMMERCIALSSMALL TRADERS
– Percent of Open Interest Longs:28.537.57.4
– Percent of Open Interest Shorts:44.320.28.7
– Net Position:-65,52171,099-5,578
– Gross Longs:117,724154,77330,534
– Gross Shorts:183,24583,67436,112
– Long to Short Ratio:0.6 to 11.8 to 10.8 to 1
NET POSITION TREND:
– Strength Index Score (3 Year Range Pct):42.562.625.5
– Strength Index Reading (3 Year Range):BearishBullishBearish
NET POSITION MOVEMENT INDEX:
– 6-Week Change in Strength Index:25.5-22.3-38.2


Article By InvestMacroReceive our weekly COT Newsletter

*COT Report: The COT data, released weekly to the public each Friday, is updated through the most recent Tuesday (data is 3 days old) and shows a quick view of how large speculators or non-commercials (for-profit traders) were positioned in the futures markets.

The CFTC categorizes trader positions according to commercial hedgers (traders who use futures contracts for hedging as part of the business), non-commercials (large traders who speculate to realize trading profits) and nonreportable traders (usually small traders/speculators) as well as their open interest (contracts open in the market at time of reporting). See CFTC criteria here.

The US has passed a law on stablecoins. Escalating tensions in the Middle East are once again supporting oil prices

By JustMarkets 

At the end of Thursday, the Dow Jones (US30) Index rose by 0.52%. The S&P 500 (US500) Index rose by 0.54%. The Nasdaq (US100) Technology Index closed higher by 0.75%. The US stocks rose on Thursday as strong earnings and economic data helped major indices reach new record highs. The US retail sales rose by 0.6% in June, exceeding expectations and underscoring the resilience of consumer spending despite ongoing tariff issues. Initial jobless claims fell to 221,000, the lowest level in three months, bolstering confidence in the strength of the labor market. Shares of United Airlines and PepsiCo rose by 3.1% and 7.4%, respectively. TSMC shares added 3.9% on record profits, boosting chipmakers including Nvidia (+0.9%) and Marvell (+1.6%) and lifting sentiment across the chip sector ahead of Netflix’s quarterly results, due to be released after the close.

The Canadian dollar weakened to 1.37 per US dollar, its lowest level since early June. The broad-based recovery of the US dollar, driven by rising US retail sales, unexpectedly low weekly jobless claims, and renewed expectations that the Federal Reserve will hold rates longer, put pressure on the CAD.

On Friday, Bitcoin rose above $120,000, just shy of the record high reached earlier in the week, as markets reacted to the passage of the first major digital assets law in the US. The House of Representatives approved the bill on Thursday after the Senate voted in favor of it earlier, and President Donald Trump is expected to sign it later in the day. The legislation establishes a regulatory framework for stablecoins — digital tokens backed by assets such as the US dollar — marking a key milestone after years of lobbying by the industry. Over the past year, Bitcoin has risen nearly 30% thanks to optimism about regulatory progress and growing institutional demand through ETFs.

European stock markets were mostly higher yesterday. Germany’s DAX (DE40) rose by 1.51%, France’s CAC 40 (FR40) closed up 1.29%, the Spanish IBEX35 (ES35) added 0.78%, and the British FTSE 100 (UK100) closed positive 0.52%.

European stocks closed sharply higher on Thursday, erasing the losses of the last three sessions, as markets assessed a number of key corporate indicators and revised their outlook for European trade. Consumer price inflation in the Eurozone in June 2025 was confirmed at 2% year-on-year, up from May’s eight-month low of 1.9% and in line with the European Central Bank’s official target. Inflation in the services sector accelerated to 3.3% from May’s three-year low of 3.2%. Meanwhile, core inflation, which excludes energy, food, alcohol, and tobacco prices, remained at 2.3%, the lowest since January 2022.

WTI oil prices rose by 1.7% to $67.5 per barrel on Thursday, ending a three-day losing streak as low inventories and renewed tensions in the Middle East supported the market. According to the latest data, US crude oil inventories fell by 3.9 million barrels last week, significantly exceeding previous expectations and signaling a reduction in supply. Meanwhile, drone attacks on oil fields in Iraqi Kurdistan led to a shutdown and reduction in production of 150,000 barrels per day. Ongoing instability in the region, including recent Israeli strikes in Syria, also heightened market concerns.

Natural gas prices (XNG/USD) in the US are holding at $3.56/MMBtu, the highest in three weeks, due to increased demand for cooling in hotter-than-usual weather. Power generators are burning more gas to meet air conditioning needs. In addition, projections show that high temperatures will continue in the lower 48 states until early August, with the peak of the summer heat expected next week.

Asian markets were mostly up on Thursday. Japan’s Nikkei 225 (JP225) rose by 0.60%, China’s FTSE China A50 (CHA50) added 0.04%, Hong Kong’s Hang Seng (HK50) lost 0.08%, and Australia’s ASX 200 (AU200) showed a positive result of 0.90%.

Malaysia’s economy grew by 4.5% year-on-year in the second quarter of 2025, slightly higher than the 4.4% growth in the previous period. The growth was driven by an acceleration in agricultural activity, which grew by 2% compared to 0.6% growth. Growth in the services sector also accelerated to 5.3% from 5%, supported by positive performance across all subsectors.

S&P 500 (US500) 6,297.36 +33.66 (+0.54%)

Dow Jones (US30) 44,484.49 +229.71 (+0.52%)

DAX (DE40) 24,370.93 +361.55 (+1.51%)

FTSE 100 (UK100) 8,972.64 +46.09 (+0.52%)

USD Index 98.65 +0.26 (+0.26%)

News feed for: 2025.07.18

  • Japan National Core Consumer Price Index at 02:30 (GMT+3);
  • German Producer Price Index (m/m) at 09:00 (GMT+3);
  • US Building Permits (m/m) at 15:30 (GMT+3);
  • US Michigan Inflation Expectations (m/m) at 17:00 (GMT+3).

By JustMarkets


This article reflects a personal opinion and should not be interpreted as an investment advice, and/or offer, and/or a persistent request for carrying out financial transactions, and/or a guarantee, and/or a forecast of future events.

Week Ahead: Alphabet & Tesla in focus as “MAG 7” earnings kick off

By ForexTime 

  • 2 of ‘Magnificent 7’ set to publish earnings on Wednesday 
  • Alphabet ↑ 4% month-to-date, 11% away from ATH
  • Tesla ↓ 21% year-to-date
  • Alphabet: Shares could move 5.3% ↑ or ↓ post earnings
  • Tesla: Shares could move 5.6% ↑ or ↓ post earnings

The week ahead is stacked with high-impact events and corporate earnings from the largest companies in the world:

Sunday, 20th July 

  • JP225: Japan upper house election

Monday, 21st July 

  • CN50: China loan prime rates
  • NZD: New Zealand CPI
  • UK100: UK Prime Minister Keir Starmer speech
  • USDInd: US Conference Board leading index

Tuesday, 22nd July

  • AUD: RBA meeting minutes
  • NZD: New Zealand trade
  • NGN: Nigeria rate decision
  • TWN: Taiwan export orders, jobless rate
  • US500: US Richmond Fed manufacturing index, Fed Chair Jerome Powell speech

Wednesday, 23rd July

  • EUR: Eurozone consumer confidence
  • TWN: Taiwan industrial production
  • USDInd: US existing home sales
  • NAS100: Alphabet, Tesla earnings
  • President Donald Trump speech on A.I.

Thursday, 24th July

  • CAD: Canada retail sales
  • EUR: ECB rate decision, Germany PMI & Consumer confidence
  • JPY: Japan S&P Global Manufacturing PMI
  • UK100: UK S&P Global Manufacturing PMI, Gfk Consumer Confidence
  • US500: Initial jobless claims, S&P Global Manufacturing PMI, Intel earnings

Friday, 25th July

  • GER40: Germany IFO business climate, Volkswagen earnings
  • UK100: UK retail sales
  • EUR: ECB survey of professional forecasters
  • JPY: Japan Tokyo CPI
  • SG20: Singapore industrial production

Earnings season is in full swing with US banks reporting strong results. Next up will be results from big tech companies, which may inject fresh volatility into US equity markets.

Two of the so-called ‘Magnificent 7’ tech titans will be under the spotlight.


1)  Alphabet

Alphabet, the parent company of Google reports its second-quarter earnings on Wednesday 23rd July after US markets close. 

Its shares gained 14% in Q2 amid strong AI product demand and growth in the cloud business. However, bulls may need a fresh catalyst to push Alphabet’s year-to-date gains out of the red. 

This could come in the form of strong earnings and robust advertising revenue growth.

Beyond earnings, updates on its cloud, ad business and AI innovations will be in focus. 

Markets are forecasting a 5.3% move, either up or down, for Alphabet stocks post earnings.

Imagen
Alphabet

2) Tesla

Tesla is also set to release its second-quarter earnings on Wednesday after the close of US trading.

It’s been a rough year for the EV maker thanks to the political drama between Elon Musk and Donald Trump. Earlier this month, Trump threatened to withdraw government subsidies from Elon Musk’s companies – further weighing on Tesla shares.

Tesla is down over 20% year-to-date and could extend losses if its latest quarterly results are below market expectations.

Markets are forecasting a 5.6% move, either up or down, for Tesla stocks post-earnings.

Imagen
Tesla


What does this mean for FXTM’s NAS100

  • FXTM’s NAS100 tracks the underlying benchmark Nasdaq 100 index.
  • Alphabet and Tesla are part of the top 10 constituents, making up just over 10% of its weight. 
  • The index is up 10% since the start of 2025, recently hitting a fresh all-time high above 23100.
  •  Key levels of interest can be found at 23500, 23000 & 22600.
Imagen
NAS100
 

Forex-Time-LogoArticle by ForexTime

ForexTime Ltd (FXTM) is an award winning international online forex broker regulated by CySEC 185/12 www.forextime.com

Gold Ends the Week in Decline

By RoboForex Analytical Department

Gold remained below $3,340 per ounce this week, on track to close in negative territory for the first time in three weeks. The downward pressure followed stronger-than-expected US economic data, which reduced expectations of an imminent interest rate cut by the Federal Reserve.

June’s retail sales significantly outperformed forecasts, while initial jobless claims dropped to a three-month low – further evidence of the US economy’s resilience despite ongoing trade tensions.

In response, Adriana Kugler, a member of the Federal Reserve’s Board of Governors, suggested that maintaining the current interest rate in the near term would be prudent. Meanwhile, Mary Daly, President of the Federal Reserve Bank of San Francisco, still anticipates two rate cuts before year-end.

Gold continues to benefit from demand for defensive assets amid escalating trade and geopolitical risks. Former US President Donald Trump has announced plans to notify more than 150 trading partners of impending tariffs, heightening uncertainty in global trade.

Additionally, rising geopolitical tensions worldwide reinforce gold’s appeal as a hedge against instability, thereby ensuring its role as a key tool for wealth preservation.

Technical Analysis: XAU/USD

H4 Chart:

The XAU/USD pair is consolidating around $3,344 on the H4 chart, with the current range extending downward to $3,312. Today, prices have retested $3,344, and we anticipate further consolidation near this level.

  • Bullish scenario: a breakout above $3,344 could trigger an upward wave towards $3,384
  • Bearish scenario: a downward breakout may lead to a decline towards $3,235

The MACD indicator supports this outlook, with its signal line above zero and pointing firmly upward.

H1 Chart:

On the H1 chart, the market completed a decline wave to $3,310 before rebounding to $3,344, effectively returning to the consolidation range’s midpoint. Currently, trading lacks a clear directional bias, with equal potential for further gains or losses.

  • Upside potential: a breakout above $3,344 may extend gains towards $3,384
  • Downside risk: a drop below the range could see a downward wave towards $3,235

The Stochastic oscillator aligns with this view, as its signal line has risen from 20 and is now trending upward towards 80.

Conclusion

Gold faces short-term bearish pressure from robust US economic data, but long-term support persists due to trade uncertainties and geopolitical risks. Traders should monitor key technical levels for breakout opportunities in either direction.


Disclaimer

Any forecasts contained herein are based on the author’s particular opinion. This analysis may not be treated as trading advice. RoboForex bears no responsibility for trading results based on trading recommendations and reviews contained herein.

EUR/USD Under Pressure Amid Strong US Dollar Sentiment

By RoboForex Analytical Department

The EUR/USD pair has dipped back into negative territory, trading at 1.1615 as the US dollar regains ground following yesterday’s losses.

Market sentiment was initially rattled by reports suggesting Federal Reserve Chair Jerome Powell could be dismissed. Although Donald Trump later described these rumours as “unlikely”, the speculation reignited concerns over the central bank’s independence.

On the macroeconomic front, weaker-than-expected US producer inflation data added to the case for potential Fed rate cuts later this year. June’s price index remained flat, contrary to forecasts of a modest rise.

Traders now await retail sales figures, which could provide further insight into the strength of US domestic demand.

Meanwhile, trade tensions persist as Trump reaffirmed plans to maintain 25% tariffs on Japanese imports while hinting at a potential new trade deal with India. Earlier in the week, he also signalled progress in negotiations with Indonesia. These developments suggest the White House is balancing its hardline trade stance with efforts to engage Asian partners.

Technical Analysis: EUR/USD

H4 Chart:

On the H4 chart, the EUR/USD pair has formed a consolidation range following the breakdown from the growth channel at 1.1675 and has subsequently completed a downward move towards the local target of 1.1562. A correction back to the 1.1720 level has also taken place. At present, a new wave of decline is developing towards 1.1520. Technically, this scenario is confirmed by the MACD indicator, as its signal line is below zero and pointing firmly downward.

H1 Chart:

On the H1 chart, the EUR/USD pair has executed a downward impulse to 1.1610, followed by a correction to 1.1658. Today, a tight consolidation range is expected to form around 1.1620. If the pair breaks lower from this range, a move towards 1.1585 becomes likely, with the potential for further downside continuation to 1.1520. Technically, this scenario is confirmed by the Stochastic oscillator: its signal line lies below 50 and is heading sharply lower towards 20.

Conclusion

The EUR/USD remains under pressure amid dollar strength, with technical indicators supporting further downside potential. Market focus now shifts to upcoming US retail sales data and evolving trade dynamics.


Disclaimer

Any forecasts contained herein are based on the author’s particular opinion. This analysis may not be treated as trading advice. RoboForex bears no responsibility for trading results based on trading recommendations and reviews contained herein.

TSMC hits record high ahead of earnings release

By ForexTime 

  • US-listed TSMC shares ↑ 20% YTD 
  • Shares hit new all-time highs on Tuesday
  • Forward guidance for Q3 in focus
  • TSMC makes up over 20% of FXTM’s TWN index
  • Technical levels for TSMC – $240, $225 and $218

US-listed shares of Taiwan Semiconductor Manufacturing (TSMC) surged to a fresh all-time high on Tuesday!

Note: TSMC shares can be traded on the Taiwan Stock Exchange (TWSE) and New York Stock Exchange (NYSE).

These gains have further solidified TSMC’s trillion-dollar valuation with sentiment firmly bullish after revenues rose a better-than-anticipated 39% in Q2.  Its shares are up 20% year-to-date, adding to the 90% gains secured in 2024.

Most importantly, the chipmaker is a key supplier to Nvidia, which has achieved a $4 trillion market valuation. This welcome development, along with a positive earnings report could push the company’s stock to fresh records. 


When will earnings be published?

  • TSMC will report second-quarter earnings on Thursday 17th before US markets open.


Market expectations

  • The chipmaker is expected to post earnings of $2.50 per share, with Q2 revenues rising to $31.70 billion from $20.82 billion in the prior year, marking a 52% increase.


What to watch out for

  • TSMC remains exposed to Trump’s tariff drama, with Taiwan hit with a steep tariff of 32% effective from August 1st.
  • Although Taiwan is said to be entering the final stages of a trade deal with the United States, the clock is ticking. The CEO of TSMC stated that tariffs had some impact on TSMC but not directly because tariffs are imposed on importers not exporters.
  • It will also be interesting to see if anything is mentioned about Nvidia winning approval from the Trump administration to sell its AI chips to China. 


What does this mean for FXTM’s TWN index.

  • FXTM’s TWN index tracks the underlying FTSE Taiwan RIC Capped Index. 
  • And TSMC makes up just over 20% of the index weight, meaning that the upcoming earnings could result in heightened volatility.
  • The index is up nearly 3% this month but still flat year-to-date. Prices have been trending higher in recent weeks with the all-time high roughly 7% away at 2049. 
  • Key levels of interest can be found at 1970, 1900 and 1830.
Imagen
TWNn

How will TSMC shares react?

  • Markets are forecasting a 1.5% move, either up or down, for TSMC stocks on Thursday post earnings.


Technical picture

TSMC shares are firmly bullish on the daily charts with prices trading above the 50, 100 and 200-day SMA. However, the Relative Strength Index (RSI) is near 70 – signaling that prices may be overbought.

  • A decline below $225.00 may see prices test $218 and the 50-day SMA at $206.
  • Should $225 prove to be reliable support, this may open a path toward fresh all-time highs at $240 and beyond.
Imagen
TSMmm

Forex-Time-LogoArticle by ForexTime

ForexTime Ltd (FXTM) is an award winning international online forex broker regulated by CySEC 185/12 www.forextime.com

Trump wants to fire Jerome Powell again. The RBA is likely to cut rates at its next meeting

By JustMarkets 

At the end of Wednesday, the Dow Jones (US30) Index rose by 0.53%. The S&P 500 (US500) Index rose by 0.32%. The Nasdaq (US100) Technology Index closed higher by 0.25%. The US stocks rebounded from session lows and closed higher on Wednesday after President Trump said he had no plans to fire Fed Chairman Jerome Powell, easing concerns sparked by earlier reports that he was considering taking action. Markets initially fell on reports that Trump was considering Powell’s resignation, exacerbating investor concerns about persistent inflation and ongoing trade tensions. The June Producer Price Index, which remained unchanged, brought some relief after Tuesday’s Consumer Price Index came in higher than expected and showed the fastest annual inflation since February. On the corporate front, Bank of America fell by 0.3% after earnings came in below expectations, while Morgan Stanley declined by 1.3% despite solid profits. Meanwhile, Goldman Sachs added 1% after beating earnings expectations, and Johnson & Johnson jumped 6.2% after strong results and an upgrade to its full-year expectations.

On Thursday, Bitcoin hovered around $118,000, moving sideways after retreating from record highs earlier in the week as investors assessed developments on key digital assets regulation bills. The House of Representatives approved rules for debating cryptocurrency legislation late Wednesday, the result of intense negotiations and direct intervention by President Trump. While the procedural breakthrough signaled progress, new opposition from moderate Republicans and key committee members over the changes raised doubts about the bill’s ultimate passage. The continuing uncertainty affected sentiment as markets await a clearer direction for regulation.

European stock markets were mostly lower yesterday. The German DAX (DE40) fell by 0.21%, the French CAC 40 (FR40) closed down 0.57%, the Spanish IBEX35 (ES35) rose by 0.08%, and the British FTSE 100 (UK100) closed down 0.13%. The Frankfurt DAX Index has been falling for five consecutive trading sessions. The index is affected by ongoing trade uncertainty and weak corporate earnings of European companies. While investors were hoping for a more favorable tariff agreement than previously planned, President Trump again threatened to extend tariffs to pharmaceutical products and semiconductors, possibly as early as August 1, when his “retaliatory” tax policy expires. Volkswagen fell by 3.7%, Porsche AG lost 3%, and Mercedes-Benz Group fell by 1.9%.

WTI crude oil prices fell to $66.3 per barrel on Wednesday, marking the third consecutive day of decline. The decline was driven by renewed concerns about potential oversupply and the impact of US trade tariffs on global economic growth and fuel demand. The EIA’s weekly report showed a decline in total US crude oil inventories of 3.86 million barrels, but inventories at the Cushing, Oklahoma hub rose to their highest level since June. Traders remain concerned about the risk of oversupply as OPEC+ accelerates the return of previously cut production volumes and production in North and South America continues to grow.

On Wednesday, silver prices rose to $38 per ounce, recovering from a two-day decline as the US dollar and Treasury yields retreated from recent highs. The pullback came as investors reassessed the outlook for Federal Reserve policy and monitored changes in trade dynamics. On Tuesday, silver came under pressure after US consumer inflation data caused traders to abandon expectations of an imminent Fed rate cut.

Asian markets were mostly down on Wednesday. Japan’s Nikkei 225 (JP225) fell by 0.04%, China’s FTSE China A50 (CHA50) lost 0.31%, Hong Kong’s Hang Seng (HK50) decreased by 0.29%, and Australia’s ASX 200 (AU200) showed a negative result of 0.79%.

The Bank of Indonesia lowered its base interest rate by 25 basis points to 5.25% at its July 2025 policy meeting, in line with market expectations. This move reflects the inflation projections for 2025–2026, which remains within the target range of 2.5±1%. Annual inflation rose to 1.87% in June from 1.60% in May, slightly above expectations but still within the target range. Meanwhile, the rupiah exchange rate against the US dollar rose by 0.34% in June and remains stable in mid-July, mainly due to stabilization measures by the Bank of Indonesia. Economic growth in 2025 is expected at between 4.6% and 5.4%.

The Australian dollar weakened to below $0.650 on Thursday, reversing the previous session’s gains, as weaker-than-expected employment data reinforced expectations of an RBA rate cut in August. The Australian Bureau of Statistics reported that the unemployment rate rose to a more than three-year high of 4.3% in June, ending a five-month hold and exceeding projections of 4.1%, while employment increased by only 2,000 people, significantly below the expected increase of 20,000. Weak labor market data added to evidence of an economic slowdown, strengthening the case for policy easing. Markets now see an 89% chance of a 25 basis point rate cut at the Central Bank’s August meeting.

S&P 500 (US500) 6,263.70 +19.94 (+0.32%)

Dow Jones (US30) 44,254.78 +231.49 (+0.53%)

DAX (DE40) 24,009.38 −50.91 (−0.21%)

FTSE 100 (UK100) 8,926.55 −11.77 (−0.13%)

USD Index 98.28 −0.33 (−0.34%)

News feed for: 2025.07.17

  • Japan Trade Balance (m/m) at 02:50 (GMT+3);
  • Australia Unemployment Rate (m/m) at 04:30 (GMT+3);
  • UK Average Earnings Index (m/m) at 09:00 (GMT+3);
  • UK Claimant Count Change (m/m) at 09:00 (GMT+3);
  • UK Unemployment Rate (m/m) at 09:00 (GMT+3);
  • Eurozone Consumer Price Index (m/m) at 12:00 (GMT+3);
  • US Retail Sales (m/m) at 15:30 (GMT+3);
  • US Initial Jobless Claims (w/w) at 15:30 (GMT+3);
  • US Natural Gas Storage (w/w) at 17:30 (GMT+3).

By JustMarkets


This article reflects a personal opinion and should not be interpreted as an investment advice, and/or offer, and/or a persistent request for carrying out financial transactions, and/or a guarantee, and/or a forecast of future events.

Trump’s tariff policy creates new inflationary threats. The Bank of Canada is likely to maintain its hawkish stance at the next meeting

By JustMarkets 

At the end of Tuesday, the Dow Jones (US30) Index fell by 0.98%. The S&P 500 (US500) Index fell by 0.40%. The Nasdaq (US100) Technology Index closed lower by 0.13%. Investors digested June inflation data, the latest earnings reports from major banks, and news that Nvidia may resume chip sales to China. The Consumer Price Index for June rose by 0.3% month-on-month and 2.7% year-on-year, heightening concerns that President Trump’s planned 30% tariffs on the EU and Mexico could push inflation higher. The CPI report raised concerns that tariff-driven price pressures are beginning to emerge. Shares of Wells Fargo (-5.5%) and JPMorgan (-0.9%) fell after mixed results, while Citigroup bucked the trend, rising 3.8% on strong results and a share buyback plan. As earnings season gathers momentum, Wall Street remains cautious as S&P 500 earnings growth expectations remain low and uncertainty about future Fed policy grows amid trade and inflation risks.

The Canadian dollar strengthened to 1.37 per US dollar as investors balanced rising domestic inflation with the recent softness of the US currency. Canada’s Core Consumer Price Index, the preferred measure of underlying inflation, remained unchanged at 3% in June, reinforcing expectations that the Bank of Canada will maintain its hawkish stance and keep its overnight rate at 2.75% rather than prematurely easing.

European stock markets were mostly down yesterday. The German DAX (DE40) fell by 0.42%, the French CAC 40 (FR40) closed down 0.54%, the Spanish IBEX35 (ES35) fell by 1.15%, and the British FTSE 100 (UK100) closed down 0.66%. On Tuesday, European stock indices lost their early gains and closed mostly lower as markets continued to assess how potential US tariffs could affect European businesses. US President Trump had earlier announced the introduction of 30% tariffs on imports from the European Union from August 1, prompting the bloc to continue its search for a trade agreement. EU officials recently said that negotiations on an agreement to avoid tariffs are continuing, but in any case, a retaliatory package is being prepared that could impose tariffs on US goods worth up to €72 billion.

WTI oil prices fell below $67 a barrel on Tuesday after dropping 2.2% in the previous session, as traders became skeptical that President Trump’s new campaign to pressure Russia would significantly disrupt its oil exports. Trump increased military aid to Ukraine and warned of imposing 100% tariffs if a peace agreement was not reached within 50 days, which was perceived as a threat to impose secondary sanctions on major buyers of Russian oil, such as India and China. However, markets viewed the 50-day delay as a reduction in the risk of immediate supply disruptions. Nevertheless, China provided some support, with refinery activity reaching 15.2 million barrels per day in June, the highest level since September 2023.

Asian markets were mostly up on Tuesday. Japan’s Nikkei 225 (JP225) rose by 0.55%, the Chinese FTSE China A50 (CHA50) fell by 0.40%, the Hong Kong Hang Seng (HK50) added 1.60%, and the Australian ASX 200 (AU200) showed a positive result of 0.70%.

On Wednesday, the New Zealand dollar traded around $0.594, close to its lowest level in more than three weeks, due to the strengthening of the US dollar. The US dollar strengthened after consumer inflation in the US rose in June, prompting traders to reduce bets on Federal Reserve rate cuts in the coming months. The kiwi also reacted to better-than-expected second-quarter GDP data from China, New Zealand’s largest trading partner.

The Australian dollar strengthened to $0.653 on Wednesday, ending a three-day losing streak, as investors turned their attention to Thursday’s labor market data, which could provide new insight into the near-term policy outlook. The Reserve Bank of Australia (RBA) has recently taken a cautious stance, focusing on data, citing a more balanced inflation outlook and continued labor market strength. A strong jobs report could cast doubt on the 80% probability of a rate cut at next month’s meeting, as predicted by the market. Markets currently expect an increase of 20,000 jobs in June and an unchanged unemployment rate of 4.1%.

On Tuesday, US President Donald Trump announced the conclusion of a trade agreement with Indonesia, which includes key procurement commitments that will help the country avoid tougher tariffs. Indonesian goods will now be subject to tariffs of 19%, compared to the 32% he had previously threatened.

S&P 500 (US500) 6,243.76 −24.80 (−0.40%)

Dow Jones (US30) 44,023.29 −436.36 (−0.98%)

DAX (DE40) 24,060.29 −100.35 (−0.42%)

FTSE 100 (UK100) 8,938.32 −59.74 (−0.66%)

USD Index 98.64 +0.55 (+0.56%)

News feed for: 2025.07.16

  • UK Consumer Price Index (m/m) at 09:00 (GMT+3);
  • Eurozone Trade Balance (m/m) at 12:00 (GMT+3);
  • US Producer Price Index (m/m) at 15:30 (GMT+3);
  • US Industrial Production (m/m) at 16:15 (GMT+3);
  • US Crude Oil Reserves (w/w) at 17:30 (GMT+3).

By JustMarkets


This article reflects a personal opinion and should not be interpreted as an investment advice, and/or offer, and/or a persistent request for carrying out financial transactions, and/or a guarantee, and/or a forecast of future events.

The Pound Continues to Decline, with Little Support from the Bank of England

By RoboForex Analytical Department

The GBP/USD pair has slowed its decline, stabilising near 1.3391.

On the previous day, Bank of England Governor Andrew Bailey addressed key global economic challenges in a speech at Mansion House. He described the latest wave of trade tariffs as a systemic event capable of reshaping global trade dynamics. Bailey highlighted growing domestic imbalances in the US and weak domestic demand in China, urging both nations to clarify their strategies for addressing these issues.

However, Bailey clarified that not all trade imbalances are inherently problematic – many stem from productivity disparities between nations. Yet, he warned that widening macroeconomic and political divergences are increasing systemic fragility. Recent developments, he added, have exposed weaknesses in multilateral cooperation and a failure to tackle emerging challenges effectively.

The Governor also stressed the International Monetary Fund’s (IMF) role in mitigating global imbalances, calling for more proactive international institutions. He attributed distortions primarily to domestic economic policies, cautioning that without reform, global financial stability could be at risk.

While current imbalances remain manageable by historical standards, Bailey warned against complacency. A comprehensive reassessment of policy approaches is essential to ensure the stability and predictability of the financial system.

Technical Analysis: GBP/USD

H4 Chart:

On the H4 chart, the GBP/USD pair has declined to the 1.3450 level, where a consolidation range has now formed. The pair has broken out to the downside, reaching 1.3378. Today, a short-term rebound to 1.3415 (as a retest from below) is possible. However, if resistance holds, the pair may resume its decline towards 1.3296. Upon completion of this downward wave, a potential bounce towards 1.3450 could follow. Technically, this scenario is confirmed by the MACD indicator, whose signal line is below zero and pointing firmly downward.

H1 Chart:

On the H1 chart, the GBP/USD pair is extending the third wave of its decline, with a local target at 1.3296. Once this level is reached, a correction towards 1.3460 could unfold. Technically, this scenario is supported by the Stochastic oscillator, with its signal line below 80 and trending sharply downwards towards 20.

Conclusion

Bearish momentum persists, with key support levels in focus. A short-term pullback remains possible, but the broader downtrend is likely to continue unless a significant shift in fundamentals occurs.


Disclaimer

Any forecasts contained herein are based on the author’s particular opinion. This analysis may not be treated as trading advice. RoboForex bears no responsibility for trading results based on trading recommendations and reviews contained herein.

Bitcoin reached $122,000. Oil prices are falling amid potential tariffs against Russian oil

By JustMarkets

At the end of Monday, the Dow Jones Index (US30) rose by 0.20%. The S&P 500 Index (US500) added 0.14%. The Nasdaq Technology Index (US100) closed higher by 0.33%.

The US stocks closed slightly higher on Monday as investors weighed President Trump’s new tariff threats against optimism about upcoming earnings and inflation data. Trump announced plans to impose 30% tariffs on goods from the EU and Mexico starting August 1, but hopes for continued negotiations helped ease investor concerns. Markets are also preparing for a wave of second-quarter earnings reports, with major banks such as JPMorgan Chase and Wells Fargo set to report on Tuesday. At the same time, investors are awaiting the June Consumer Price Index report, which may show how previously imposed tariffs are affecting inflation and shape expectations for the Fed’s next move.

On Monday, Bitcoin (BTC/USD) jumped more than 2% and exceeded the $122,000 mark, setting a new all-time high and strengthening its position among the largest assets by market capitalization, which is now estimated at $2.4 trillion. The latest rally is fueled by growing institutional demand, especially through spot exchange-traded funds, as well as favorable US political prospects and favorable global macroeconomic conditions. The bullish momentum is reinforced by expectations of further rate cuts by the US Federal Reserve, as markets increasingly lean toward a more accommodative monetary policy. Trump continues to exert political pressure on Fed Chairman Jerome Powell, demanding lower borrowing costs in an attempt to stimulate growth.

European stock markets traded without a clear trend yesterday. The German DAX (DE40) fell by 0.39%, the French CAC 40 (FR40) closed down 0.27%, the Spanish IBEX35 (ES35) rose by 0.19% (up +0.33% for the week), and the British FTSE 100 (UK100) closed up 0.64%. The Frankfurt DAX Index continued to decline after President Donald Trump threatened to impose 30% tariffs on goods from the EU, which will take effect on August 1. Nevertheless, markets remained hopeful that the measures would be softened as part of ongoing trade discussions. At today’s meeting, EU ministers agreed to prioritize negotiations with Washington in an attempt to avoid tariffs. If the negotiations fail, the EU is preparing retaliatory tariffs worth €72 billion. The European automotive sector was hit hard: VW, BMW, and Mercedes lost up to 2.5%, while Volvo fell by 5% after warning of profitability issues related to tariffs on electric vehicles. On a brighter note, shares in defense companies such as Thales rose after Macron approved a €6.5 billion military spending plan.

WTI oil prices fell by 2.1% to below $67 per barrel on Monday after President Trump failed to announce new sanctions against Russian oil, disappointing markets that had expected tougher action. Although Trump warned of the possible imposition of 100% secondary tariffs on Russia if a truce was not reached within 50 days, the lack of immediate action put pressure on prices. Hedge funds responded by reducing their bullish positions at the fastest pace since February. However, Chinese trade data provided some support: crude oil imports rose and purchases of Iranian oil increased in June, indicating steady demand in the near term.

Natural gas prices (XNG/USD) in the US rose to a weekly high, exceeding $3.4 per million barrels, thanks to growth in LNG exports and expectations of hotter-than-usual weather, which is expected to increase demand for gas at the end of July. Gas flows at the eight major LNG export plants in the US averaged 15.8 billion cubic feet per day (bcfd) in July, as several facilities resumed operations after maintenance and downtime.

Asian markets were mostly higher on Monday. Japan’s Nikkei 225 (JP225) fell by 0.28%, China’s FTSE China A50 (CHA50) rose by 0.05%, Hong Kong’s Hang Seng (HK50) added 0.26%, and Australia’s ASX 200 (AU200) showed a negative result of 0.11%.

Hong Kong stocks fell at the opening of the trading session, interrupting a three-session winning streak. Traders reacted to China’s second-quarter GDP data, which showed economic growth of 5.2% y/y, the slowest pace in three quarters, although slightly above the expectations of 5.1%. Meanwhile, China’s statistics agency noted continuing external uncertainty and warned that domestic demand remains weak.

The Australian dollar rose to $0.654 on Tuesday after a notable decline in the previous session. Domestically, sentiment improved thanks to positive economic data: the Westpac-Melbourne Institute Consumer Sentiment Index rose 0.6% month-on-month to 93.1 in July 2025. This was the third consecutive monthly increase, signaling a modest but encouraging improvement in consumer sentiment.

S&P 500 (US500) 6,268.56 +8.81 (+0.14%)

Dow Jones (US30) 44,459.65 +88.14 (+0.20%)

DAX (DE40) 24,160.64 (−0.39%)

FTSE 100 (UK100) 8,998.06 +56.94 (+0.64%)

USD Index 98.12 (+0.28%)

News feed for: 2025.07.15

  • Australia Westpac Consumer Confidence (m/m) at 03:30 (GMT+3);
  • Chinese GDP (y/y) at 05:00 (GMT+3);
  • Chinese Industrial Production (m/m) at 05:00 (GMT+3);
  • Chinese Unemployment Rate (m/m) at 05:00 (GMT+3);
  • Chinese Retail Sales  (m/m) at 05:00 (GMT+3);
  • German ZEW Economic Sentiment (m/m) at 12:00 (GMT+3);
  • Eurozone ZEW Economic Sentiment (m/m) at 12:00 (GMT+3);
  • Eurozone Industrial Production (m/m) at 12:00 (GMT+3);
  • US Consumer Price Index (m/m) at 15:30 (GMT+3);
  • Canada Consumer Price Index (m/m) at 15:30 (GMT+3).

By JustMarkets


This article reflects a personal opinion and should not be interpreted as an investment advice, and/or offer, and/or a persistent request for carrying out financial transactions, and/or a guarantee, and/or a forecast of future events.