By JustMarkets
At yesterday’s stock market close, the Dow Jones Index (US30) added 0.30%, while the S&P 500 Index (US500) was up by 0.14%. The NASDAQ Technology Index (US100) closed positive by 0.16% on Wednesday. A decline in global bond yields is lending support to stocks on optimism that global central banks will start cutting interest rates next year.
According to data compiled by Bloomberg, trading volume in US exchange-traded funds on Tuesday was 35% below the 30-day average. That suggests investor activity is waning ahead of the New Year.
Apple (AAPL) fell by 0.78%, added to Tuesday’s 0.28% loss, and topped the Dow Jones (US30) losers list after the US Trade Representative decided not to overturn the International Trade Commission’s ruling that Apple infringed two patents owned by Masimo and Cercacor Laboratories. AstraZeneca (AZN) rose more than 1% yesterday after its $1.2 billion acquisition of Gracell Biotechnologies, which allows it to expand its line of cancer drugs.
Equity markets in Europe were mostly up yesterday. Germany’s DAX (DE40) rose by 0.21%, France’s CAC 40 (FR40) gained 0.04%, Spain’s IBEX 35 (ES35) added 0.10% and the UK’s FTSE 100 (UK100) closed positive by 0.36%. Speculation that the Fed will cut interest rates before the ECB puts pressure on the dollar and favors the euro. Markets estimate the chances of a 25 bps rate cut by the US Fed at 14% at the next FOMC meeting on January 30-31 and 98% at the March 19-20 meeting. Meanwhile, swaps rate the odds of a 25 bps ECB rate cut at 4% at the next meeting on January 25 and 64% at the March 7 meeting.
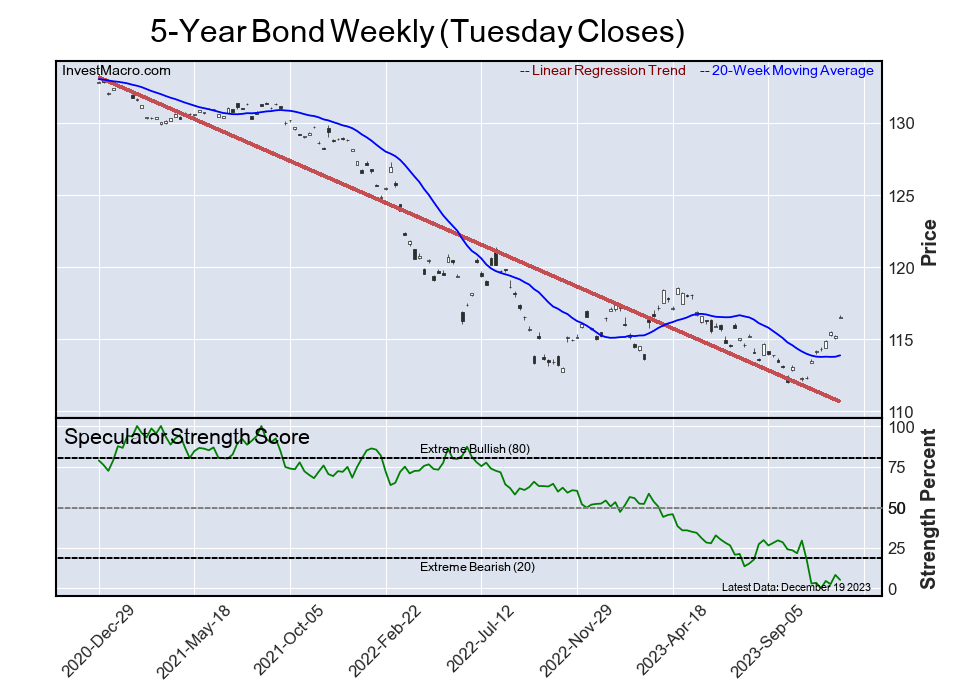
German 10-year bond yields fell to a one-year low. German bonds have been rising since late October as weak Eurozone economic data and slowing inflation suggest the European Central Bank won’t keep rates high for long.
Crude oil prices were under technical selling pressure on Wednesday as funds closed their crude oil positions ahead of the year-end.
Asian markets rallied yesterday. Japan’s Nikkei 225 (JP225) gained 1.13% over yesterday, China’s FTSE China A50 (CHA50) added 0.14%, Hong Kong’s Hang Seng (HK50) increased by 1.74%, and Australia’s ASX 200 (AU200) was positive by 0.79%.
Some BOJ officials called for a more in-depth discussion on the future exit from ultra-loose monetary policy as the economy moves towards the Bank’s price target. While the board agreed to maintain the massive stimulus for the time being, the views of the nine representatives were split between those who are cautious about raising interest rates and those who believe it is necessary to start preparing for a future exit.
Factory output in Japan fell in November, dragged down by a drop in auto production and clouding the outlook for the export-dependent economy. Automobile production, the mainstay of industrial output, fell by 2.5% in November. Output of electrical, information and communication electronics equipment also fell by 3.5% due to weak semiconductor demand.
S&P 500 (US500) 4,781.62 +6.87 (+0.14%)
Dow Jones (US30) 37,657.04 +111.71 (+0.30%)
DAX (DE40) 16,742.07 +35.89 (+0.21%)
FTSE 100 (UK100) 7,724.95 +27.44 (+0.36%)
USD Index 100.95 −0.52 (−0.51%)
- – Japan Industrial Production (m/m) at 01:50 (GMT+2);
- – Japan Retail Sales (m/m) at 01:50 (GMT+2);
- – US Initial Jobless Claims (w/w) at 15:30 (GMT+2);
- – US Pending Home Sales (m/m) at 17:00 (GMT+2);
- – US Natural Gas Storage (w/w) at 17:30 (GMT+2);
- – US Crude Oil Inventories (w/w) at 18:00 (GMT+2).
By JustMarkets
This article reflects a personal opinion and should not be interpreted as an investment advice, and/or offer, and/or a persistent request for carrying out financial transactions, and/or a guarantee, and/or a forecast of future events.