
By InvestMacro
Here are the latest charts and statistics for the Commitment of Traders (COT) reports data published by the Commodities Futures Trading Commission (CFTC).
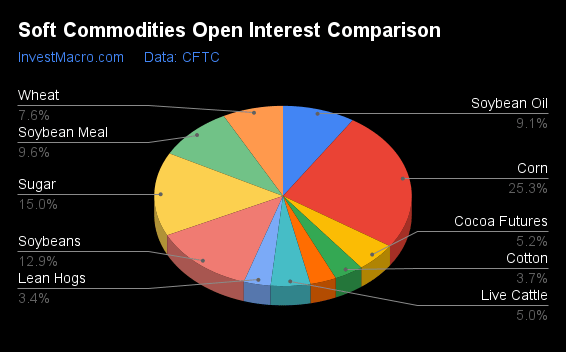
The latest COT data is updated through Tuesday November 14th and shows a quick view of how large traders (for-profit speculators and commercial entities) were positioned in the futures markets.
Weekly Speculator Changes led by Soybeans & Soybean Meal
The COT soft commodities markets speculator bets were higher this week as seven out of the eleven softs markets we cover had higher positioning while the other four markets had lower speculator contracts.
Free Reports:
 Get our Weekly Commitment of Traders Reports - See where the biggest traders (Hedge Funds and Commercial Hedgers) are positioned in the futures markets on a weekly basis.
 Download Our Metatrader 4 Indicators – Put Our Free MetaTrader 4 Custom Indicators on your charts when you join our Weekly Newsletter
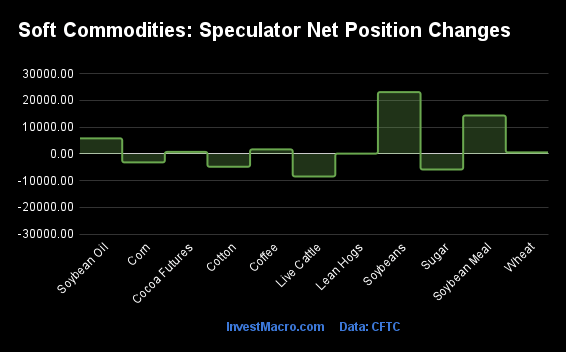
Leading the gains for the softs markets was Soybeans (23,120 contracts) with Soybean Meal (14,358 contracts), Soybean Oil (5,834 contracts), Cocoa (757 contracts), Coffee (1,692 contracts), Wheat (573 contracts) and Lean Hogs (137 contracts) also showing positive weeks.
The markets with the declines in speculator bets this week were Live Cattle (-8,412 contracts), Sugar (-5,817 contracts), Cotton (-4,788 contracts) and Corn (-3,159 contracts) also registering lower bets on the week.
| Nov-14-2023 | OI | OI-Index | Spec-Net | Spec-Index | Com-Net | COM-Index | Smalls-Net | Smalls-Index |
|---|---|---|---|---|---|---|---|---|
| WTI Crude | 1,639,133 | 22 | 215,734 | 19 | -246,762 | 81 | 31,028 | 42 |
| Gold | 486,634 | 30 | 155,376 | 45 | -177,019 | 56 | 21,643 | 38 |
| Silver | 134,826 | 26 | 22,398 | 50 | -31,634 | 56 | 9,236 | 18 |
| Copper | 206,072 | 47 | -16,608 | 16 | 16,449 | 85 | 159 | 19 |
| Palladium | 27,381 | 100 | -11,230 | 2 | 11,283 | 99 | -53 | 39 |
| Platinum | 85,870 | 97 | -3,996 | 6 | -2,365 | 89 | 6,361 | 53 |
| Natural Gas | 1,296,464 | 67 | -102,627 | 35 | 83,245 | 69 | 19,382 | 26 |
| Brent | 129,416 | 10 | -31,863 | 50 | 28,504 | 50 | 3,359 | 57 |
| Heating Oil | 303,453 | 37 | 32,569 | 82 | -51,504 | 28 | 18,935 | 59 |
| Soybeans | 738,268 | 43 | 86,677 | 27 | -69,495 | 73 | -17,182 | 63 |
| Corn | 1,448,933 | 33 | -109,200 | 1 | 133,085 | 97 | -23,885 | 97 |
| Coffee | 189,044 | 10 | 28,667 | 57 | -29,696 | 46 | 1,029 | 25 |
| Sugar | 860,384 | 39 | 226,266 | 72 | -277,525 | 24 | 51,259 | 69 |
| Wheat | 436,959 | 87 | -59,038 | 25 | 58,799 | 76 | 239 | 69 |
Strength Scores led by Cocoa & Soybean Meal
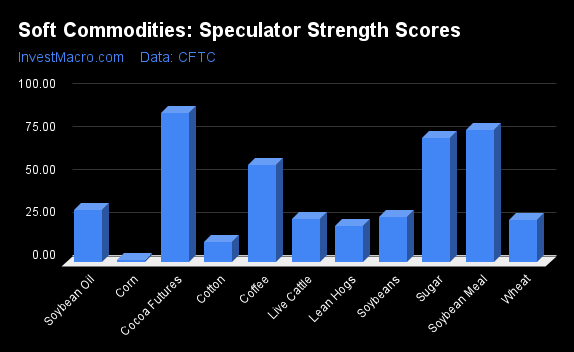
COT Strength Scores (a normalized measure of Speculator positions over a 3-Year range, from 0 to 100 where above 80 is Extreme-Bullish and below 20 is Extreme-Bearish) showed that Cocoa (87 percent) and Soybean Meal (77 percent) lead the softs markets this week. Sugar (72 percent) and Coffee (57 percent) come in as the next highest in the weekly strength scores.
On the downside, Corn (1 percent) and Cotton (12 percent) come in at the lowest strength levels currently and are in Extreme-Bearish territory (below 20 percent). The next lowest strength scores are the Lean Hogs (21 percent) and the Live Cattle (25 percent).
Strength Statistics:
Corn (1.4 percent) vs Corn previous week (1.9 percent)
Sugar (72.5 percent) vs Sugar previous week (74.6 percent)
Coffee (56.8 percent) vs Coffee previous week (55.1 percent)
Soybeans (26.5 percent) vs Soybeans previous week (17.8 percent)
Soybean Oil (30.2 percent) vs Soybean Oil previous week (26.8 percent)
Soybean Meal (76.9 percent) vs Soybean Meal previous week (68.9 percent)
Live Cattle (25.1 percent) vs Live Cattle previous week (34.2 percent)
Lean Hogs (21.1 percent) vs Lean Hogs previous week (21.0 percent)
Cotton (11.6 percent) vs Cotton previous week (15.2 percent)
Cocoa (87.3 percent) vs Cocoa previous week (86.5 percent)
Wheat (24.8 percent) vs Wheat previous week (24.4 percent)
Coffee & Soybean Meal top the 6-Week Strength Trends
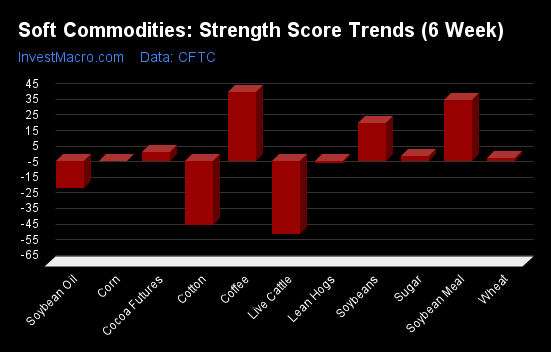
COT Strength Score Trends (or move index, calculates the 6-week changes in strength scores) showed that Coffee (44 percent) and Soybean Meal (39 percent) lead the past six weeks trends for soft commodities. Soybeans (24 percent) and Cocoa (6 percent) are the next highest positive movers in the latest trends data.
Live Cattle (-47 percent) leads the downside trend scores currently with Cotton (-41 percent) and Soybean Oil (-17 percent) following next with lower trend scores.
Strength Trend Statistics:
Corn (-0.2 percent) vs Corn previous week (1.9 percent)
Sugar (3.2 percent) vs Sugar previous week (-2.6 percent)
Coffee (44.2 percent) vs Coffee previous week (36.5 percent)
Soybeans (24.2 percent) vs Soybeans previous week (6.4 percent)
Soybean Oil (-17.4 percent) vs Soybean Oil previous week (-19.1 percent)
Soybean Meal (39.4 percent) vs Soybean Meal previous week (20.4 percent)
Live Cattle (-46.9 percent) vs Live Cattle previous week (-47.3 percent)
Lean Hogs (-1.1 percent) vs Lean Hogs previous week (-7.0 percent)
Cotton (-40.9 percent) vs Cotton previous week (-29.5 percent)
Cocoa (6.0 percent) vs Cocoa previous week (-3.6 percent)
Wheat (1.6 percent) vs Wheat previous week (0.3 percent)
Individual Soft Commodities Markets:
CORN Futures:
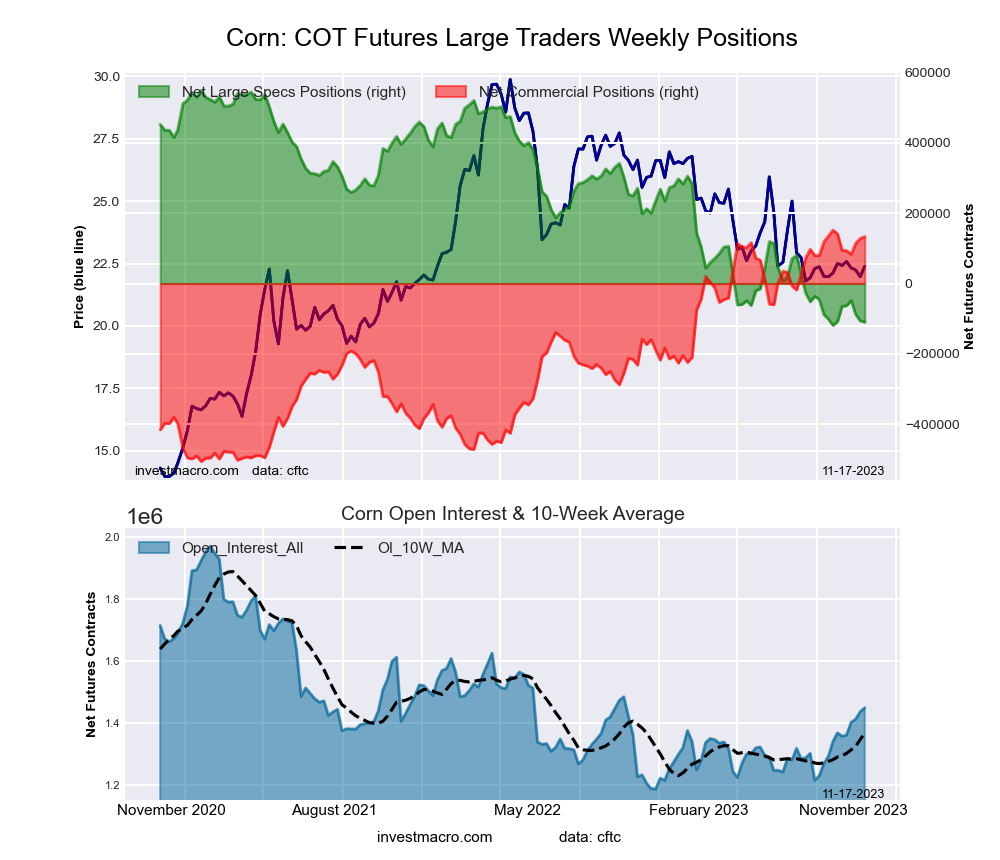 The CORN large speculator standing this week totaled a net position of -109,200 contracts in the data reported through Tuesday. This was a weekly fall of -3,159 contracts from the previous week which had a total of -106,041 net contracts.
This week’s current strength score (the trader positioning range over the past three years, measured from 0 to 100) shows the speculators are currently Bearish-Extreme with a score of 1.4 percent. The commercials are Bullish-Extreme with a score of 97.2 percent and the small traders (not shown in chart) are Bullish-Extreme with a score of 96.9 percent.
Price Trend-Following Model: Downtrend
Our weekly trend-following model classifies the current market price position as: Downtrend. The current action for the model is considered to be: Hold – Maintain Short Position.
| CORN Futures Statistics | SPECULATORS | COMMERCIALS | SMALL TRADERS |
| – Percent of Open Interest Longs: | 19.4 | 47.0 | 10.8 |
| – Percent of Open Interest Shorts: | 26.9 | 37.8 | 12.4 |
| – Net Position: | -109,200 | 133,085 | -23,885 |
| – Gross Longs: | 280,425 | 681,380 | 156,304 |
| – Gross Shorts: | 389,625 | 548,295 | 180,189 |
| – Long to Short Ratio: | 0.7 to 1 | 1.2 to 1 | 0.9 to 1 |
| NET POSITION TREND: | |||
| – Strength Index Score (3 Year Range Pct): | 1.4 | 97.2 | 96.9 |
| – Strength Index Reading (3 Year Range): | Bearish-Extreme | Bullish-Extreme | Bullish-Extreme |
| NET POSITION MOVEMENT INDEX: | |||
| – 6-Week Change in Strength Index: | -0.2 | -1.2 | 15.9 |
SUGAR Futures:
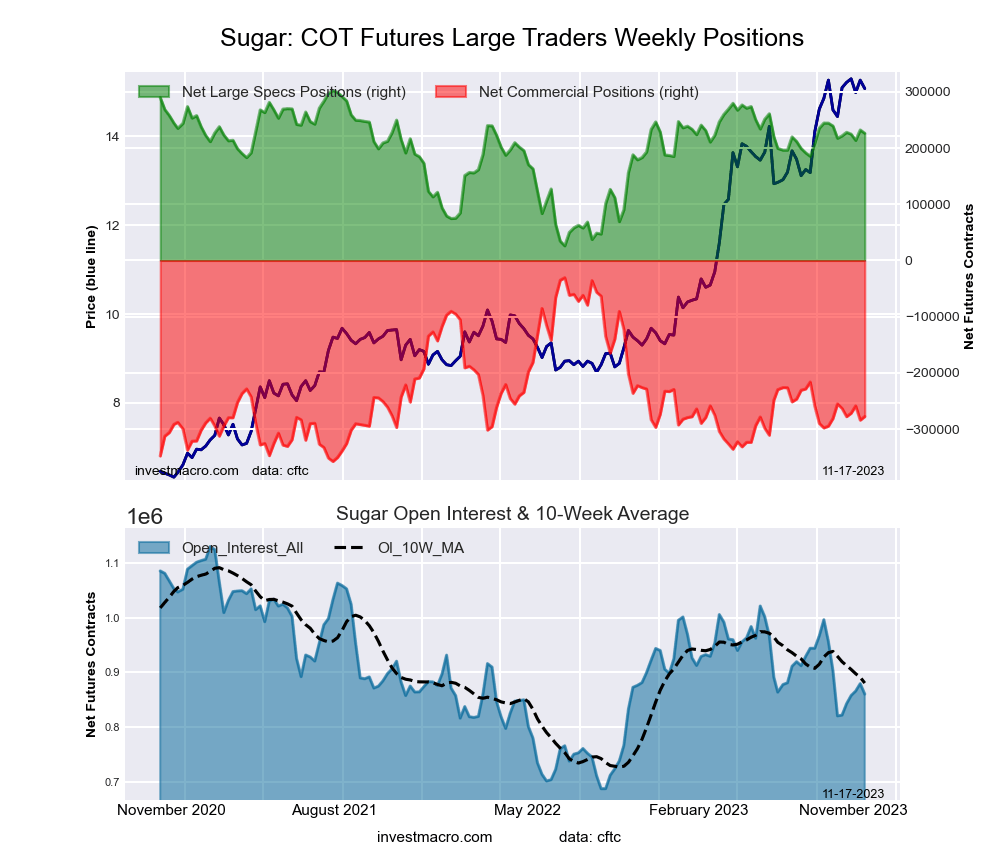 The SUGAR large speculator standing this week totaled a net position of 226,266 contracts in the data reported through Tuesday. This was a weekly decline of -5,817 contracts from the previous week which had a total of 232,083 net contracts.
This week’s current strength score (the trader positioning range over the past three years, measured from 0 to 100) shows the speculators are currently Bullish with a score of 72.5 percent. The commercials are Bearish with a score of 24.4 percent and the small traders (not shown in chart) are Bullish with a score of 69.4 percent.
Price Trend-Following Model: Uptrend
Our weekly trend-following model classifies the current market price position as: Uptrend. The current action for the model is considered to be: Hold – Maintain Long Position.
| SUGAR Futures Statistics | SPECULATORS | COMMERCIALS | SMALL TRADERS |
| – Percent of Open Interest Longs: | 36.3 | 38.5 | 10.6 |
| – Percent of Open Interest Shorts: | 10.0 | 70.8 | 4.7 |
| – Net Position: | 226,266 | -277,525 | 51,259 |
| – Gross Longs: | 312,037 | 331,517 | 91,508 |
| – Gross Shorts: | 85,771 | 609,042 | 40,249 |
| – Long to Short Ratio: | 3.6 to 1 | 0.5 to 1 | 2.3 to 1 |
| NET POSITION TREND: | |||
| – Strength Index Score (3 Year Range Pct): | 72.5 | 24.4 | 69.4 |
| – Strength Index Reading (3 Year Range): | Bullish | Bearish | Bullish |
| NET POSITION MOVEMENT INDEX: | |||
| – 6-Week Change in Strength Index: | 3.2 | -6.9 | 17.8 |
COFFEE Futures:
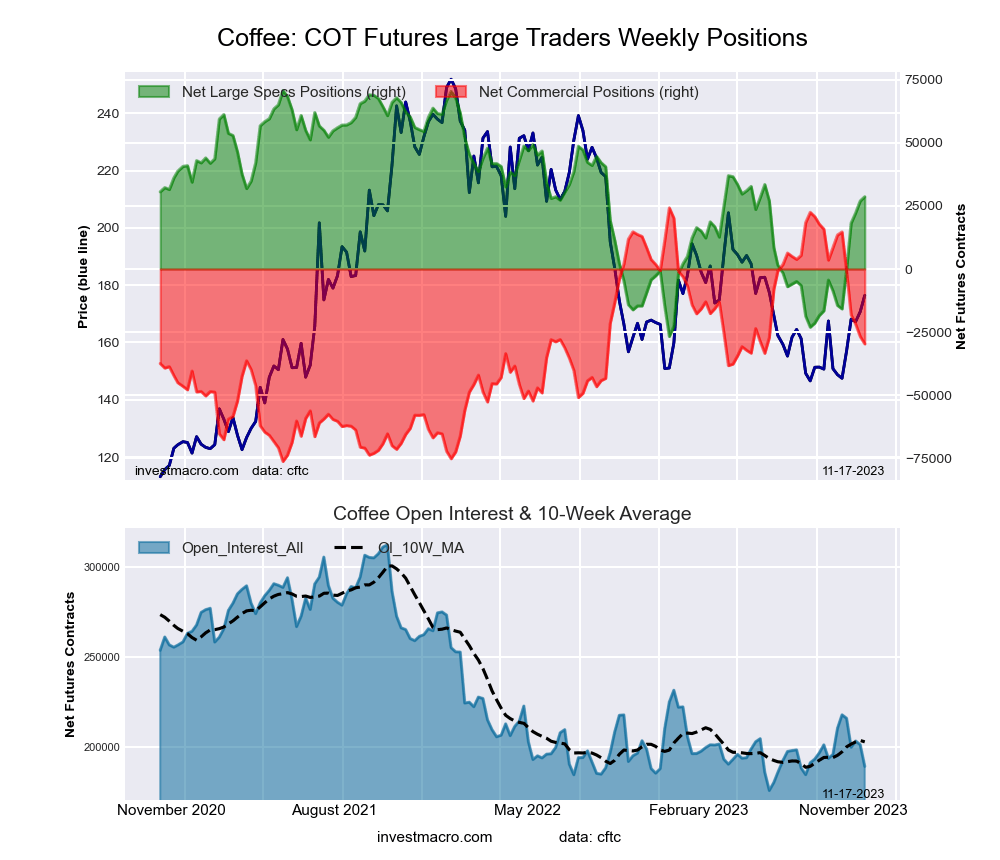 The COFFEE large speculator standing this week totaled a net position of 28,667 contracts in the data reported through Tuesday. This was a weekly boost of 1,692 contracts from the previous week which had a total of 26,975 net contracts.
This week’s current strength score (the trader positioning range over the past three years, measured from 0 to 100) shows the speculators are currently Bullish with a score of 56.8 percent. The commercials are Bearish with a score of 46.4 percent and the small traders (not shown in chart) are Bearish with a score of 25.1 percent.
Price Trend-Following Model: Strong Uptrend
Our weekly trend-following model classifies the current market price position as: Strong Uptrend. The current action for the model is considered to be: Hold – Maintain Long Position.
| COFFEE Futures Statistics | SPECULATORS | COMMERCIALS | SMALL TRADERS |
| – Percent of Open Interest Longs: | 30.2 | 41.8 | 5.8 |
| – Percent of Open Interest Shorts: | 15.0 | 57.5 | 5.3 |
| – Net Position: | 28,667 | -29,696 | 1,029 |
| – Gross Longs: | 57,038 | 79,011 | 11,018 |
| – Gross Shorts: | 28,371 | 108,707 | 9,989 |
| – Long to Short Ratio: | 2.0 to 1 | 0.7 to 1 | 1.1 to 1 |
| NET POSITION TREND: | |||
| – Strength Index Score (3 Year Range Pct): | 56.8 | 46.4 | 25.1 |
| – Strength Index Reading (3 Year Range): | Bullish | Bearish | Bearish |
| NET POSITION MOVEMENT INDEX: | |||
| – 6-Week Change in Strength Index: | 44.2 | -42.9 | 0.7 |
SOYBEANS Futures:
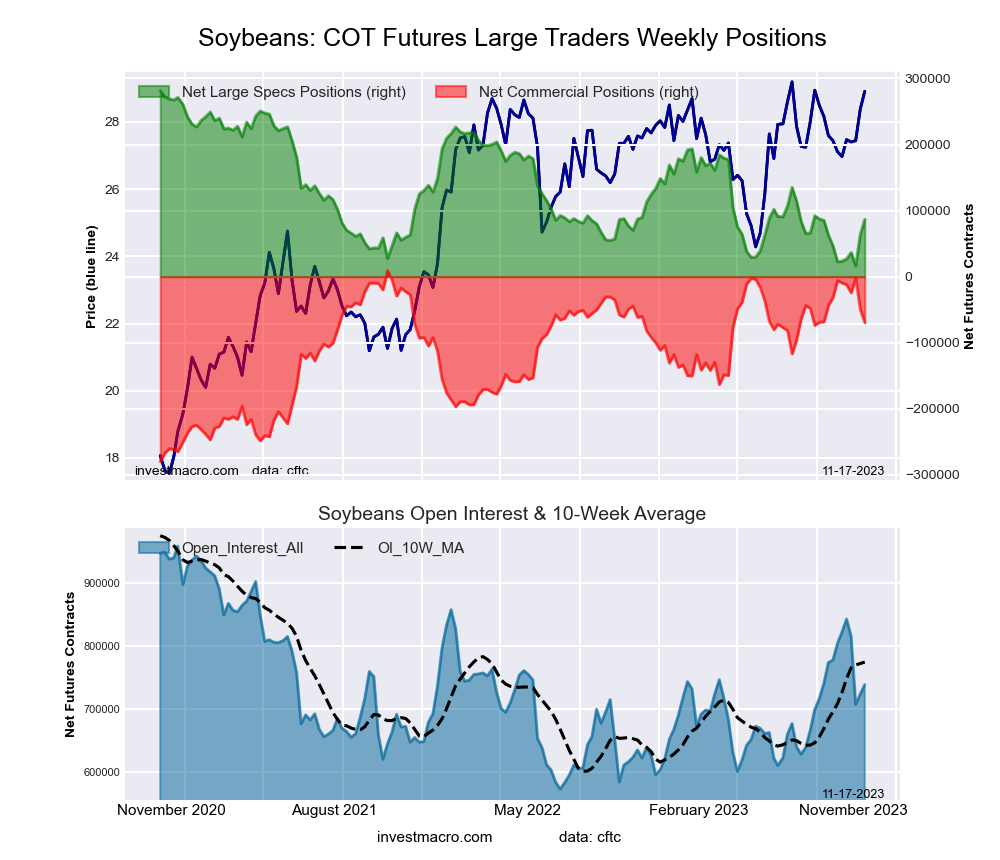 The SOYBEANS large speculator standing this week totaled a net position of 86,677 contracts in the data reported through Tuesday. This was a weekly advance of 23,120 contracts from the previous week which had a total of 63,557 net contracts.
This week’s current strength score (the trader positioning range over the past three years, measured from 0 to 100) shows the speculators are currently Bearish with a score of 26.5 percent. The commercials are Bullish with a score of 72.8 percent and the small traders (not shown in chart) are Bullish with a score of 62.7 percent.
Price Trend-Following Model: Weak Downtrend (Possible Trend Change)
Our weekly trend-following model classifies the current market price position as: Weak Downtrend. The current action for the model is considered to be: Hold – Maintain Short Position.
| SOYBEANS Futures Statistics | SPECULATORS | COMMERCIALS | SMALL TRADERS |
| – Percent of Open Interest Longs: | 21.7 | 51.6 | 7.1 |
| – Percent of Open Interest Shorts: | 10.0 | 61.0 | 9.4 |
| – Net Position: | 86,677 | -69,495 | -17,182 |
| – Gross Longs: | 160,458 | 380,773 | 52,094 |
| – Gross Shorts: | 73,781 | 450,268 | 69,276 |
| – Long to Short Ratio: | 2.2 to 1 | 0.8 to 1 | 0.8 to 1 |
| NET POSITION TREND: | |||
| – Strength Index Score (3 Year Range Pct): | 26.5 | 72.8 | 62.7 |
| – Strength Index Reading (3 Year Range): | Bearish | Bullish | Bullish |
| NET POSITION MOVEMENT INDEX: | |||
| – 6-Week Change in Strength Index: | 24.2 | -22.0 | -1.4 |
SOYBEAN OIL Futures:
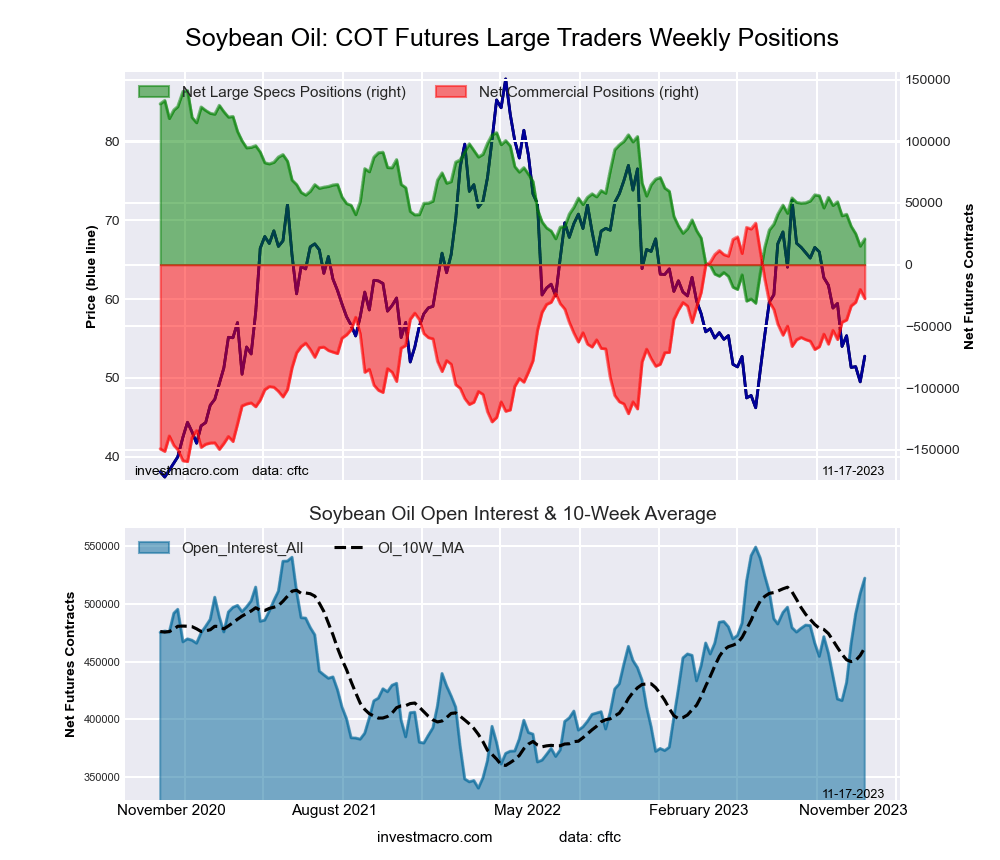 The SOYBEAN OIL large speculator standing this week totaled a net position of 20,857 contracts in the data reported through Tuesday. This was a weekly gain of 5,834 contracts from the previous week which had a total of 15,023 net contracts.
This week’s current strength score (the trader positioning range over the past three years, measured from 0 to 100) shows the speculators are currently Bearish with a score of 30.2 percent. The commercials are Bullish with a score of 68.3 percent and the small traders (not shown in chart) are Bearish with a score of 38.4 percent.
Price Trend-Following Model: Downtrend
Our weekly trend-following model classifies the current market price position as: Downtrend. The current action for the model is considered to be: Hold – Maintain Short Position.
| SOYBEAN OIL Futures Statistics | SPECULATORS | COMMERCIALS | SMALL TRADERS |
| – Percent of Open Interest Longs: | 21.3 | 46.7 | 6.5 |
| – Percent of Open Interest Shorts: | 17.3 | 52.0 | 5.3 |
| – Net Position: | 20,857 | -27,511 | 6,654 |
| – Gross Longs: | 111,193 | 243,793 | 34,073 |
| – Gross Shorts: | 90,336 | 271,304 | 27,419 |
| – Long to Short Ratio: | 1.2 to 1 | 0.9 to 1 | 1.2 to 1 |
| NET POSITION TREND: | |||
| – Strength Index Score (3 Year Range Pct): | 30.2 | 68.3 | 38.4 |
| – Strength Index Reading (3 Year Range): | Bearish | Bullish | Bearish |
| NET POSITION MOVEMENT INDEX: | |||
| – 6-Week Change in Strength Index: | -17.4 | 17.2 | -11.4 |
SOYBEAN MEAL Futures:
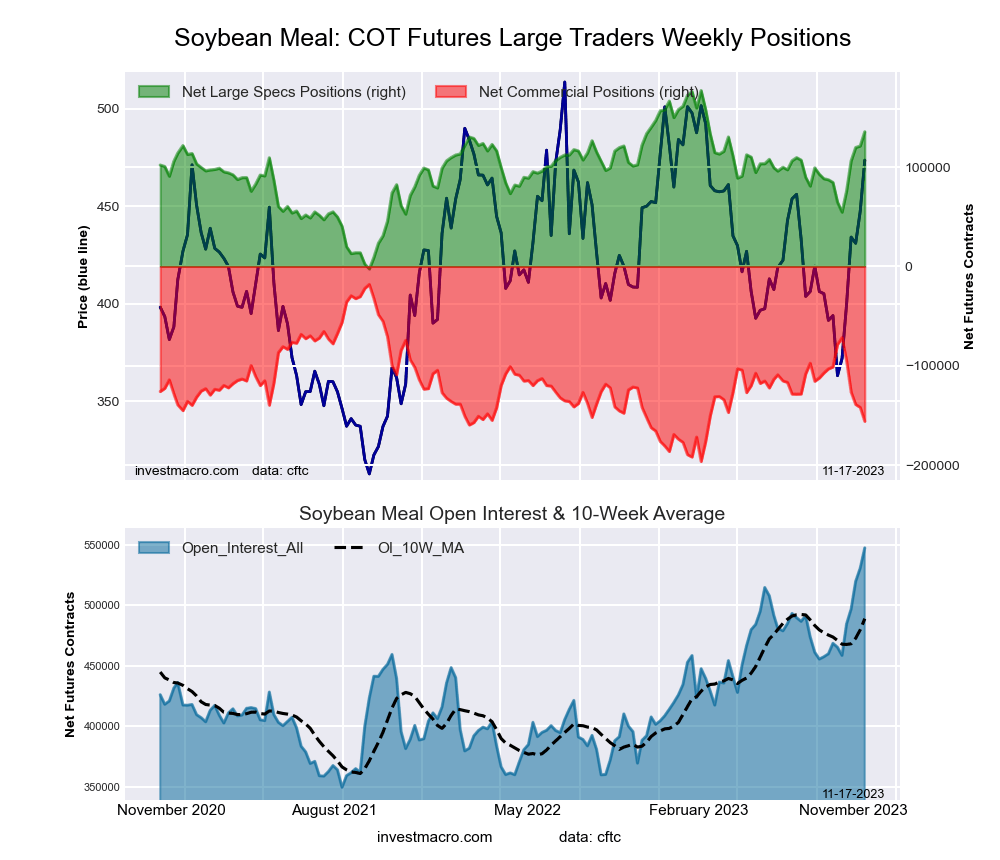 The SOYBEAN MEAL large speculator standing this week totaled a net position of 135,583 contracts in the data reported through Tuesday. This was a weekly gain of 14,358 contracts from the previous week which had a total of 121,225 net contracts.
This week’s current strength score (the trader positioning range over the past three years, measured from 0 to 100) shows the speculators are currently Bullish with a score of 76.9 percent. The commercials are Bearish with a score of 22.7 percent and the small traders (not shown in chart) are Bearish with a score of 46.0 percent.
Price Trend-Following Model: Strong Uptrend
Our weekly trend-following model classifies the current market price position as: Strong Uptrend. The current action for the model is considered to be: New Buy – Long Position.
| SOYBEAN MEAL Futures Statistics | SPECULATORS | COMMERCIALS | SMALL TRADERS |
| – Percent of Open Interest Longs: | 30.3 | 34.7 | 9.7 |
| – Percent of Open Interest Shorts: | 5.5 | 63.1 | 6.0 |
| – Net Position: | 135,583 | -155,771 | 20,188 |
| – Gross Longs: | 165,856 | 189,857 | 53,081 |
| – Gross Shorts: | 30,273 | 345,628 | 32,893 |
| – Long to Short Ratio: | 5.5 to 1 | 0.5 to 1 | 1.6 to 1 |
| NET POSITION TREND: | |||
| – Strength Index Score (3 Year Range Pct): | 76.9 | 22.7 | 46.0 |
| – Strength Index Reading (3 Year Range): | Bullish | Bearish | Bearish |
| NET POSITION MOVEMENT INDEX: | |||
| – 6-Week Change in Strength Index: | 39.4 | -43.3 | 28.5 |
LIVE CATTLE Futures:
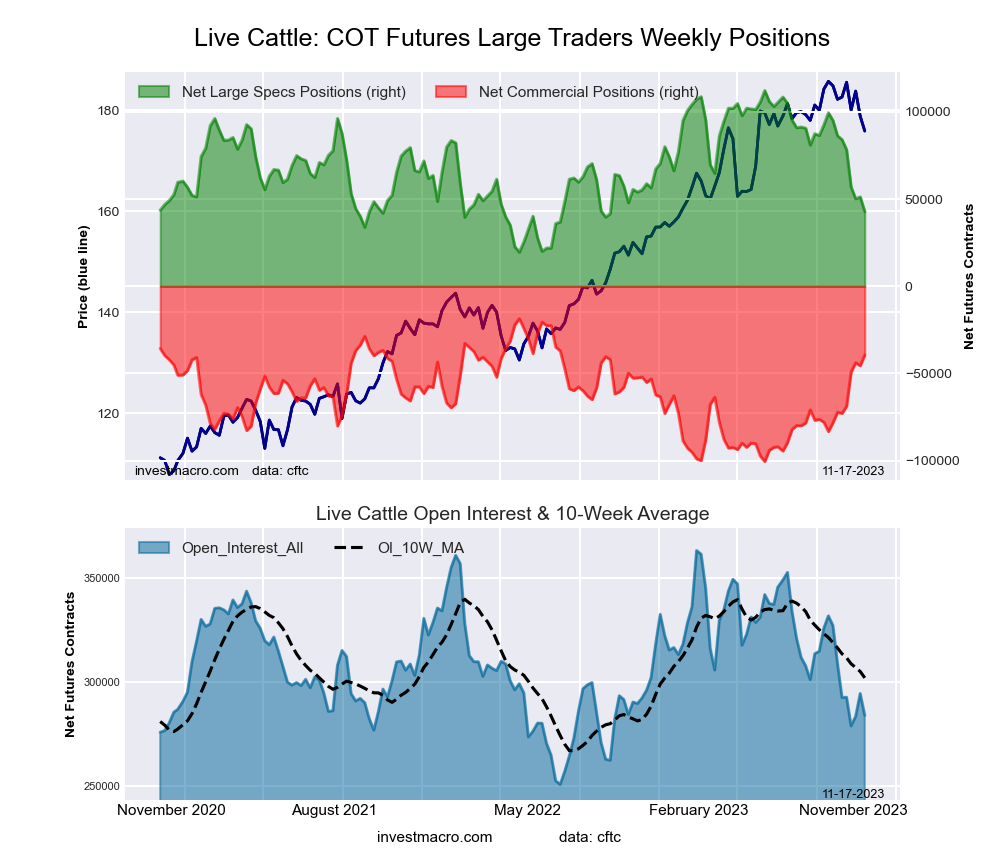 The LIVE CATTLE large speculator standing this week totaled a net position of 42,815 contracts in the data reported through Tuesday. This was a weekly fall of -8,412 contracts from the previous week which had a total of 51,227 net contracts.
This week’s current strength score (the trader positioning range over the past three years, measured from 0 to 100) shows the speculators are currently Bearish with a score of 25.1 percent. The commercials are Bullish with a score of 74.6 percent and the small traders (not shown in chart) are Bullish with a score of 71.6 percent.
Price Trend-Following Model: Weak Uptrend (Possible Trend Change)
Our weekly trend-following model classifies the current market price position as: Weak Uptrend. The current action for the model is considered to be: Hold – Maintain Long Position.
| LIVE CATTLE Futures Statistics | SPECULATORS | COMMERCIALS | SMALL TRADERS |
| – Percent of Open Interest Longs: | 28.3 | 36.3 | 10.7 |
| – Percent of Open Interest Shorts: | 13.2 | 50.2 | 11.9 |
| – Net Position: | 42,815 | -39,405 | -3,410 |
| – Gross Longs: | 80,267 | 103,122 | 30,490 |
| – Gross Shorts: | 37,452 | 142,527 | 33,900 |
| – Long to Short Ratio: | 2.1 to 1 | 0.7 to 1 | 0.9 to 1 |
| NET POSITION TREND: | |||
| – Strength Index Score (3 Year Range Pct): | 25.1 | 74.6 | 71.6 |
| – Strength Index Reading (3 Year Range): | Bearish | Bullish | Bullish |
| NET POSITION MOVEMENT INDEX: | |||
| – 6-Week Change in Strength Index: | -46.9 | 40.1 | 56.9 |
LEAN HOGS Futures:
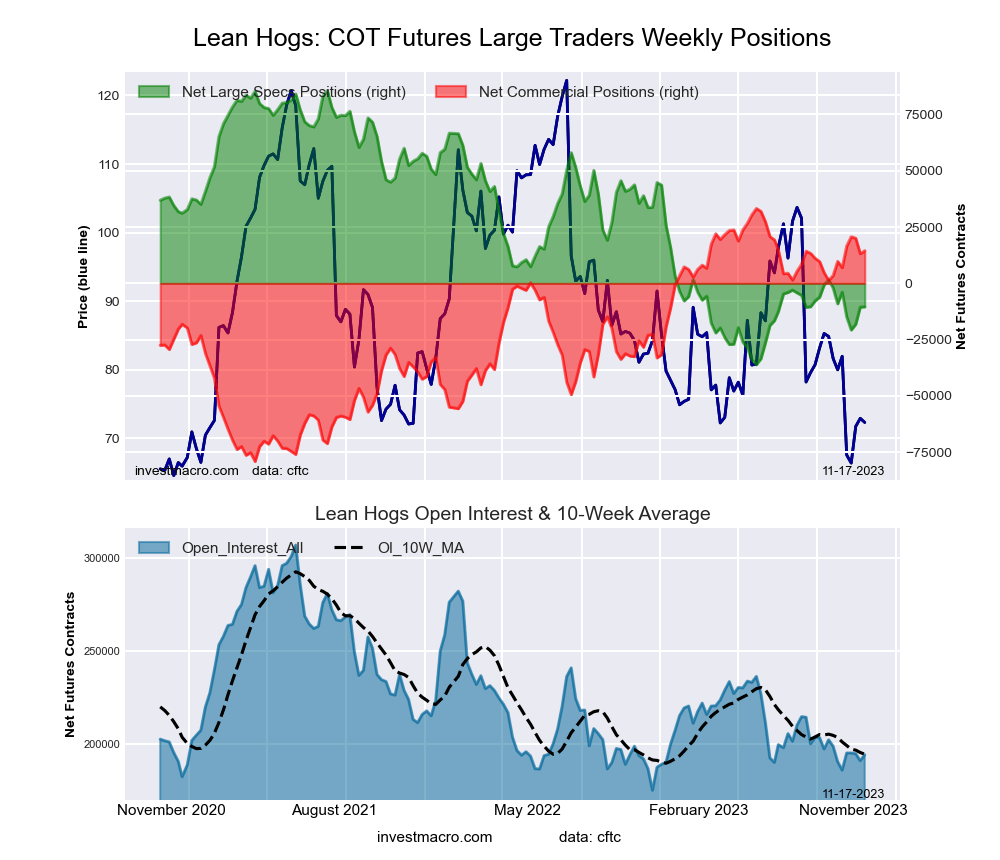 The LEAN HOGS large speculator standing this week totaled a net position of -10,448 contracts in the data reported through Tuesday. This was a weekly increase of 137 contracts from the previous week which had a total of -10,585 net contracts.
This week’s current strength score (the trader positioning range over the past three years, measured from 0 to 100) shows the speculators are currently Bearish with a score of 21.1 percent. The commercials are Bullish-Extreme with a score of 83.3 percent and the small traders (not shown in chart) are Bullish with a score of 65.4 percent.
Price Trend-Following Model: Downtrend
Our weekly trend-following model classifies the current market price position as: Downtrend. The current action for the model is considered to be: Hold – Maintain Short Position.
| LEAN HOGS Futures Statistics | SPECULATORS | COMMERCIALS | SMALL TRADERS |
| – Percent of Open Interest Longs: | 29.9 | 38.9 | 9.0 |
| – Percent of Open Interest Shorts: | 35.3 | 31.4 | 11.0 |
| – Net Position: | -10,448 | 14,461 | -4,013 |
| – Gross Longs: | 58,052 | 75,446 | 17,383 |
| – Gross Shorts: | 68,500 | 60,985 | 21,396 |
| – Long to Short Ratio: | 0.8 to 1 | 1.2 to 1 | 0.8 to 1 |
| NET POSITION TREND: | |||
| – Strength Index Score (3 Year Range Pct): | 21.1 | 83.3 | 65.4 |
| – Strength Index Reading (3 Year Range): | Bearish | Bullish-Extreme | Bullish |
| NET POSITION MOVEMENT INDEX: | |||
| – 6-Week Change in Strength Index: | -1.1 | 4.2 | -15.0 |
COTTON Futures:
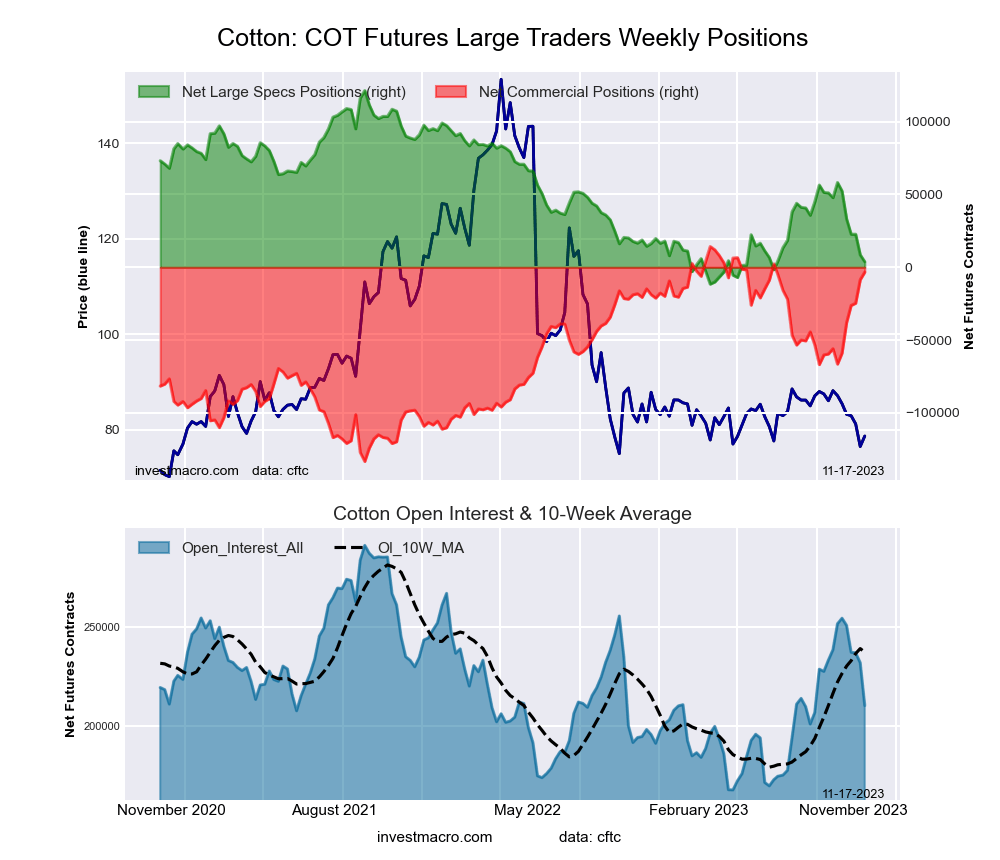 The COTTON large speculator standing this week totaled a net position of 3,780 contracts in the data reported through Tuesday. This was a weekly decline of -4,788 contracts from the previous week which had a total of 8,568 net contracts.
This week’s current strength score (the trader positioning range over the past three years, measured from 0 to 100) shows the speculators are currently Bearish-Extreme with a score of 11.6 percent. The commercials are Bullish-Extreme with a score of 88.1 percent and the small traders (not shown in chart) are Bearish-Extreme with a score of 13.4 percent.
Price Trend-Following Model: Strong Downtrend
Our weekly trend-following model classifies the current market price position as: Strong Downtrend. The current action for the model is considered to be: Hold – Maintain Short Position.
| COTTON Futures Statistics | SPECULATORS | COMMERCIALS | SMALL TRADERS |
| – Percent of Open Interest Longs: | 27.8 | 49.7 | 6.2 |
| – Percent of Open Interest Shorts: | 26.0 | 51.3 | 6.4 |
| – Net Position: | 3,780 | -3,342 | -438 |
| – Gross Longs: | 58,487 | 104,658 | 12,956 |
| – Gross Shorts: | 54,707 | 108,000 | 13,394 |
| – Long to Short Ratio: | 1.1 to 1 | 1.0 to 1 | 1.0 to 1 |
| NET POSITION TREND: | |||
| – Strength Index Score (3 Year Range Pct): | 11.6 | 88.1 | 13.4 |
| – Strength Index Reading (3 Year Range): | Bearish-Extreme | Bullish-Extreme | Bearish-Extreme |
| NET POSITION MOVEMENT INDEX: | |||
| – 6-Week Change in Strength Index: | -40.9 | 42.8 | -53.0 |
COCOA Futures:
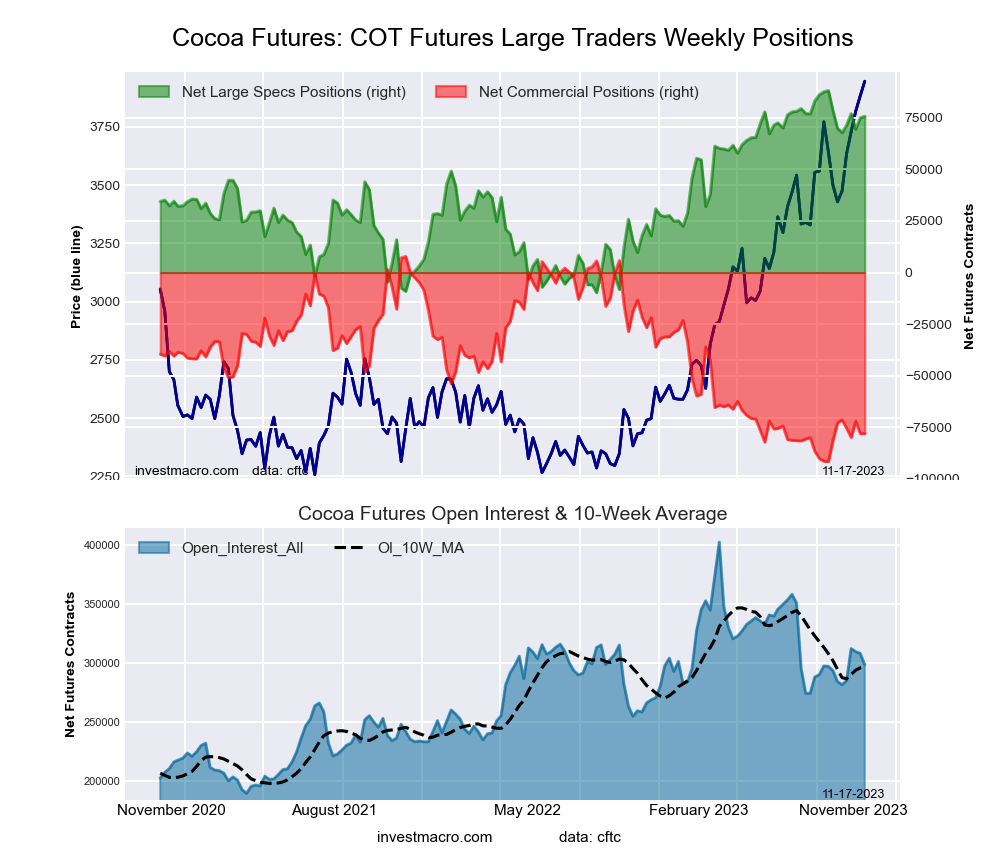 The COCOA large speculator standing this week totaled a net position of 75,784 contracts in the data reported through Tuesday. This was a weekly advance of 757 contracts from the previous week which had a total of 75,027 net contracts.
This week’s current strength score (the trader positioning range over the past three years, measured from 0 to 100) shows the speculators are currently Bullish-Extreme with a score of 87.3 percent. The commercials are Bearish-Extreme with a score of 13.6 percent and the small traders (not shown in chart) are Bearish-Extreme with a score of 19.9 percent.
Price Trend-Following Model: Strong Uptrend
Our weekly trend-following model classifies the current market price position as: Strong Uptrend. The current action for the model is considered to be: Hold – Maintain Long Position.
| COCOA Futures Statistics | SPECULATORS | COMMERCIALS | SMALL TRADERS |
| – Percent of Open Interest Longs: | 43.5 | 27.2 | 4.6 |
| – Percent of Open Interest Shorts: | 18.1 | 53.3 | 3.8 |
| – Net Position: | 75,784 | -78,125 | 2,341 |
| – Gross Longs: | 129,944 | 81,118 | 13,726 |
| – Gross Shorts: | 54,160 | 159,243 | 11,385 |
| – Long to Short Ratio: | 2.4 to 1 | 0.5 to 1 | 1.2 to 1 |
| NET POSITION TREND: | |||
| – Strength Index Score (3 Year Range Pct): | 87.3 | 13.6 | 19.9 |
| – Strength Index Reading (3 Year Range): | Bullish-Extreme | Bearish-Extreme | Bearish-Extreme |
| NET POSITION MOVEMENT INDEX: | |||
| – 6-Week Change in Strength Index: | 6.0 | -5.3 | -5.9 |
WHEAT Futures:
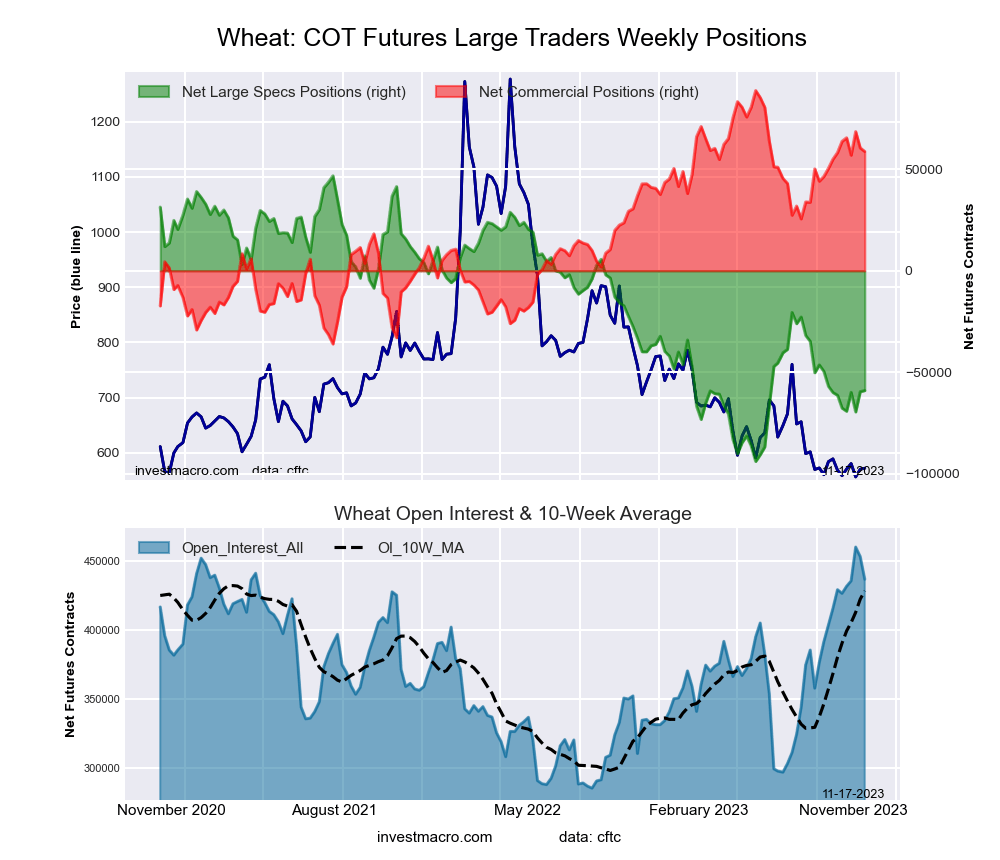 The WHEAT large speculator standing this week totaled a net position of -59,038 contracts in the data reported through Tuesday. This was a weekly boost of 573 contracts from the previous week which had a total of -59,611 net contracts.
This week’s current strength score (the trader positioning range over the past three years, measured from 0 to 100) shows the speculators are currently Bearish with a score of 24.8 percent. The commercials are Bullish with a score of 75.9 percent and the small traders (not shown in chart) are Bullish with a score of 68.6 percent.
Price Trend-Following Model: Downtrend
Our weekly trend-following model classifies the current market price position as: Downtrend. The current action for the model is considered to be: Hold – Maintain Short Position.
| WHEAT Futures Statistics | SPECULATORS | COMMERCIALS | SMALL TRADERS |
| – Percent of Open Interest Longs: | 29.4 | 32.2 | 8.3 |
| – Percent of Open Interest Shorts: | 42.9 | 18.8 | 8.3 |
| – Net Position: | -59,038 | 58,799 | 239 |
| – Gross Longs: | 128,375 | 140,853 | 36,304 |
| – Gross Shorts: | 187,413 | 82,054 | 36,065 |
| – Long to Short Ratio: | 0.7 to 1 | 1.7 to 1 | 1.0 to 1 |
| NET POSITION TREND: | |||
| – Strength Index Score (3 Year Range Pct): | 24.8 | 75.9 | 68.6 |
| – Strength Index Reading (3 Year Range): | Bearish | Bullish | Bullish |
| NET POSITION MOVEMENT INDEX: | |||
| – 6-Week Change in Strength Index: | 1.6 | 0.4 | -11.9 |
Article By InvestMacro – Receive our weekly COT Newsletter
*COT Report: The COT data, released weekly to the public each Friday, is updated through the most recent Tuesday (data is 3 days old) and shows a quick view of how large speculators or non-commercials (for-profit traders) were positioned in the futures markets.
The CFTC categorizes trader positions according to commercial hedgers (traders who use futures contracts for hedging as part of the business), non-commercials (large traders who speculate to realize trading profits) and nonreportable traders (usually small traders/speculators) as well as their open interest (contracts open in the market at time of reporting). See CFTC criteria here.

- Geopolitical and macroeconomic conditions continue to pressure market sentiment Jul 20, 2026
- USD/JPY Poised to Continue Gains as Expensive Oil and Lack of Support Weigh on Yen Jul 20, 2026
- COT Metals Charts: Weekly Speculator Bets led by Copper & Steel Jul 18, 2026
- COT Bonds Charts: Weekly Speculator Bets led by 2-Year, SOFR 3M & 5-Year Bonds Jul 18, 2026
- COT Energy Charts: Weekly Speculator Bets led by Brent Oil & Heating Oil Jul 18, 2026
- COT Soft Commodities Charts: Weekly Speculator Bets led by Wheat, Corn & Soybean Meal Jul 18, 2026
- The Bank of Canada kept its interest rate unchanged. Platinum prices reached a three‑week high Jul 16, 2026
- Stock indices rose after the release of US inflation data. China’s GDP slowed sharply Jul 15, 2026
- GBP/USD Awaits Political News: What Will Happen Next Jul 15, 2026
- USD/JPY Holds at Highs: Pressure Lingers on Yen Jul 14, 2026