By InvestMacro
Here are the latest charts and statistics for the Commitment of Traders (COT) reports data published by the Commodities Futures Trading Commission (CFTC).
The latest COT data is updated through Tuesday May 28th and shows a quick view of how large traders (for-profit speculators and commercial entities) were positioned in the futures markets.
Weekly Speculator Changes led by Soybean Meal & Soybeans
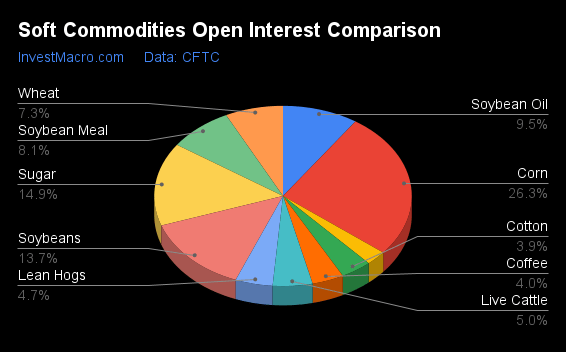
The COT soft commodities markets speculator bets were higher this week as seven out of the eleven softs markets we cover had higher positioning while the other four markets had lower speculator contracts.
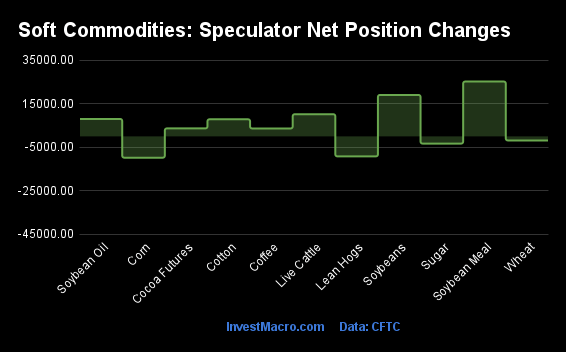
Leading the gains for the softs markets was Soybean Meal (25,247 contracts) with Soybeans (19,074 contracts), Live Cattle (10,199 contracts), Soybean Oil (8,014 contracts), Cotton (7,870 contracts), Cocoa (3,679 contracts) and Coffee (3,647 contracts) also showing positive weeks.
The markets with the declines in speculator bets this week were Corn (-9,805 contracts), Lean Hogs (-9,200 contracts), Sugar (-3,316 contracts) and with Wheat (-1,871 contracts) also registering lower bets on the week.
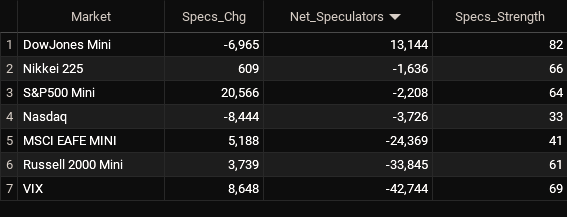
Soft Commodities Net Speculators Leaderboard
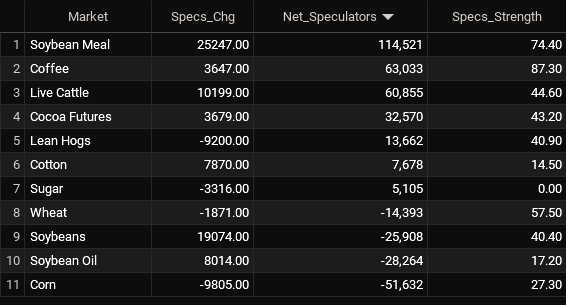
Legend: Weekly Speculators Change | Speculators Current Net Position | Speculators Strength Score compared to last 3-Years (0-100 range)
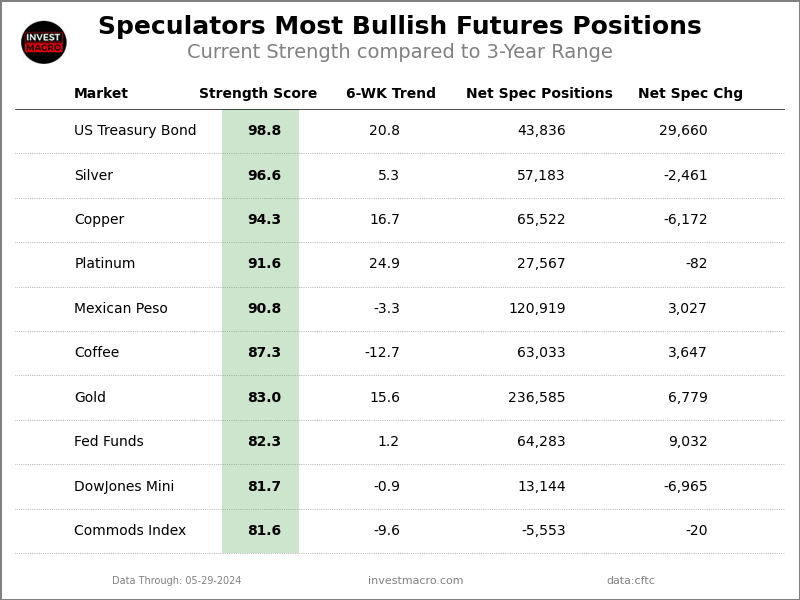
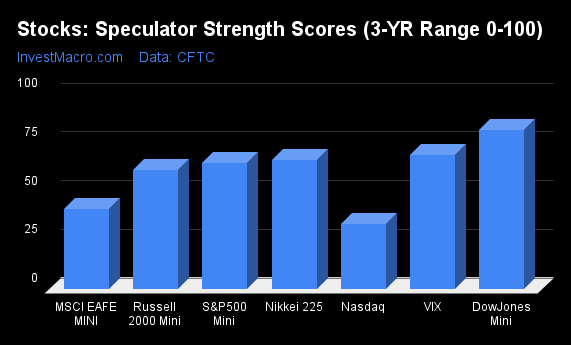
Strength Scores led by Coffee & Soybean Meal
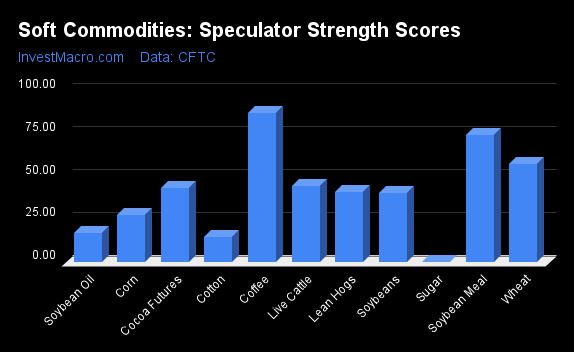
COT Strength Scores (a normalized measure of Speculator positions over a 3-Year range, from 0 to 100 where above 80 is Extreme-Bullish and below 20 is Extreme-Bearish) showed that Coffee (87 percent) and Soybean Meal (74 percent) lead the softs markets this week. Wheat (58 percent) comes in as the next highest in the weekly strength scores.
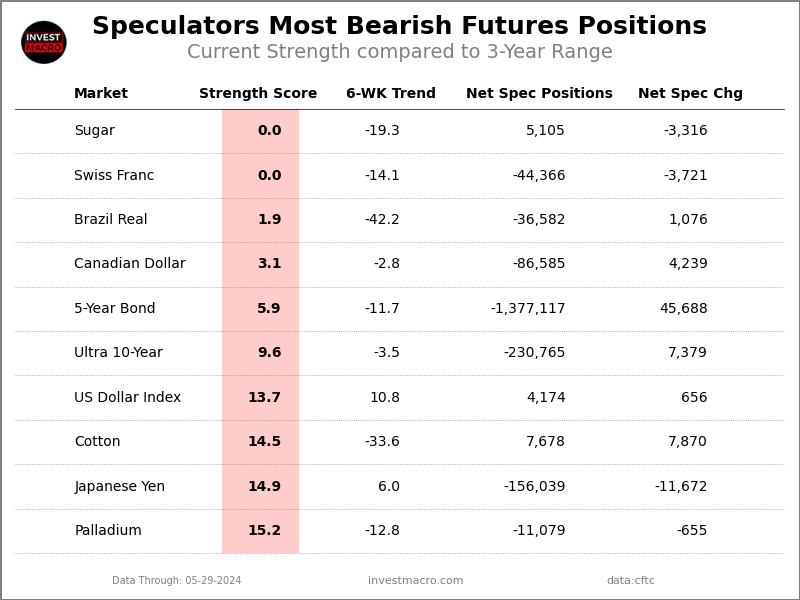
On the downside, Sugar (0 percent), Cotton (14 percent) and Soybean Oil (17 percent) come in at the lowest strength levels currently and are in Extreme-Bearish territory (below 20 percent).
Strength Statistics:
Corn (27.3 percent) vs Corn previous week (28.6 percent)
Sugar (0.0 percent) vs Sugar previous week (1.1 percent)
Coffee (87.3 percent) vs Coffee previous week (83.8 percent)
Soybeans (40.4 percent) vs Soybeans previous week (35.9 percent)
Soybean Oil (17.2 percent) vs Soybean Oil previous week (12.3 percent)
Soybean Meal (74.4 percent) vs Soybean Meal previous week (64.0 percent)
Live Cattle (44.6 percent) vs Live Cattle previous week (33.6 percent)
Lean Hogs (40.9 percent) vs Lean Hogs previous week (48.5 percent)
Cotton (14.5 percent) vs Cotton previous week (8.6 percent)
Cocoa (43.2 percent) vs Cocoa previous week (39.4 percent)
Wheat (57.5 percent) vs Wheat previous week (58.8 percent)
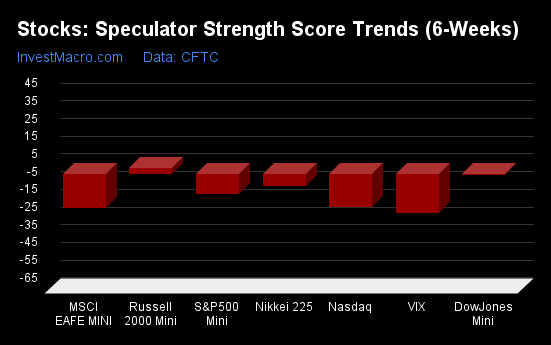
Soybean Meal & Soybeans top the 6-Week Strength Trends
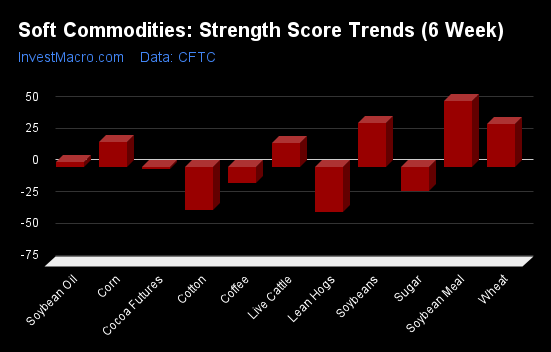
COT Strength Score Trends (or move index, calculates the 6-week changes in strength scores) showed that Soybean Meal (52 percent) and Soybeans (34 percent) lead the past six weeks trends for soft commodities. Wheat (34 percent), Corn (20 percent) and Live Cattle (19 percent) are the next highest positive movers in the latest trends data.
Lean Hogs (-35 percent) leads the downside trend scores currently with Cotton (-34 percent), Sugar (-19 percent) and Coffee (-13 percent) following next with lower trend scores.
Strength Trend Statistics:
Corn (19.5 percent) vs Corn previous week (18.9 percent)
Sugar (-19.3 percent) vs Sugar previous week (-32.7 percent)
Coffee (-12.7 percent) vs Coffee previous week (-13.8 percent)
Soybeans (34.4 percent) vs Soybeans previous week (26.8 percent)
Soybean Oil (3.8 percent) vs Soybean Oil previous week (-15.7 percent)
Soybean Meal (52.2 percent) vs Soybean Meal previous week (45.7 percent)
Live Cattle (19.2 percent) vs Live Cattle previous week (1.8 percent)
Lean Hogs (-35.2 percent) vs Lean Hogs previous week (-24.1 percent)
Cotton (-33.6 percent) vs Cotton previous week (-54.8 percent)
Cocoa (-1.3 percent) vs Cocoa previous week (-6.1 percent)
Wheat (33.7 percent) vs Wheat previous week (27.7 percent)
Individual Soft Commodities Markets:
CORN Futures:
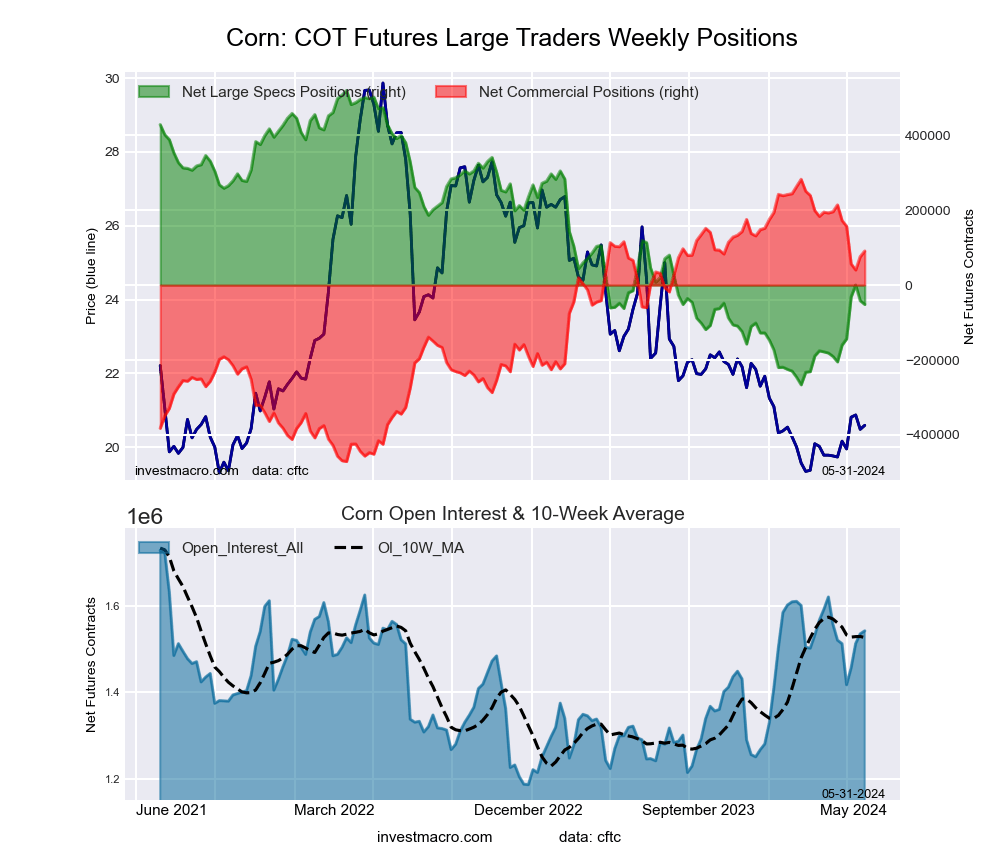 The CORN large speculator standing this week was a net position of -51,632 contracts in the data reported through Tuesday. This was a weekly fall of -9,805 contracts from the previous week which had a total of -41,827 net contracts.
This week’s current strength score (the trader positioning range over the past three years, measured from 0 to 100) shows the speculators are currently Bearish with a score of 27.3 percent. The commercials are Bullish with a score of 74.6 percent and the small traders (not shown in chart) are Bullish with a score of 55.4 percent.
Price Trend-Following Model: Weak Uptrend
Our weekly trend-following model classifies the current market price position as: Weak Uptrend. The current action for the model is considered to be: Hold – Maintain Long Position.
| CORN Futures Statistics | SPECULATORS | COMMERCIALS | SMALL TRADERS |
| – Percent of Open Interest Longs: | 21.9 | 42.2 | 9.2 |
| – Percent of Open Interest Shorts: | 25.3 | 36.3 | 11.7 |
| – Net Position: | -51,632 | 90,934 | -39,302 |
| – Gross Longs: | 337,903 | 650,550 | 141,411 |
| – Gross Shorts: | 389,535 | 559,616 | 180,713 |
| – Long to Short Ratio: | 0.9 to 1 | 1.2 to 1 | 0.8 to 1 |
| NET POSITION TREND: | |||
| – Strength Index Score (3 Year Range Pct): | 27.3 | 74.6 | 55.4 |
| – Strength Index Reading (3 Year Range): | Bearish | Bullish | Bullish |
| NET POSITION MOVEMENT INDEX: | |||
| – 6-Week Change in Strength Index: | 19.5 | -16.4 | -39.8 |
SUGAR Futures:
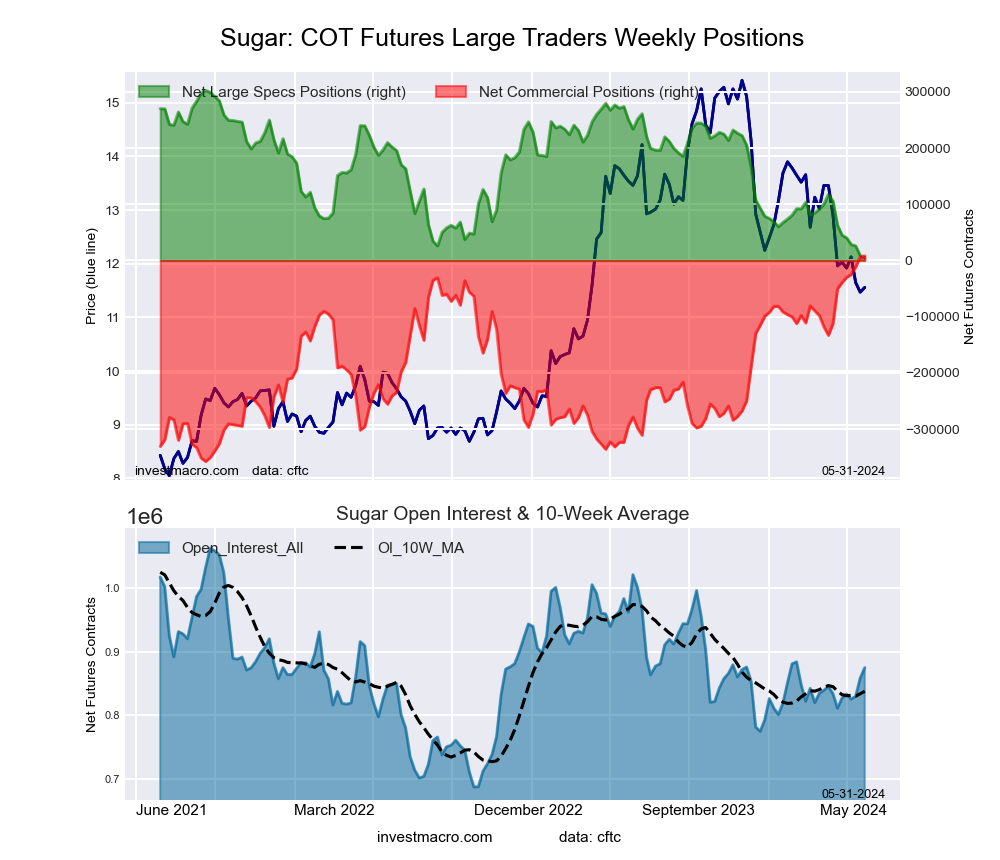 The SUGAR large speculator standing this week was a net position of 5,105 contracts in the data reported through Tuesday. This was a weekly decrease of -3,316 contracts from the previous week which had a total of 8,421 net contracts.
This week’s current strength score (the trader positioning range over the past three years, measured from 0 to 100) shows the speculators are currently Bearish-Extreme with a score of 0.0 percent. The commercials are Bullish-Extreme with a score of 100.0 percent and the small traders (not shown in chart) are Bearish-Extreme with a score of 2.2 percent.
Price Trend-Following Model: Strong Downtrend
Our weekly trend-following model classifies the current market price position as: Strong Downtrend. The current action for the model is considered to be: Hold – Maintain Short Position.
| SUGAR Futures Statistics | SPECULATORS | COMMERCIALS | SMALL TRADERS |
| – Percent of Open Interest Longs: | 23.2 | 53.5 | 7.3 |
| – Percent of Open Interest Shorts: | 22.7 | 52.6 | 8.8 |
| – Net Position: | 5,105 | 8,283 | -13,388 |
| – Gross Longs: | 203,331 | 468,232 | 63,624 |
| – Gross Shorts: | 198,226 | 459,949 | 77,012 |
| – Long to Short Ratio: | 1.0 to 1 | 1.0 to 1 | 0.8 to 1 |
| NET POSITION TREND: | |||
| – Strength Index Score (3 Year Range Pct): | 0.0 | 100.0 | 2.2 |
| – Strength Index Reading (3 Year Range): | Bearish-Extreme | Bullish-Extreme | Bearish-Extreme |
| NET POSITION MOVEMENT INDEX: | |||
| – 6-Week Change in Strength Index: | -19.3 | 16.0 | -1.4 |
COFFEE Futures:
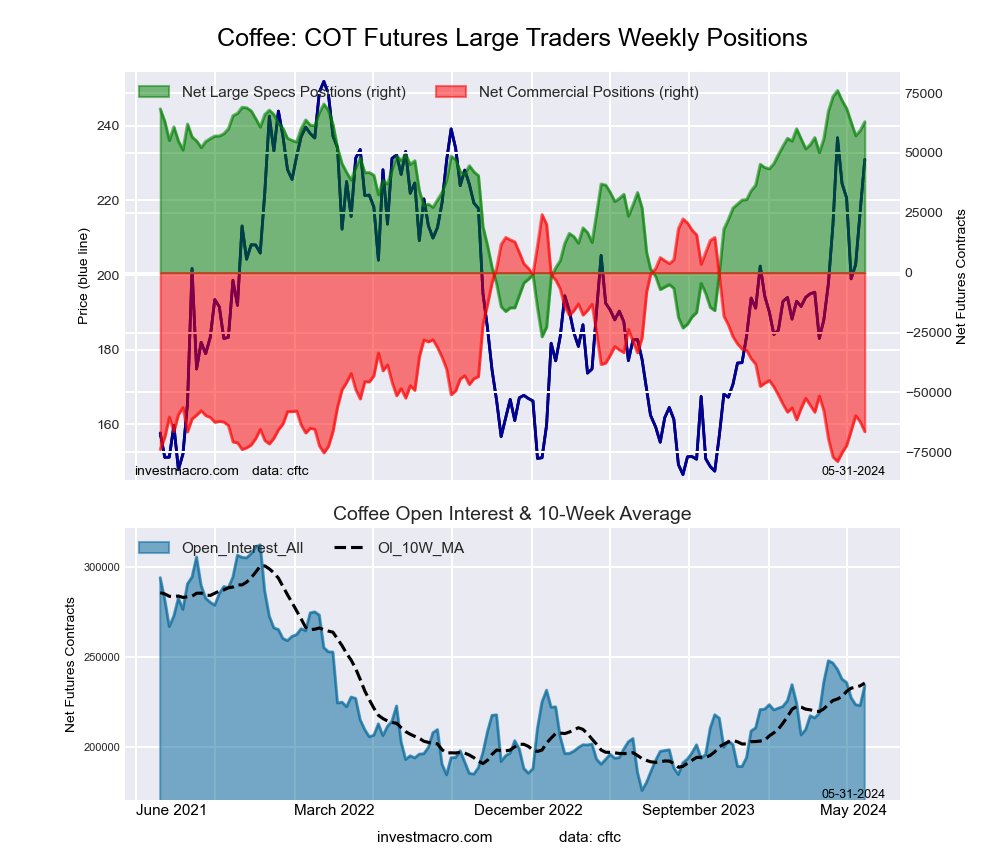 The COFFEE large speculator standing this week was a net position of 63,033 contracts in the data reported through Tuesday. This was a weekly rise of 3,647 contracts from the previous week which had a total of 59,386 net contracts.
This week’s current strength score (the trader positioning range over the past three years, measured from 0 to 100) shows the speculators are currently Bullish-Extreme with a score of 87.3 percent. The commercials are Bearish-Extreme with a score of 12.1 percent and the small traders (not shown in chart) are Bullish with a score of 65.5 percent.
Price Trend-Following Model: Strong Uptrend
Our weekly trend-following model classifies the current market price position as: Strong Uptrend. The current action for the model is considered to be: Hold – Maintain Long Position.
| COFFEE Futures Statistics | SPECULATORS | COMMERCIALS | SMALL TRADERS |
| – Percent of Open Interest Longs: | 34.7 | 35.0 | 4.0 |
| – Percent of Open Interest Shorts: | 7.7 | 63.4 | 2.6 |
| – Net Position: | 63,033 | -66,372 | 3,339 |
| – Gross Longs: | 81,146 | 81,873 | 9,381 |
| – Gross Shorts: | 18,113 | 148,245 | 6,042 |
| – Long to Short Ratio: | 4.5 to 1 | 0.6 to 1 | 1.6 to 1 |
| NET POSITION TREND: | |||
| – Strength Index Score (3 Year Range Pct): | 87.3 | 12.1 | 65.5 |
| – Strength Index Reading (3 Year Range): | Bullish-Extreme | Bearish-Extreme | Bullish |
| NET POSITION MOVEMENT INDEX: | |||
| – 6-Week Change in Strength Index: | -12.7 | 12.1 | 8.6 |
SOYBEANS Futures:
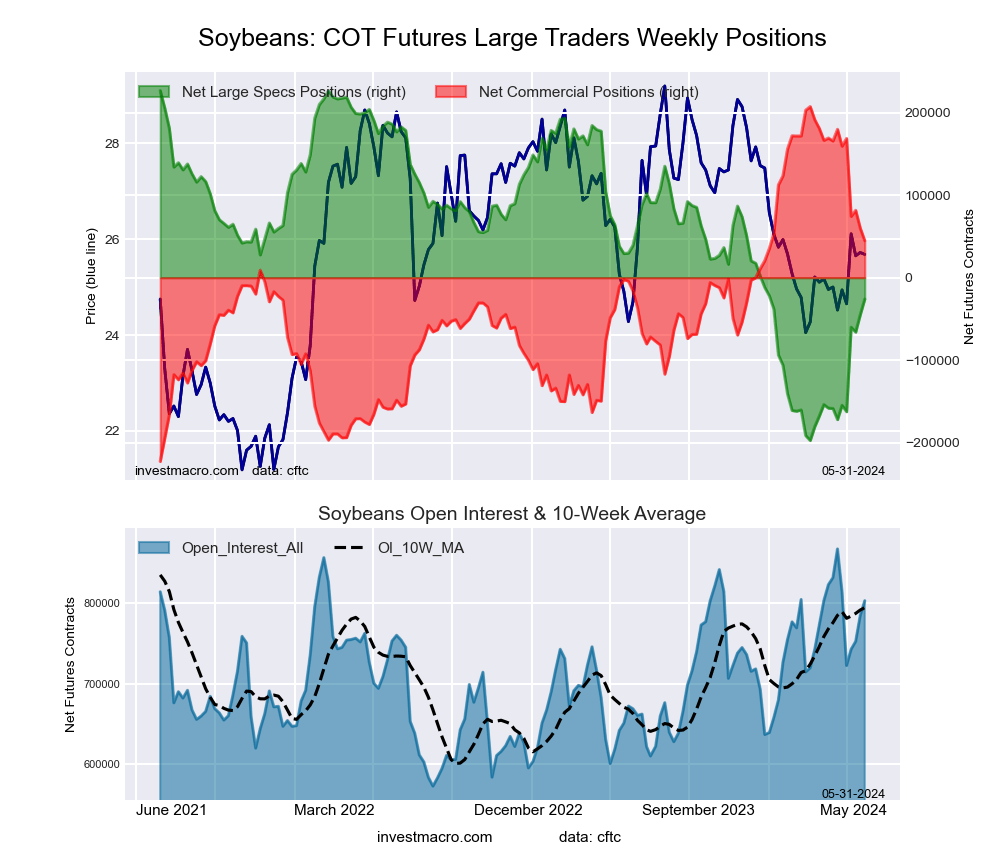 The SOYBEANS large speculator standing this week was a net position of -25,908 contracts in the data reported through Tuesday. This was a weekly increase of 19,074 contracts from the previous week which had a total of -44,982 net contracts.
This week’s current strength score (the trader positioning range over the past three years, measured from 0 to 100) shows the speculators are currently Bearish with a score of 40.4 percent. The commercials are Bullish with a score of 62.2 percent and the small traders (not shown in chart) are Bullish with a score of 62.2 percent.
Price Trend-Following Model: Uptrend
Our weekly trend-following model classifies the current market price position as: Uptrend. The current action for the model is considered to be: Hold – Maintain Long Position.
| SOYBEANS Futures Statistics | SPECULATORS | COMMERCIALS | SMALL TRADERS |
| – Percent of Open Interest Longs: | 16.1 | 57.2 | 6.8 |
| – Percent of Open Interest Shorts: | 19.4 | 51.7 | 9.2 |
| – Net Position: | -25,908 | 44,728 | -18,820 |
| – Gross Longs: | 129,688 | 459,817 | 54,827 |
| – Gross Shorts: | 155,596 | 415,089 | 73,647 |
| – Long to Short Ratio: | 0.8 to 1 | 1.1 to 1 | 0.7 to 1 |
| NET POSITION TREND: | |||
| – Strength Index Score (3 Year Range Pct): | 40.4 | 62.2 | 62.2 |
| – Strength Index Reading (3 Year Range): | Bearish | Bullish | Bullish |
| NET POSITION MOVEMENT INDEX: | |||
| – 6-Week Change in Strength Index: | 34.4 | -31.4 | -28.2 |
SOYBEAN OIL Futures:
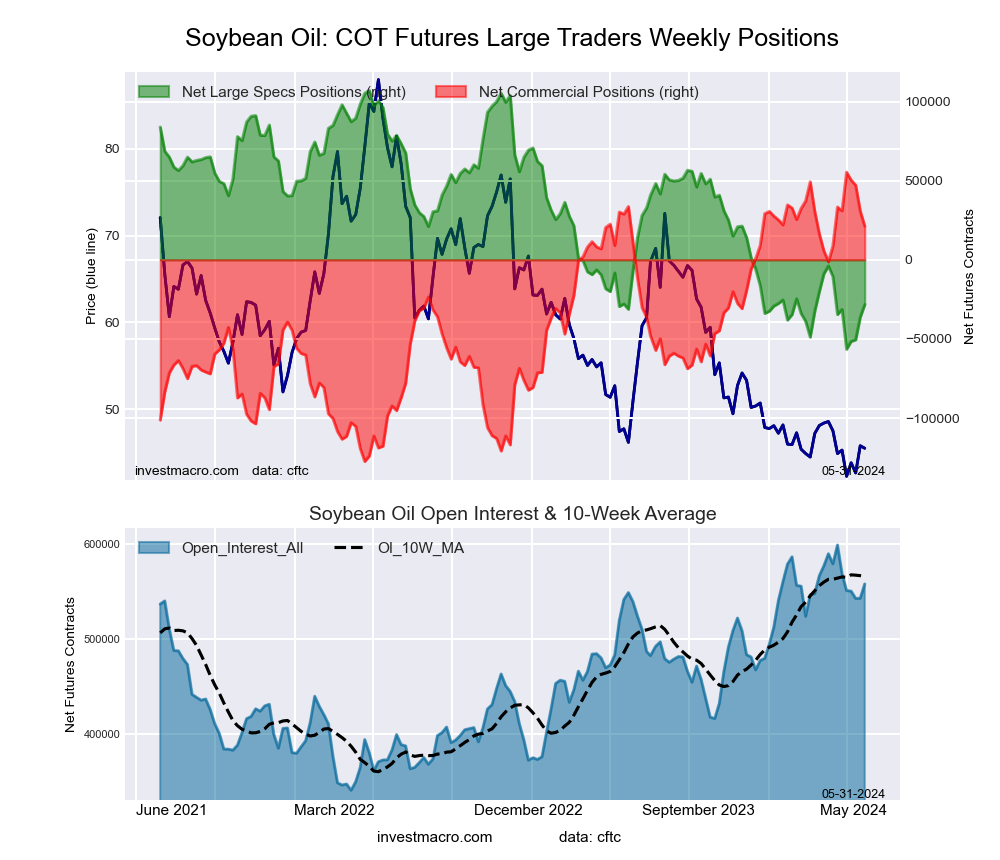 The SOYBEAN OIL large speculator standing this week was a net position of -28,264 contracts in the data reported through Tuesday. This was a weekly lift of 8,014 contracts from the previous week which had a total of -36,278 net contracts.
This week’s current strength score (the trader positioning range over the past three years, measured from 0 to 100) shows the speculators are currently Bearish-Extreme with a score of 17.2 percent. The commercials are Bullish-Extreme with a score of 81.3 percent and the small traders (not shown in chart) are Bearish with a score of 41.2 percent.
Price Trend-Following Model: Downtrend
Our weekly trend-following model classifies the current market price position as: Downtrend. The current action for the model is considered to be: Hold – Maintain Short Position.
| SOYBEAN OIL Futures Statistics | SPECULATORS | COMMERCIALS | SMALL TRADERS |
| – Percent of Open Interest Longs: | 20.2 | 53.9 | 5.7 |
| – Percent of Open Interest Shorts: | 25.2 | 50.1 | 4.5 |
| – Net Position: | -28,264 | 21,264 | 7,000 |
| – Gross Longs: | 112,590 | 300,740 | 31,971 |
| – Gross Shorts: | 140,854 | 279,476 | 24,971 |
| – Long to Short Ratio: | 0.8 to 1 | 1.1 to 1 | 1.3 to 1 |
| NET POSITION TREND: | |||
| – Strength Index Score (3 Year Range Pct): | 17.2 | 81.3 | 41.2 |
| – Strength Index Reading (3 Year Range): | Bearish-Extreme | Bullish-Extreme | Bearish |
| NET POSITION MOVEMENT INDEX: | |||
| – 6-Week Change in Strength Index: | 3.8 | -6.6 | 22.4 |
SOYBEAN MEAL Futures:
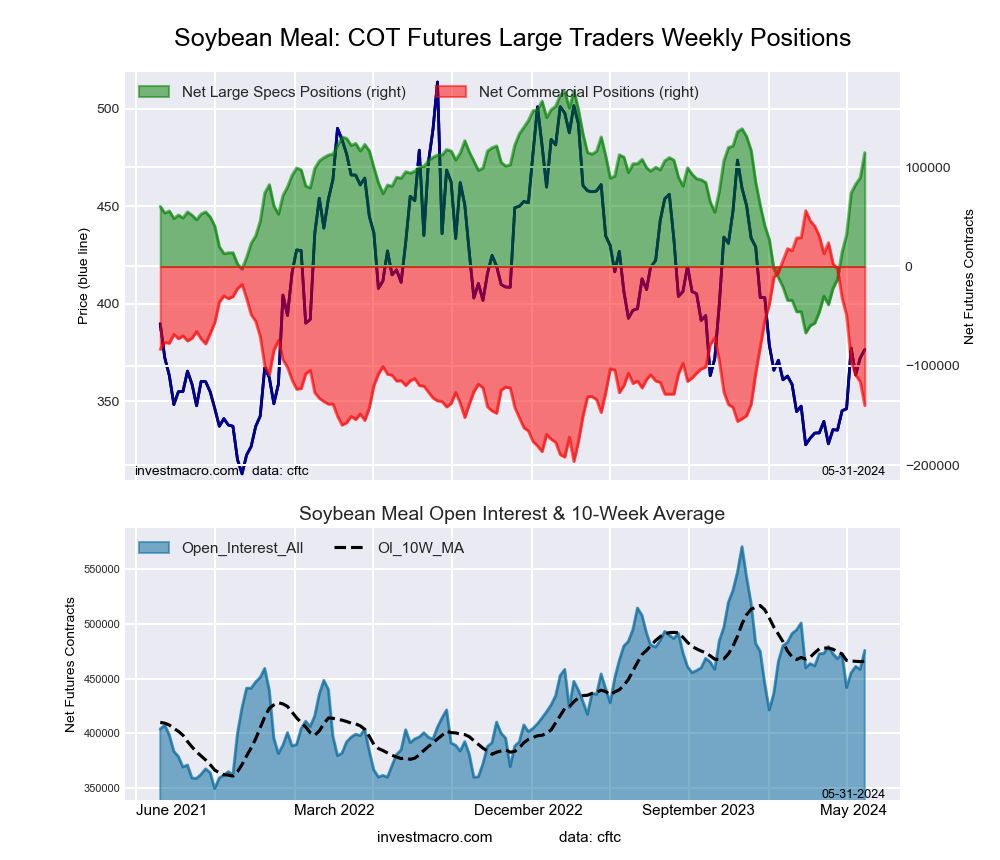 The SOYBEAN MEAL large speculator standing this week was a net position of 114,521 contracts in the data reported through Tuesday. This was a weekly advance of 25,247 contracts from the previous week which had a total of 89,274 net contracts.
This week’s current strength score (the trader positioning range over the past three years, measured from 0 to 100) shows the speculators are currently Bullish with a score of 74.4 percent. The commercials are Bearish with a score of 22.3 percent and the small traders (not shown in chart) are Bullish with a score of 69.5 percent.
Price Trend-Following Model: Strong Uptrend
Our weekly trend-following model classifies the current market price position as: Strong Uptrend. The current action for the model is considered to be: Hold – Maintain Long Position.
| SOYBEAN MEAL Futures Statistics | SPECULATORS | COMMERCIALS | SMALL TRADERS |
| – Percent of Open Interest Longs: | 35.2 | 35.8 | 10.7 |
| – Percent of Open Interest Shorts: | 11.1 | 65.2 | 5.4 |
| – Net Position: | 114,521 | -139,803 | 25,282 |
| – Gross Longs: | 167,296 | 170,310 | 50,943 |
| – Gross Shorts: | 52,775 | 310,113 | 25,661 |
| – Long to Short Ratio: | 3.2 to 1 | 0.5 to 1 | 2.0 to 1 |
| NET POSITION TREND: | |||
| – Strength Index Score (3 Year Range Pct): | 74.4 | 22.3 | 69.5 |
| – Strength Index Reading (3 Year Range): | Bullish | Bearish | Bullish |
| NET POSITION MOVEMENT INDEX: | |||
| – 6-Week Change in Strength Index: | 52.2 | -54.5 | 45.6 |
LIVE CATTLE Futures:
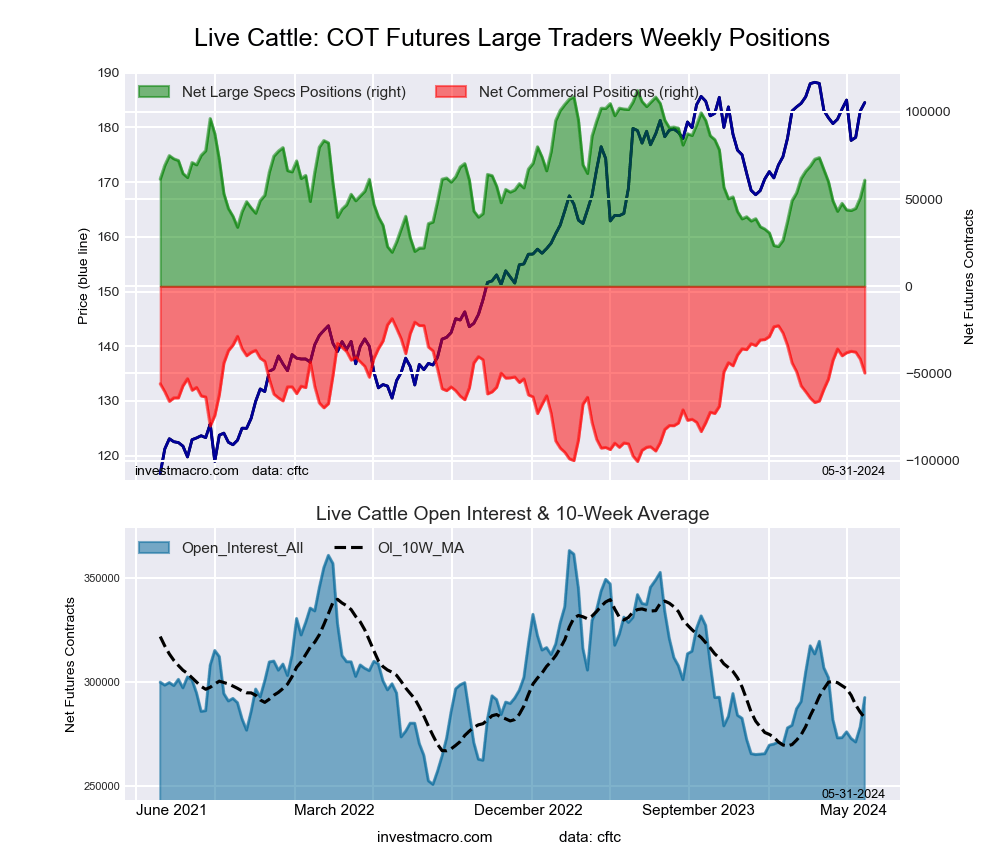 The LIVE CATTLE large speculator standing this week was a net position of 60,855 contracts in the data reported through Tuesday. This was a weekly advance of 10,199 contracts from the previous week which had a total of 50,656 net contracts.
This week’s current strength score (the trader positioning range over the past three years, measured from 0 to 100) shows the speculators are currently Bearish with a score of 44.6 percent. The commercials are Bullish with a score of 61.9 percent and the small traders (not shown in chart) are Bearish with a score of 30.5 percent.
Price Trend-Following Model: Uptrend
Our weekly trend-following model classifies the current market price position as: Uptrend. The current action for the model is considered to be: Hold – Maintain Long Position.
| LIVE CATTLE Futures Statistics | SPECULATORS | COMMERCIALS | SMALL TRADERS |
| – Percent of Open Interest Longs: | 40.8 | 32.8 | 9.2 |
| – Percent of Open Interest Shorts: | 20.0 | 49.8 | 13.0 |
| – Net Position: | 60,855 | -49,742 | -11,113 |
| – Gross Longs: | 119,356 | 95,952 | 26,865 |
| – Gross Shorts: | 58,501 | 145,694 | 37,978 |
| – Long to Short Ratio: | 2.0 to 1 | 0.7 to 1 | 0.7 to 1 |
| NET POSITION TREND: | |||
| – Strength Index Score (3 Year Range Pct): | 44.6 | 61.9 | 30.5 |
| – Strength Index Reading (3 Year Range): | Bearish | Bullish | Bearish |
| NET POSITION MOVEMENT INDEX: | |||
| – 6-Week Change in Strength Index: | 19.2 | -16.8 | -21.7 |
LEAN HOGS Futures:
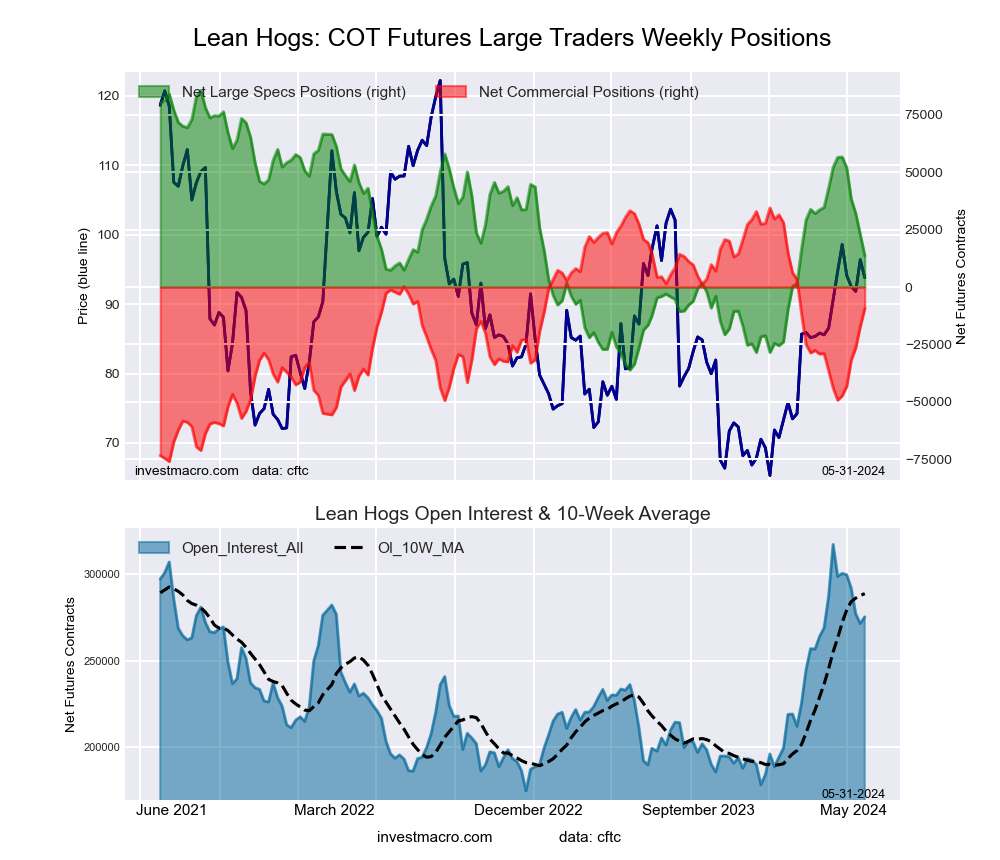 The LEAN HOGS large speculator standing this week was a net position of 13,662 contracts in the data reported through Tuesday. This was a weekly fall of -9,200 contracts from the previous week which had a total of 22,862 net contracts.
This week’s current strength score (the trader positioning range over the past three years, measured from 0 to 100) shows the speculators are currently Bearish with a score of 40.9 percent. The commercials are Bullish with a score of 60.4 percent and the small traders (not shown in chart) are Bullish with a score of 63.8 percent.
Price Trend-Following Model: Uptrend
Our weekly trend-following model classifies the current market price position as: Uptrend. The current action for the model is considered to be: Hold – Maintain Long Position.
| LEAN HOGS Futures Statistics | SPECULATORS | COMMERCIALS | SMALL TRADERS |
| – Percent of Open Interest Longs: | 29.8 | 39.3 | 7.8 |
| – Percent of Open Interest Shorts: | 24.8 | 42.7 | 9.4 |
| – Net Position: | 13,662 | -9,301 | -4,361 |
| – Gross Longs: | 81,944 | 108,350 | 21,540 |
| – Gross Shorts: | 68,282 | 117,651 | 25,901 |
| – Long to Short Ratio: | 1.2 to 1 | 0.9 to 1 | 0.8 to 1 |
| NET POSITION TREND: | |||
| – Strength Index Score (3 Year Range Pct): | 40.9 | 60.4 | 63.8 |
| – Strength Index Reading (3 Year Range): | Bearish | Bullish | Bullish |
| NET POSITION MOVEMENT INDEX: | |||
| – 6-Week Change in Strength Index: | -35.2 | 36.2 | 12.9 |
COTTON Futures:
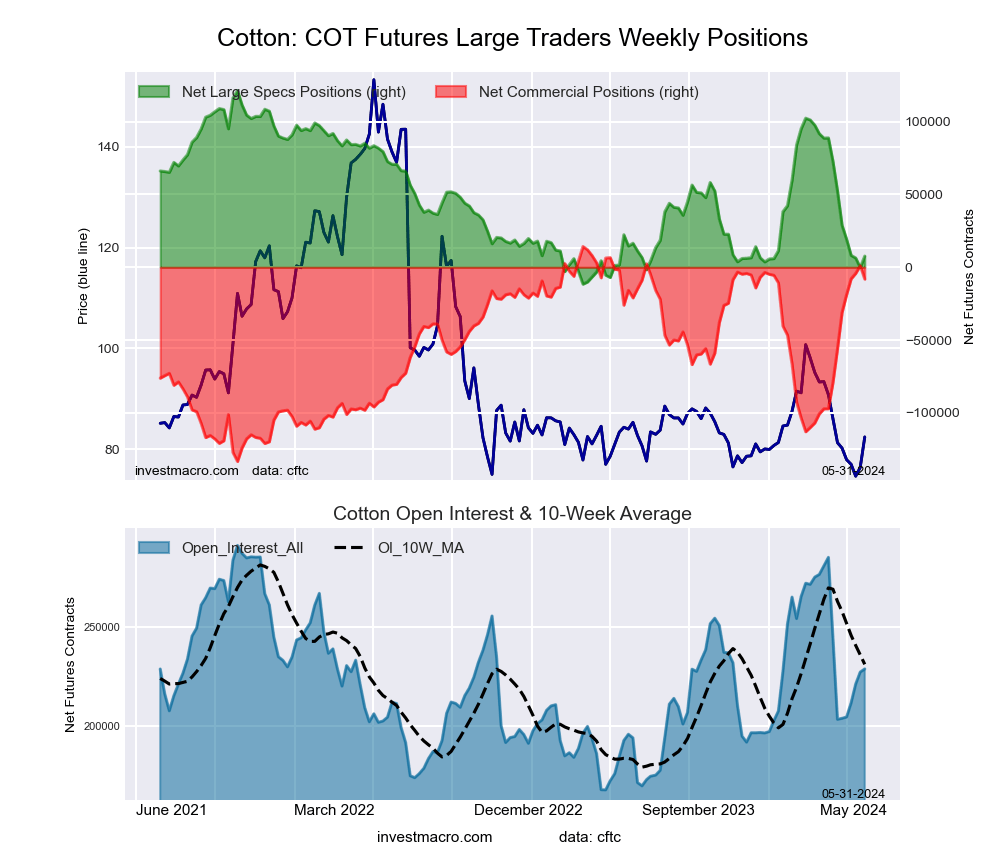 The COTTON large speculator standing this week was a net position of 7,678 contracts in the data reported through Tuesday. This was a weekly rise of 7,870 contracts from the previous week which had a total of -192 net contracts.
This week’s current strength score (the trader positioning range over the past three years, measured from 0 to 100) shows the speculators are currently Bearish-Extreme with a score of 14.5 percent. The commercials are Bullish-Extreme with a score of 84.8 percent and the small traders (not shown in chart) are Bearish-Extreme with a score of 18.8 percent.
Price Trend-Following Model: Strong Downtrend
Our weekly trend-following model classifies the current market price position as: Strong Downtrend. The current action for the model is considered to be: Hold – Maintain Short Position.
| COTTON Futures Statistics | SPECULATORS | COMMERCIALS | SMALL TRADERS |
| – Percent of Open Interest Longs: | 30.7 | 44.8 | 5.4 |
| – Percent of Open Interest Shorts: | 27.4 | 48.4 | 5.2 |
| – Net Position: | 7,678 | -8,136 | 458 |
| – Gross Longs: | 70,382 | 102,573 | 12,272 |
| – Gross Shorts: | 62,704 | 110,709 | 11,814 |
| – Long to Short Ratio: | 1.1 to 1 | 0.9 to 1 | 1.0 to 1 |
| NET POSITION TREND: | |||
| – Strength Index Score (3 Year Range Pct): | 14.5 | 84.8 | 18.8 |
| – Strength Index Reading (3 Year Range): | Bearish-Extreme | Bullish-Extreme | Bearish-Extreme |
| NET POSITION MOVEMENT INDEX: | |||
| – 6-Week Change in Strength Index: | -33.6 | 32.4 | -19.1 |
COCOA Futures:
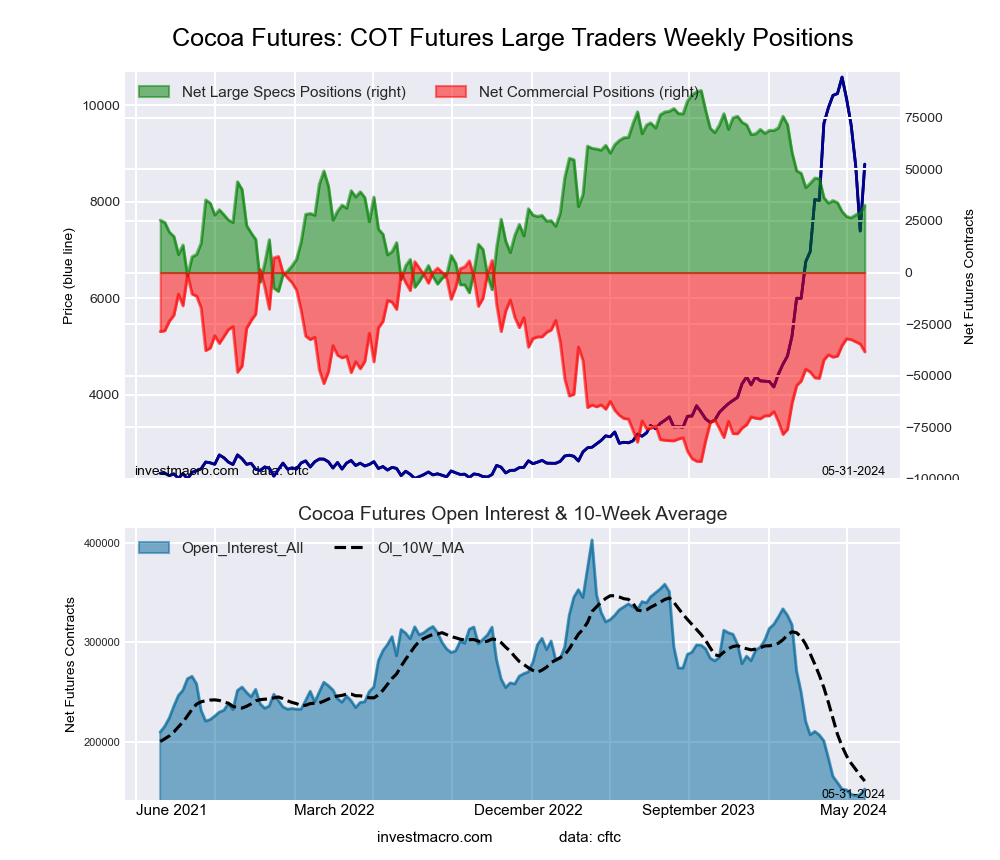 The COCOA large speculator standing this week was a net position of 32,570 contracts in the data reported through Tuesday. This was a weekly gain of 3,679 contracts from the previous week which had a total of 28,891 net contracts.
This week’s current strength score (the trader positioning range over the past three years, measured from 0 to 100) shows the speculators are currently Bearish with a score of 43.2 percent. The commercials are Bullish with a score of 53.5 percent and the small traders (not shown in chart) are Bullish with a score of 62.1 percent.
Price Trend-Following Model: Uptrend
Our weekly trend-following model classifies the current market price position as: Uptrend. The current action for the model is considered to be: Hold – Maintain Long Position.
| COCOA Futures Statistics | SPECULATORS | COMMERCIALS | SMALL TRADERS |
| – Percent of Open Interest Longs: | 31.7 | 34.6 | 7.5 |
| – Percent of Open Interest Shorts: | 10.4 | 59.7 | 3.7 |
| – Net Position: | 32,570 | -38,425 | 5,855 |
| – Gross Longs: | 48,416 | 52,941 | 11,504 |
| – Gross Shorts: | 15,846 | 91,366 | 5,649 |
| – Long to Short Ratio: | 3.1 to 1 | 0.6 to 1 | 2.0 to 1 |
| NET POSITION TREND: | |||
| – Strength Index Score (3 Year Range Pct): | 43.2 | 53.5 | 62.1 |
| – Strength Index Reading (3 Year Range): | Bearish | Bullish | Bullish |
| NET POSITION MOVEMENT INDEX: | |||
| – 6-Week Change in Strength Index: | -1.3 | 2.1 | -6.8 |
WHEAT Futures:
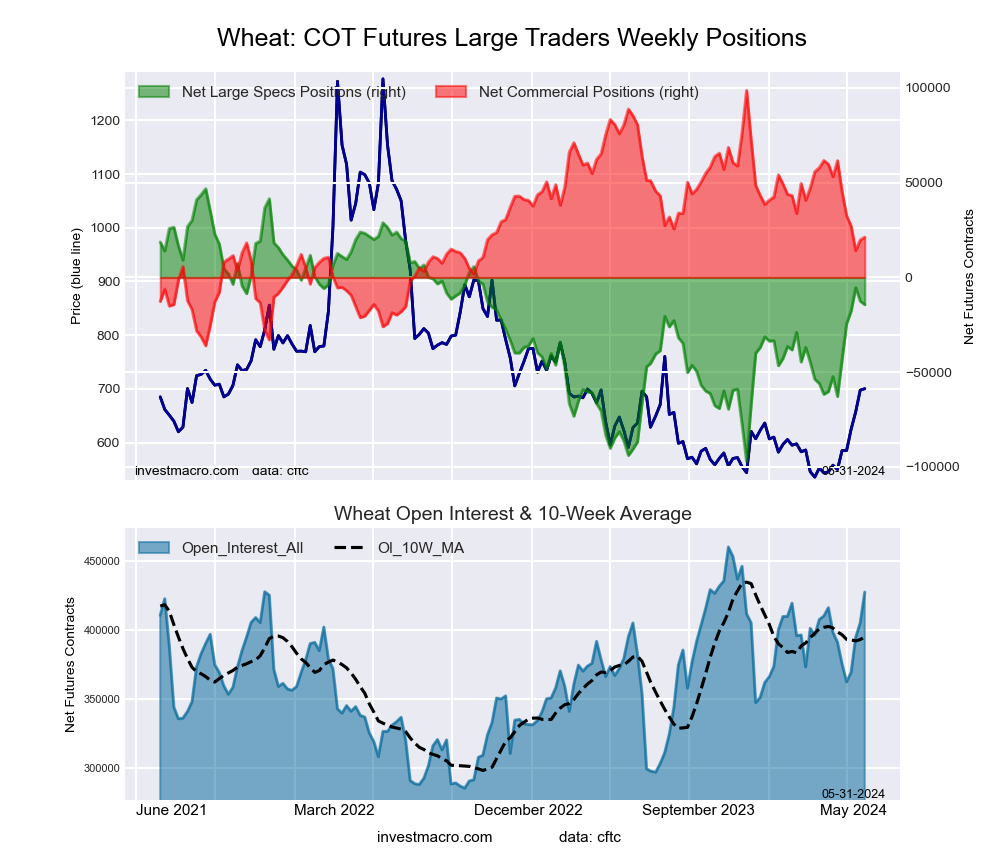 The WHEAT large speculator standing this week was a net position of -14,393 contracts in the data reported through Tuesday. This was a weekly fall of -1,871 contracts from the previous week which had a total of -12,522 net contracts.
This week’s current strength score (the trader positioning range over the past three years, measured from 0 to 100) shows the speculators are currently Bullish with a score of 57.5 percent. The commercials are Bearish with a score of 42.5 percent and the small traders (not shown in chart) are Bearish with a score of 36.5 percent.
Price Trend-Following Model: Strong Uptrend
Our weekly trend-following model classifies the current market price position as: Strong Uptrend. The current action for the model is considered to be: Hold – Maintain Long Position.
| WHEAT Futures Statistics | SPECULATORS | COMMERCIALS | SMALL TRADERS |
| – Percent of Open Interest Longs: | 29.8 | 36.1 | 7.6 |
| – Percent of Open Interest Shorts: | 33.2 | 31.1 | 9.2 |
| – Net Position: | -14,393 | 21,208 | -6,815 |
| – Gross Longs: | 127,585 | 154,247 | 32,381 |
| – Gross Shorts: | 141,978 | 133,039 | 39,196 |
| – Long to Short Ratio: | 0.9 to 1 | 1.2 to 1 | 0.8 to 1 |
| NET POSITION TREND: | |||
| – Strength Index Score (3 Year Range Pct): | 57.5 | 42.5 | 36.5 |
| – Strength Index Reading (3 Year Range): | Bullish | Bearish | Bearish |
| NET POSITION MOVEMENT INDEX: | |||
| – 6-Week Change in Strength Index: | 33.7 | -30.0 | -35.3 |
Article By InvestMacro – Receive our weekly COT Newsletter
*COT Report: The COT data, released weekly to the public each Friday, is updated through the most recent Tuesday (data is 3 days old) and shows a quick view of how large speculators or non-commercials (for-profit traders) were positioned in the futures markets.
The CFTC categorizes trader positions according to commercial hedgers (traders who use futures contracts for hedging as part of the business), non-commercials (large traders who speculate to realize trading profits) and nonreportable traders (usually small traders/speculators) as well as their open interest (contracts open in the market at time of reporting). See CFTC criteria here.