
By InvestMacro
Here are the latest charts and statistics for the Commitment of Traders (COT) data published by the Commodities Futures Trading Commission (CFTC).
The latest COT data is updated through Tuesday April 30th and shows a quick view of how large traders (for-profit speculators and commercial entities) were positioned in the futures markets.
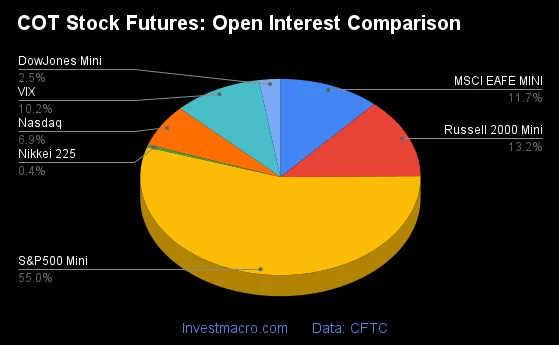
Weekly Speculator bets led lower by S&P500 & MSCI EAFE
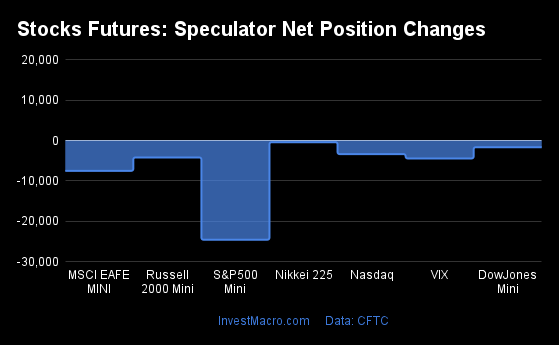
The COT stock markets speculator bets were lower this week as all of the seven stock markets we cover had lower speculator net contract positions.
Free Reports:
 Get our Weekly Commitment of Traders Reports - See where the biggest traders (Hedge Funds and Commercial Hedgers) are positioned in the futures markets on a weekly basis.
 Download Our Metatrader 4 Indicators – Put Our Free MetaTrader 4 Custom Indicators on your charts when you join our Weekly Newsletter
Leading the declines for the stock markets was the S&P500-Mini (-24,545 contracts), the MSCI EAFE-Mini (-7,498 contracts), the VIX (-4,433 contracts), the Russell-Mini (-4,189 contracts), Nasdaq-Mini (-3,353 contracts), the DowJones-Mini (-1,654 contracts) and with the Nikkei 225 (-407 contracts) also registering lower bets on the week.
Stock Market Net Speculators Leaderboard
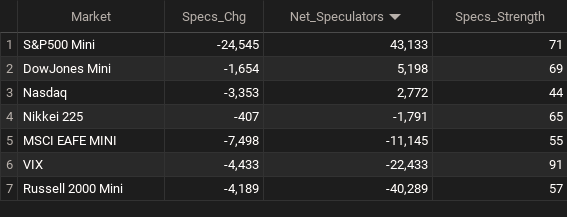
Legend: Weekly Speculators Change | Speculators Current Net Position | Speculators Strength Score compared to last 3-Years (0-100 range)
Strength Scores led by VIX & S&P500-Mini
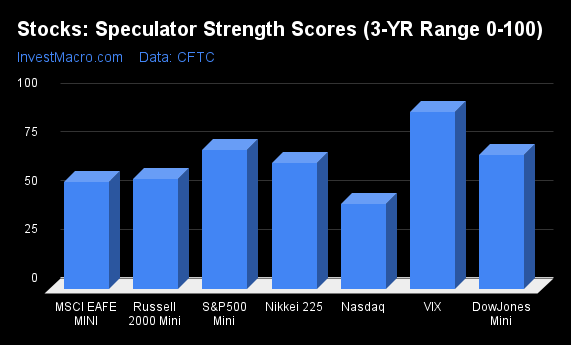
COT Strength Scores (a normalized measure of Speculator positions over a 3-Year range, from 0 to 100 where above 80 is Extreme-Bullish and below 20 is Extreme-Bearish) showed that the VIX (91 percent) and the S&P500-Mini (71 percent) lead the stock markets this week. The DowJones-Mini (69 percent) and Nikkei 225 (65 percent) come in as the next highest in the weekly strength scores.
On the downside, the Nasdaq-Mini (43 percent) comes in at the lowest strength level currently.
Strength Statistics:
VIX (90.8 percent) vs VIX previous week (95.6 percent)
S&P500-Mini (71.2 percent) vs S&P500-Mini previous week (74.8 percent)
DowJones-Mini (68.8 percent) vs DowJones-Mini previous week (71.4 percent)
Nasdaq-Mini (43.5 percent) vs Nasdaq-Mini previous week (48.7 percent)
Russell2000-Mini (56.5 percent) vs Russell2000-Mini previous week (59.5 percent)
Nikkei USD (64.9 percent) vs Nikkei USD previous week (68.4 percent)
EAFE-Mini (54.9 percent) vs EAFE-Mini previous week (62.6 percent)
S&P500-Mini & VIX top the 6-Week Strength Trends
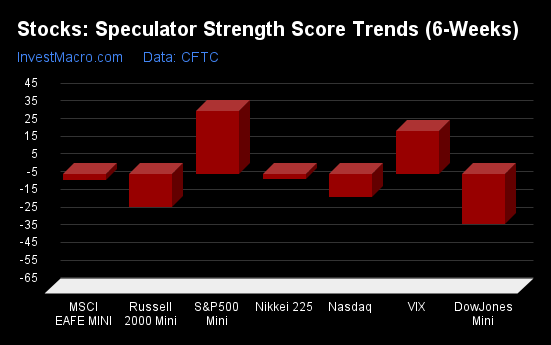
COT Strength Score Trends (or move index, calculates the 6-week changes in strength scores) showed that the S&P500-Mini (35 percent) leads the past six weeks trends for the stock markets. The VIX (24 percent) is the next highest positive mover in the latest trends data.
The DowJones-Mini (-28 percent) leads the downside trend scores currently with the Russell-Mini (-19 percent) coming in as the next market with lower trend scores.
Strength Trend Statistics:
VIX (24.2 percent) vs VIX previous week (33.7 percent)
S&P500-Mini (35.4 percent) vs S&P500-Mini previous week (45.9 percent)
DowJones-Mini (-28.1 percent) vs DowJones-Mini previous week (-14.3 percent)
Nasdaq-Mini (-13.0 percent) vs Nasdaq-Mini previous week (7.3 percent)
Russell2000-Mini (-19.0 percent) vs Russell2000-Mini previous week (-12.1 percent)
Nikkei USD (-3.2 percent) vs Nikkei USD previous week (10.3 percent)
EAFE-Mini (-3.6 percent) vs EAFE-Mini previous week (17.9 percent)
Individual Stock Market Charts:
VIX Volatility Futures:
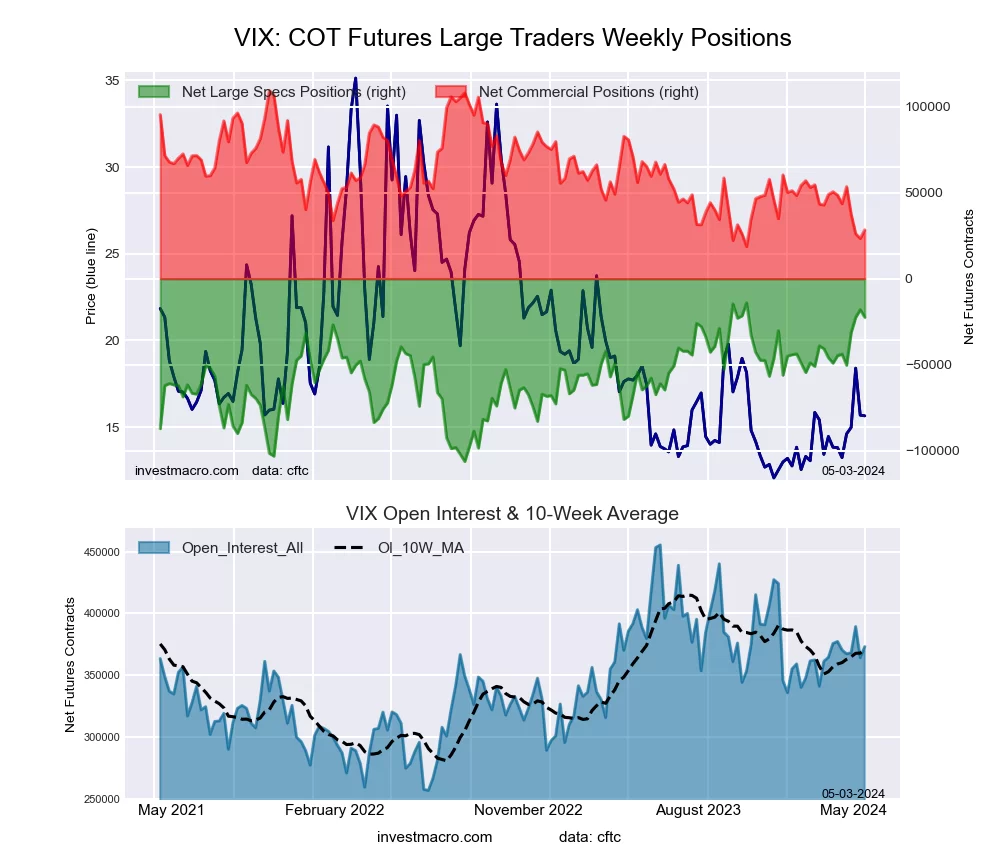 The VIX Volatility large speculator standing this week equaled a net position of -22,433 contracts in the data reported through Tuesday. This was a weekly reduction of -4,433 contracts from the previous week which had a total of -18,000 net contracts.
This week’s current strength score (the trader positioning range over the past three years, measured from 0 to 100) shows the speculators are currently Bullish-Extreme with a score of 90.8 percent. The commercials are Bearish-Extreme with a score of 10.7 percent and the small traders (not shown in chart) are Bullish with a score of 65.8 percent.
Price Trend-Following Model: Uptrend
Our weekly trend-following model classifies the current market price position as: Uptrend. The current action for the model is considered to be: Hold – Maintain Long Position.
| VIX Volatility Futures Statistics | SPECULATORS | COMMERCIALS | SMALL TRADERS |
| – Percent of Open Interest Longs: | 24.6 | 40.9 | 7.0 |
| – Percent of Open Interest Shorts: | 30.6 | 33.3 | 8.6 |
| – Net Position: | -22,433 | 28,429 | -5,996 |
| – Gross Longs: | 91,655 | 152,812 | 26,276 |
| – Gross Shorts: | 114,088 | 124,383 | 32,272 |
| – Long to Short Ratio: | 0.8 to 1 | 1.2 to 1 | 0.8 to 1 |
| NET POSITION TREND: | |||
| – Strength Index Score (3 Year Range Pct): | 90.8 | 10.7 | 65.8 |
| – Strength Index Reading (3 Year Range): | Bullish-Extreme | Bearish-Extreme | Bullish |
| NET POSITION MOVEMENT INDEX: | |||
| – 6-Week Change in Strength Index: | 24.2 | -22.3 | -10.9 |
S&P500 Mini Futures:
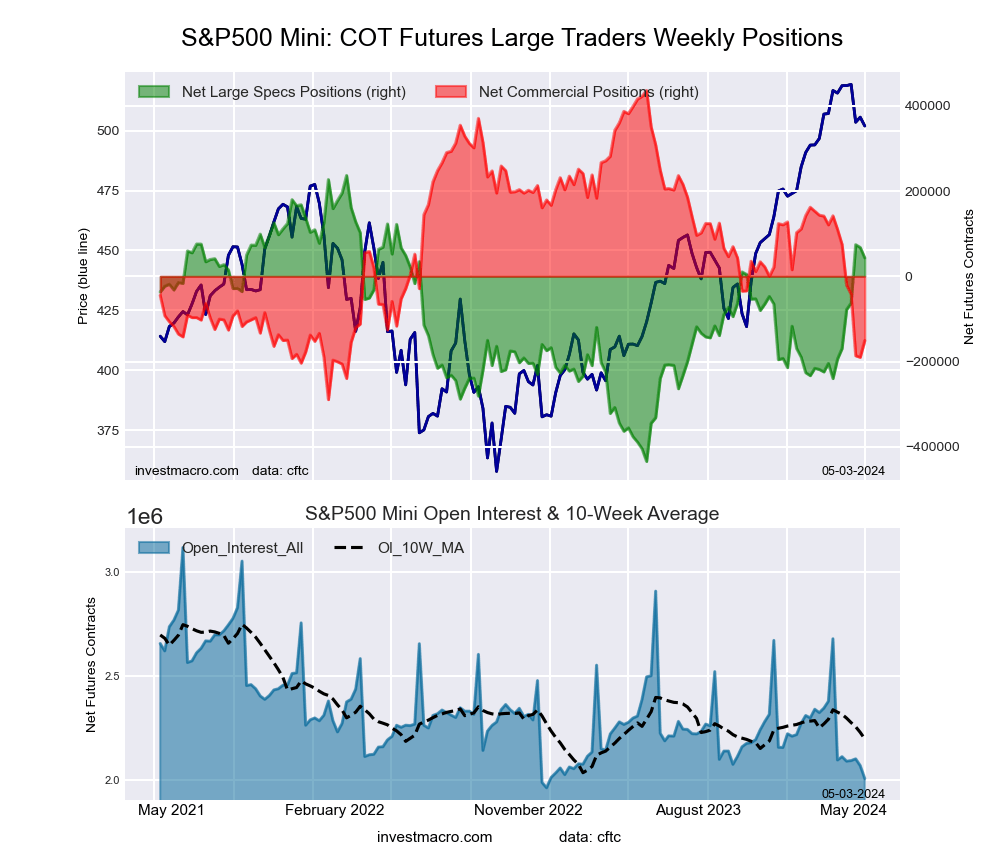 The S&P500 Mini large speculator standing this week equaled a net position of 43,133 contracts in the data reported through Tuesday. This was a weekly lowering of -24,545 contracts from the previous week which had a total of 67,678 net contracts.
This week’s current strength score (the trader positioning range over the past three years, measured from 0 to 100) shows the speculators are currently Bullish with a score of 71.2 percent. The commercials are Bearish-Extreme with a score of 19.1 percent and the small traders (not shown in chart) are Bullish with a score of 79.8 percent.
Price Trend-Following Model: Uptrend
Our weekly trend-following model classifies the current market price position as: Uptrend. The current action for the model is considered to be: Hold – Maintain Long Position.
| S&P500 Mini Futures Statistics | SPECULATORS | COMMERCIALS | SMALL TRADERS |
| – Percent of Open Interest Longs: | 13.6 | 69.4 | 13.9 |
| – Percent of Open Interest Shorts: | 11.4 | 76.9 | 8.6 |
| – Net Position: | 43,133 | -150,593 | 107,460 |
| – Gross Longs: | 272,813 | 1,392,147 | 279,080 |
| – Gross Shorts: | 229,680 | 1,542,740 | 171,620 |
| – Long to Short Ratio: | 1.2 to 1 | 0.9 to 1 | 1.6 to 1 |
| NET POSITION TREND: | |||
| – Strength Index Score (3 Year Range Pct): | 71.2 | 19.1 | 79.8 |
| – Strength Index Reading (3 Year Range): | Bullish | Bearish-Extreme | Bullish |
| NET POSITION MOVEMENT INDEX: | |||
| – 6-Week Change in Strength Index: | 35.4 | -36.0 | 9.3 |
Dow Jones Mini Futures:
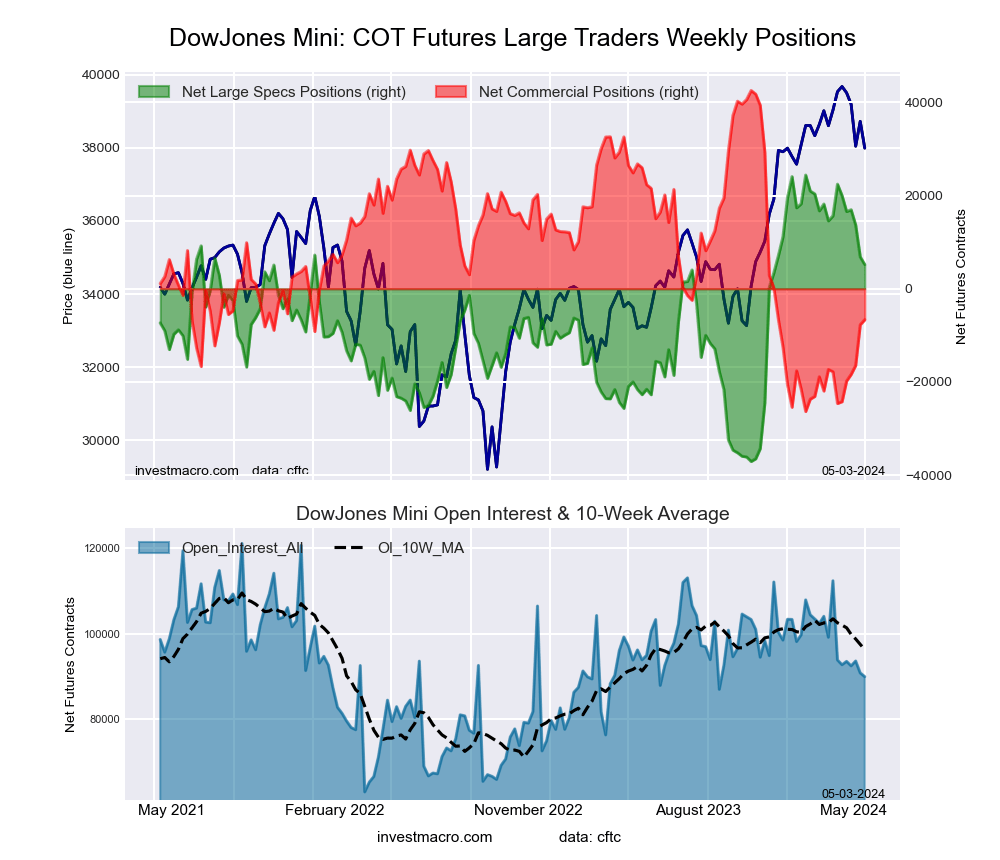 The Dow Jones Mini large speculator standing this week equaled a net position of 5,198 contracts in the data reported through Tuesday. This was a weekly reduction of -1,654 contracts from the previous week which had a total of 6,852 net contracts.
This week’s current strength score (the trader positioning range over the past three years, measured from 0 to 100) shows the speculators are currently Bullish with a score of 68.8 percent. The commercials are Bearish with a score of 28.6 percent and the small traders (not shown in chart) are Bullish with a score of 50.9 percent.
Price Trend-Following Model: Weak Uptrend
Our weekly trend-following model classifies the current market price position as: Weak Uptrend. The current action for the model is considered to be: Hold – Maintain Long Position.
| Dow Jones Mini Futures Statistics | SPECULATORS | COMMERCIALS | SMALL TRADERS |
| – Percent of Open Interest Longs: | 19.9 | 63.3 | 14.4 |
| – Percent of Open Interest Shorts: | 14.1 | 70.7 | 12.8 |
| – Net Position: | 5,198 | -6,639 | 1,441 |
| – Gross Longs: | 17,883 | 56,959 | 12,944 |
| – Gross Shorts: | 12,685 | 63,598 | 11,503 |
| – Long to Short Ratio: | 1.4 to 1 | 0.9 to 1 | 1.1 to 1 |
| NET POSITION TREND: | |||
| – Strength Index Score (3 Year Range Pct): | 68.8 | 28.6 | 50.9 |
| – Strength Index Reading (3 Year Range): | Bullish | Bearish | Bullish |
| NET POSITION MOVEMENT INDEX: | |||
| – 6-Week Change in Strength Index: | -28.1 | 26.1 | -3.6 |
Nasdaq Mini Futures:
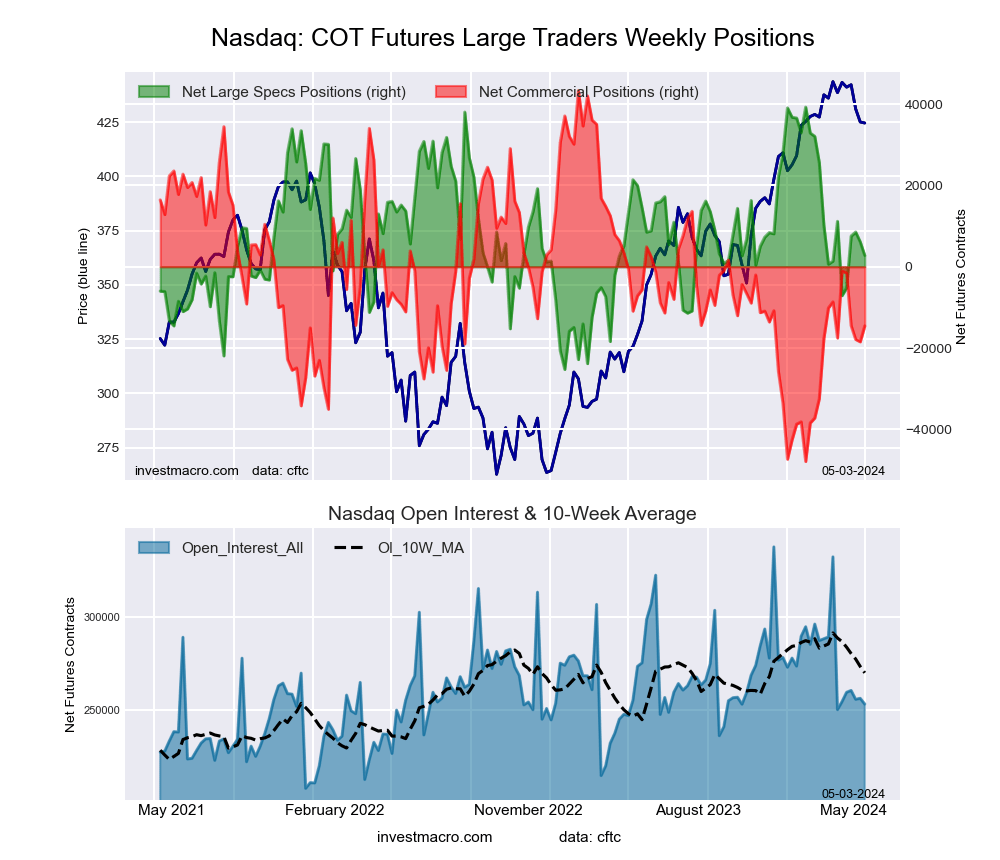 The Nasdaq Mini large speculator standing this week equaled a net position of 2,772 contracts in the data reported through Tuesday. This was a weekly decrease of -3,353 contracts from the previous week which had a total of 6,125 net contracts.
This week’s current strength score (the trader positioning range over the past three years, measured from 0 to 100) shows the speculators are currently Bearish with a score of 43.5 percent. The commercials are Bearish with a score of 36.5 percent and the small traders (not shown in chart) are Bullish-Extreme with a score of 98.6 percent.
Price Trend-Following Model: Uptrend
Our weekly trend-following model classifies the current market price position as: Uptrend. The current action for the model is considered to be: Hold – Maintain Long Position.
| Nasdaq Mini Futures Statistics | SPECULATORS | COMMERCIALS | SMALL TRADERS |
| – Percent of Open Interest Longs: | 23.8 | 55.1 | 17.6 |
| – Percent of Open Interest Shorts: | 22.7 | 60.8 | 13.0 |
| – Net Position: | 2,772 | -14,557 | 11,785 |
| – Gross Longs: | 60,312 | 139,475 | 44,588 |
| – Gross Shorts: | 57,540 | 154,032 | 32,803 |
| – Long to Short Ratio: | 1.0 to 1 | 0.9 to 1 | 1.4 to 1 |
| NET POSITION TREND: | |||
| – Strength Index Score (3 Year Range Pct): | 43.5 | 36.5 | 98.6 |
| – Strength Index Reading (3 Year Range): | Bearish | Bearish | Bullish-Extreme |
| NET POSITION MOVEMENT INDEX: | |||
| – 6-Week Change in Strength Index: | -13.0 | 3.3 | 13.2 |
Russell 2000 Mini Futures:
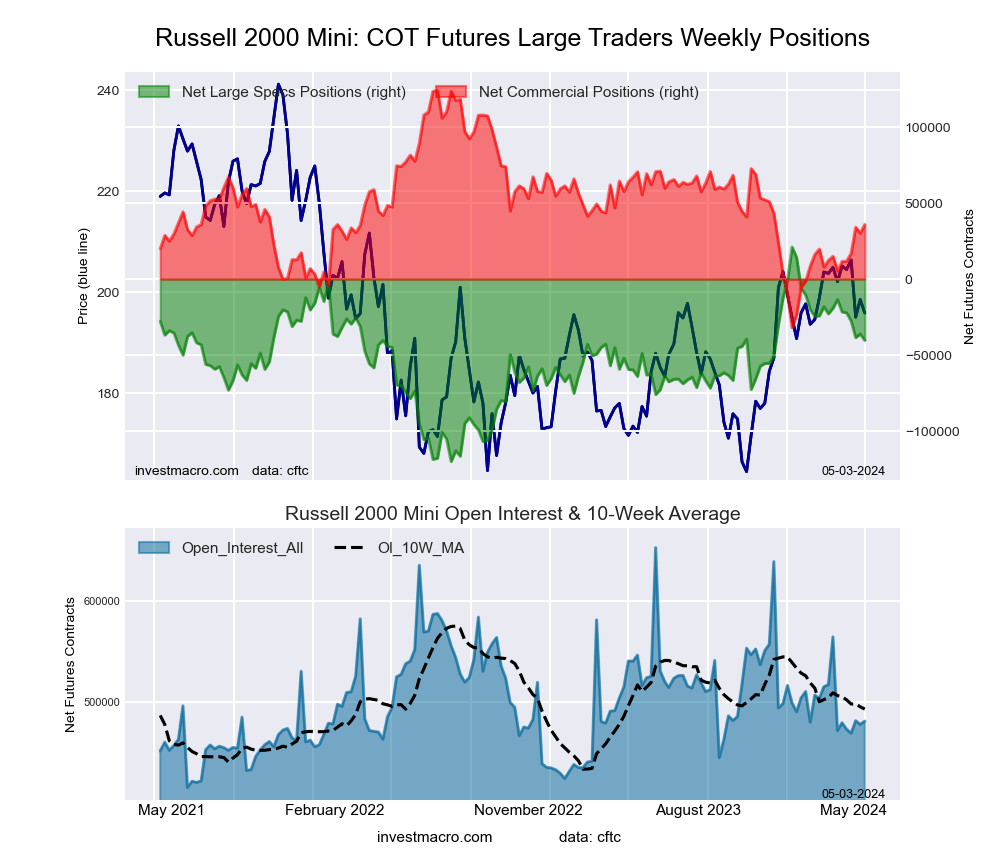 The Russell 2000 Mini large speculator standing this week equaled a net position of -40,289 contracts in the data reported through Tuesday. This was a weekly fall of -4,189 contracts from the previous week which had a total of -36,100 net contracts.
This week’s current strength score (the trader positioning range over the past three years, measured from 0 to 100) shows the speculators are currently Bullish with a score of 56.5 percent. The commercials are Bearish with a score of 43.5 percent and the small traders (not shown in chart) are Bearish with a score of 43.8 percent.
Price Trend-Following Model: Uptrend
Our weekly trend-following model classifies the current market price position as: Uptrend. The current action for the model is considered to be: Hold – Maintain Long Position.
| Russell 2000 Mini Futures Statistics | SPECULATORS | COMMERCIALS | SMALL TRADERS |
| – Percent of Open Interest Longs: | 14.6 | 77.4 | 5.6 |
| – Percent of Open Interest Shorts: | 23.0 | 70.0 | 4.6 |
| – Net Position: | -40,289 | 35,892 | 4,397 |
| – Gross Longs: | 70,255 | 372,284 | 26,725 |
| – Gross Shorts: | 110,544 | 336,392 | 22,328 |
| – Long to Short Ratio: | 0.6 to 1 | 1.1 to 1 | 1.2 to 1 |
| NET POSITION TREND: | |||
| – Strength Index Score (3 Year Range Pct): | 56.5 | 43.5 | 43.8 |
| – Strength Index Reading (3 Year Range): | Bullish | Bearish | Bearish |
| NET POSITION MOVEMENT INDEX: | |||
| – 6-Week Change in Strength Index: | -19.0 | 19.6 | -12.9 |
Nikkei Stock Average (USD) Futures:
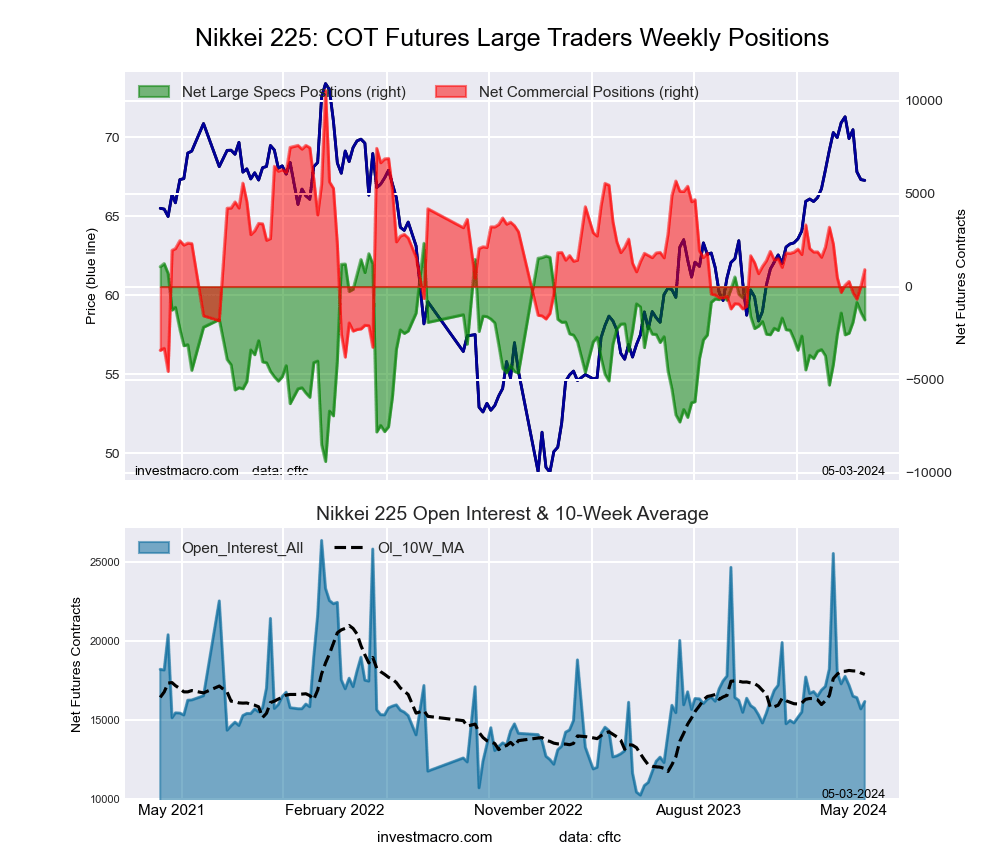 The Nikkei Stock Average (USD) large speculator standing this week equaled a net position of -1,791 contracts in the data reported through Tuesday. This was a weekly decrease of -407 contracts from the previous week which had a total of -1,384 net contracts.
This week’s current strength score (the trader positioning range over the past three years, measured from 0 to 100) shows the speculators are currently Bullish with a score of 64.9 percent. The commercials are Bearish with a score of 36.2 percent and the small traders (not shown in chart) are Bullish with a score of 51.4 percent.
Price Trend-Following Model: Uptrend
Our weekly trend-following model classifies the current market price position as: Uptrend. The current action for the model is considered to be: Hold – Maintain Long Position.
| Nikkei Stock Average Futures Statistics | SPECULATORS | COMMERCIALS | SMALL TRADERS |
| – Percent of Open Interest Longs: | 7.2 | 71.2 | 21.6 |
| – Percent of Open Interest Shorts: | 18.3 | 65.6 | 16.1 |
| – Net Position: | -1,791 | 909 | 882 |
| – Gross Longs: | 1,161 | 11,519 | 3,490 |
| – Gross Shorts: | 2,952 | 10,610 | 2,608 |
| – Long to Short Ratio: | 0.4 to 1 | 1.1 to 1 | 1.3 to 1 |
| NET POSITION TREND: | |||
| – Strength Index Score (3 Year Range Pct): | 64.9 | 36.2 | 51.4 |
| – Strength Index Reading (3 Year Range): | Bullish | Bearish | Bullish |
| NET POSITION MOVEMENT INDEX: | |||
| – 6-Week Change in Strength Index: | -3.2 | 8.1 | -13.9 |
MSCI EAFE Mini Futures:
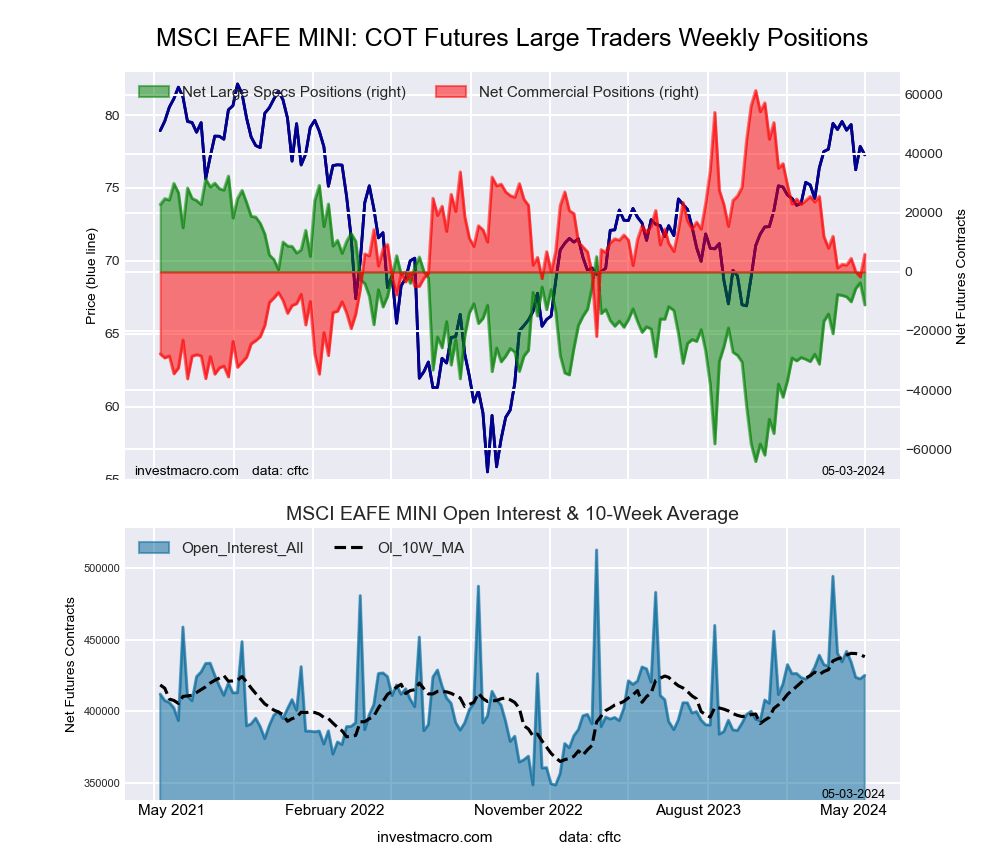 The MSCI EAFE Mini large speculator standing this week equaled a net position of -11,145 contracts in the data reported through Tuesday. This was a weekly lowering of -7,498 contracts from the previous week which had a total of -3,647 net contracts.
This week’s current strength score (the trader positioning range over the past three years, measured from 0 to 100) shows the speculators are currently Bullish with a score of 54.9 percent. The commercials are Bearish with a score of 43.2 percent and the small traders (not shown in chart) are Bearish with a score of 42.7 percent.
Price Trend-Following Model: Uptrend
Our weekly trend-following model classifies the current market price position as: Uptrend. The current action for the model is considered to be: Hold – Maintain Long Position.
| MSCI EAFE Mini Futures Statistics | SPECULATORS | COMMERCIALS | SMALL TRADERS |
| – Percent of Open Interest Longs: | 6.4 | 90.4 | 2.9 |
| – Percent of Open Interest Shorts: | 9.0 | 88.9 | 1.6 |
| – Net Position: | -11,145 | 5,989 | 5,156 |
| – Gross Longs: | 27,229 | 384,166 | 12,135 |
| – Gross Shorts: | 38,374 | 378,177 | 6,979 |
| – Long to Short Ratio: | 0.7 to 1 | 1.0 to 1 | 1.7 to 1 |
| NET POSITION TREND: | |||
| – Strength Index Score (3 Year Range Pct): | 54.9 | 43.2 | 42.7 |
| – Strength Index Reading (3 Year Range): | Bullish | Bearish | Bearish |
| NET POSITION MOVEMENT INDEX: | |||
| – 6-Week Change in Strength Index: | -3.6 | 4.7 | -5.7 |
Article By InvestMacro – Receive our weekly COT Newsletter
*COT Report: The COT data, released weekly to the public each Friday, is updated through the most recent Tuesday (data is 3 days old) and shows a quick view of how large speculators or non-commercials (for-profit traders) were positioned in the futures markets.
The CFTC categorizes trader positions according to commercial hedgers (traders who use futures contracts for hedging as part of the business), non-commercials (large traders who speculate to realize trading profits) and nonreportable traders (usually small traders/speculators) as well as their open interest (contracts open in the market at time of reporting). See CFTC criteria here.

- Oil prices jumped 4% amid a new wave of escalation between the US and Iran Jul 13, 2026
- EUR/USD: US Inflation Will Determine Everything Jul 13, 2026
- COT Metals Charts: Weekly Speculator Bets see small gains for Silver & Gold Jul 12, 2026
- COT Bonds Charts: Speculator Bets led by SOFR 3-Months & 2-Year Bonds Jul 12, 2026
- COT Energy Charts: Weekly Speculator Changes led by Brent Oil Jul 12, 2026
- COT Soft Commodities Charts: Weekly Speculator Changes led by Sugar, Corn & Soybeans Jul 12, 2026
- The US and European stock indices are rising again amid renewed investor interest in the AI industry. Jul 10, 2026
- USD/JPY Falls as Yen Recovers Weekly Losses Jul 10, 2026
- Crude oil prices surged sharply by 7% in reaction to the rapid escalation of the conflict in the Middle East Jul 9, 2026
- Middle East Tensions Weigh on Gold Jul 9, 2026