Gold has returned to growth. On Friday, a troy ounce of the precious metal was priced at 2517 USD. The price has stabilised as the market awaits the release of August’s crucial US employment report. The data could prompt a revision of the Federal Reserve’s interest rate outlook, which is particularly important given the short time left before the Fed meets.
Lower interest rates could reduce the cost of holding gold as a non-yielding asset. Given the weak employment market signals, the market believes the Fed will be forced to act more decisively.
The latest statistics showed that private employers in the US hired at the slowest pace in 3.5 years in August. This follows a decline in the number of job vacancies. In addition, manufacturing activity in the economy declined. All this appears to be a negative factor indicating the state of the US economy and fuelling expectations of a 50-basis points rate cut in September. Investors are currently pricing in a 41% probability of such a scenario, which is relatively high. Considering fundamental factors, it is reasonable to assume that gold prices will continue to rise.
XAUUSD technical analysis
On the H4 chart, XAUUSD has received support at 2472.00. Currently, the structure of a growth wave towards 2513.62 is being formed. Today, the market is creating a consolidation range around this level. An upside breakout will open the potential for growth towards 2555.50. A break above the 2522.00 level may signal the development of a further growth wave. Technically, this scenario is confirmed by the MACD indicator. Its signal line is above zero and sloping upwards.
On the H1 chart of XAUUSD, the market has completed a growth wave to 2513.62. Currently, the range is extended upwards to the level of 2523.20 and downwards to the level of 2504.00. In the case of a downward breakout, a decline to 2491.55 may occur. Conversely, an upward breakout could continue the trend to 2555.50. Technically, this scenario is confirmed by the Stochastic oscillator. Its signal line is near the level of 80 and is preparing to decline to 20.
Disclaimer
Any forecasts contained herein are based on the author’s particular opinion. This analysis may not be treated as trading advice. RoboForex bears no responsibility for trading results based on trading recommendations and reviews contained herein.
Grid operators rely on so-called “peaker” plants to ensure they will have enough supply to meet these demand surges. Peaker units can start up quickly and at relatively low cost, but they typically burn more fuel per unit of electricity produced than other types of fossil fuel units.
Because they are less efficient than other plants, peakers typically run only during high-demand periods. Historically, peakers have run for less than 10% of the year, often for just a few hours at a stretch.
Nonetheless, their higher emissions per unit of electricity produced raise environmental and health concerns. As of 2021, there were 999 peaker plants across the U.S., in all 50 states. About 70% of these plants burned natural gas, and the rest were powered by oil and coal.
To reduce air pollution and combat climate change, the U.S. is shifting away from fossil fuels and increasing its use of renewable energy sources such as wind and solar power. Ironically, though, as climate change generates more frequent and intense heat waves, many electricity systems are increasingly relying on peaker plants to balance fluctuations in renewable power generation. Proposals to build new peakers or extend the lives of old ones have stirred controversy in states including Wisconsin, Massachusetts, Texas and New York.
South Bronx residents call on New York state to shut down local peaker plants in 2022. These plants are disproportionately located in low-income and minority neighborhoods.
Balancing the power supply
For system operators, one key characteristic of a power plant is whether it can produce power on demand. Many renewable resources, including wind, solar and certain types of hydropower, are known as nondispatchable resources because they are governed by nature, producing energy when conditions allow. The cost of generating electricity with them is low, so they are typically used to their maximum capacity.
Power plants that run on fossil fuels or nuclear power are known as dispatchable resources because they can produce power whenever it’s needed. They have higher operating costs than renewables, however, mainly because gas, coal, nuclear and oil plants must buy fuel in order to operate.
Some of these plants – historically, those that run on coal or nuclear fuel – are called baseload plants. They generate power relatively cheaply but take time to start up and ramp up to full power. Intermediate units produce power at a higher cost for each additional megawatt-hour produced, but they can cycle up and down more quickly than baseload plants. Peakers have the highest costs per megawatt-hour, but they can adjust their output very quickly.
Historically, baseload units operated year-round, with intermediate units adjusting output to meet short-term demand fluctuations. Peaker plants were used only during rare peak demand periods.
But as power suppliers add more wind and solar energy to the grid, they are using dispatchable fossil fuel units more frequently to balance changes in renewable generation – for example, to run air conditioners when the sun goes down but temperatures are still high. This favors units that can quickly change production levels, even if they are less fuel-efficient. The result is a growing role for peaker plants.
Kearny Generating Station, a former coal-fired baseload power plant, now a gas-fired peaker, on the Hackensack River in New Jersey. Jim Henderson/Wikipedia, CC BY
Environmental justice flash points
Electricity production from fossil fuels in the U.S. has decreased with large-scale investment in wind and solar generation. But fossil fuel-burning power plants still produce about 60% of U.S. electricity – and those plants emit pollutants that contribute to climate change and degrade local air quality.
One 2022 report estimates that 32 million Americans live within 3 miles of a peaker plant. In 2024, the U.S. Government Accountability Office reported that historically disadvantaged racial or ethnic communities were statistically more likely to be located closer than average to peakers.
Other ways to meet peak demand
How else can electricity supply and demand be balanced? One option is using batteries to store electricity when wind or solar output is high, then discharging it when demand exceeds supply from conventional resources.
Although battery investment costs currently are high, they are projected to decrease significantly in the coming decades. In 2023, the U.S. had a total of about 15 gigawatts of battery storage capacity – equivalent to 15 large nuclear power plants – and that figure could double in 2024.
A third option is demand response programs, in which electricity consumers pay higher prices during higher demand periods. This could help reduce peaks and valleys in demand across the day, benefiting more efficient but less flexible baseload units designed to run around the clock.
Most consumers, however, don’t currently pay prices that reflect short-term changes in wholesale electricity costs. Moreover, it’s uncertain whether residential customers would alter their consumption based on short-horizon price fluctuations. Technologies such as smart thermostats and energy management apps could help by taking the burden off consumers to manually adjust their electricity use in response to price fluctuations.
Finally, power plant owners can invest in technologies to reduce emissions from fossil fuel units. Peakers typically lack pollution control technologies because they aren’t used very often. Retrofitting older plants to make them more efficient could also help, since they would produce fewer emissions for each unit of electricity.
These investments are costly, so policymakers have to weigh the health benefits of reduced air pollution against the investment costs for power plant owners.
Increasing investment in wind and solar energy is reducing local air pollution from electricity production. But it’s also shifting production away from thermally efficient baseload units that can’t respond quickly to shifts in demand or renewables output. I believe it is increasingly important to explore policies that create incentives for investing in alternatives such as battery storage and transmission infrastructure, as well as in power plant upgrades to reduce pollution exposure.
“Hey Rupam, open the door. Take this fish,” a woman yelled from outside. I was sitting in the kitchen at my friend Rupam’s house in rural northeast India. It was the heart of monsoon season, and rain had been falling since morning. The woman must have been shouting because the noise of the rain on the tin roof muted everything else.
The aunty who lived next door stood outside with a large bowl of Boriala fish. Her husband had gone fishing on the Subansiri River, which flows next to the village, and he had fished all evening. “My husband cannot stay indoors in this weather,” she said in Assamese, the local language. “You can catch a lot of fish during this time.”
The monsoon season has long brought a bounty of fish from May to September for people living downstream.
The Subansiri Lower Hydroelectric Project, under construction, will be one of India’s largest hydropower dams. Nayan J. Nath, CC BY
For most of the day, the dam will hold back water, letting only a small amount through, roughly equivalent to the region’s dry season. But for about four hours each night, it will release water to generate power, sending a raging river downstream almost like during monsoon season.
The dam will not only block the movement of fish, but also change the way people living downstream experience the river’s flows.
A fisher collects his net on a winter evening in the Subansiri. The river is calm and shallow in many places at that time of year, and people can walk across parts of the river. Parag Saikia
In a 2010 report on the likely impact of the Subansiri Lower Hydroelectric Project on downstream populations, experts from three premier institutes of Assam — the central state of northeast India — identified several concerns for downstream communities, including flood and erosion risk, earthquake risk, the loss of water flow for fishing and groundwater recharge, and the survival of species including river dolphins.
Now, a decade later, as the dam is nearing completion, the central question remains: What will happen to people like Rupam’s neighbor, whose lives and livelihoods depend on the river?
In 2023, I lived in a village next to the Subansiri River. My dissertation research brought me there to study how this hydroelectric dam, under construction since 2005, is affecting communities downstream.
‘Small displacement’ by ‘benign’ dams
Northeast India has been the focus of hydropower dam construction since the beginning of this century. In order to secure the country’s energy future, Central Electricity Authority of India in 2001 identified the Brahmaputra River basin as having the highest hydropower potential – 63,328 megawatts. It proposed constructing a whopping 168 hydropower dams in the region.
This earned the region the nickname “India’s Future Powerhouse.” The Subansiri Lower Hydroelectric Project was the first project.
The government sees the mega-hydro dam initiative as a win-win. It expects the dams to increase India’s energy security while also developing large infrastructure networks in one of India’s contentious borderland regions.
About 80% of the power for “India’s Future Powerhouse” is proposed to be generated in Arunachal Pradesh, the largest state of northeast India. China has repeatedly challenged India’s sovereignty over Arunachal since the latter’s independence in 1947.
Building dams in Arunachal Pradesh has another advantage: very low population density. It has about 17 people per square kilometer, and over 80% of Arunachal’s total territory is forest. That helped the government of India to argue that “there is relatively ‘small displacement’ by submergence as compared to that in other parts of the country and therefore these projects are benign.”
However, these projects are in no way benign to the people who live downstream.
The disruption to lives downstream
The flood plains of the Subansiri are home to people belonging to indigenous communities and lower castes of Hindu caste hierarchy. Mising – the largest indigenous community in the downstream region – call the river “Awanori,” which means “mother river.”
As part of my long-term ethnographic fieldwork, I observed how a range of livelihoods in the downstream region – fishing, agriculture, livestock grazing, recovering driftwood and transporting people by boat in remote areas – are all dependent on the 79-mile Subansiri River. I interviewed people who live there and attended community events to understand how the river plays a big role in everyday life.
The Golden Jubilee celebration of Takam Mising Porin Kebang, or All Mising Student Union, in 2023. A banner in Assamese reads: ‘We are a riverine civilization. Save the River, Save the Community. No Big Dam.’ The student union led protests over the dam’s downstream impacts. Parag Saikia
Their reliance on the river has been based on natural, uncontrolled flows. Once the dam is completed, the river flows will be controlled by the National Hydroelectric Power Corporation.
Once in operation, the dam will block most of the river’s flow for 20 hours of the day, and then release that water – about 2,560 cubic meters per second – to power turbines that can meet peak electricity demand between 6 p.m. and 10 p.m. every night. During the 20 nonpeak hours, the dam would release less than a tenth as much water.
What happens when the river flow changes?
When the dam was first proposed, there was no plan to release water during the nonpeak 20 hours. Activists argued that cutting the water’s flow would have made it impossible for any aquatic animal to survive downstream.
In 2017, the nonpeak-hour flow proposal was increased to a range of 225 to 250 cubic meters per second. That year, the National Green Tribunal, which resolves civil cases related to the environment, asked the National Hydroelectric Power Corporation to ensure a minimum level of water for the survival of Gangetic dolphin, India’s national aquatic animal. This judgment helped pave the way for restarting the construction after an eight-year delay. However, the tribunal did not address how people living downstream would be affected by the changes.
A landslide that temporarily blocked the dam’s spillway in 2023 during construction gave downstream communities a preview of extreme swings in water flows.
The calculation of minimum flow only for the survival of one aquatic mammal leaves out numerous ways the flows of the Subansiri matter to people and other animals.
The dam itself threatens the downstream existence of many fish varieties, including the golden mahseer. It will also alter the flow and sediment supply in the river, and the abrupt and powerful flow for four hours each night will have greater scouring capacity and risks eroding the riverbed and banks.
Traditionally, from October to April, the dry riverbed and sandbar islands have been used to grow early-maturing ahu rice and mustard before the monsoon flood waters arrive. People also graze their livestock in the islands and in the fields after crops are harvested.
Once the dam begins flooding the river for four hours a night, however, the riverbed and sand-bar islands will be largely unusable.
Dried stems of mustard lie on the ground after they have been harvested in a riverbank field downstream of the dam. Parag Saikia
The rainy season when the river floods is the most productive time for fishing and collecting driftwood. However the dam will obstruct the movement of fish and trap wood behind the dam. So, even though there will be flood waters every day in the river, fishermen and wood collectors may not benefit from it.
For people like Rupam’s neighbor, the Subansiri River they know will change. They will have to navigate the river more cautiously, and every evening there will be monsoon-season water levels.
Will they be able to catch enough fish to share with their neighbors? Only time will tell.
On a recent visit to Rangely, a small town in northwest Colorado, my colleagues and I met with the administrators of a highly regarded community college to discuss the town’s economy. Leaving the scenic campus, we saw families driving into the mountains in off-road vehicles, a favorite activity for this outdoors-loving community. With a median household income above US$70,000 and a low cost of living, Rangely does not have the signs of a town in economic distress.
Rangely is not unique in the United States, which is the world’s largest producer of oil and natural gas. There are towns across the country that depend on the oil and gas industry for well-paying jobs and public revenues that fund their schools and other critical services.
A heavy dependence on any single industry is risky, and the oil industry is prone to booms and busts. But the economies of oil- and gas-dependent towns face a unique threat from global efforts to address the risks of climate change, which is fueled by the burning of oil and natural gas. Any serious strategy to halt global warming involves policies that will, over time, sharply reduce demand for all fossil fuels.
Early signs of this transformation can be seen in last year’s international agreement to “transition away from fossil fuels” and in the spread of electric vehicles that are starting to displace gasoline- and diesel-powered cars, trucks and buses.
As an economist who worked at the White House during the Obama administration and early Biden administration, I contributed to detailed strategies to reduce greenhouse gas emissions and to support communities in economic distress. But we did not have a plan to prepare oil and gas towns like Rangely for future economic challenges.
Why oil and gas towns are overlooked
Congress has prioritized support for small towns in recent legislation. However, oil- and gas-dependent towns were largely absent from these strategies for three primary reasons.
First is a perceived lack of urgency. The attention to a “just transition” as the nation moves away from fossil fuels has been disproportionately directed to coal-dependent communities. U.S. coal production has declined for 15 years, and a continued transition away from coal appears imminent and inevitable.
In contrast, U.S. production of oil and natural gas continues to grow. To be sure, some oil and gas communities are already struggling. But the widespread economic risks of a shift away from oil and gas may feel more like a problem for future decades.
Second, politicians downplay risks to oil and gas communities.
Most Republicans are not planning for a future decline in oil and gas production at all, and that includes many local politicians in oil and gas-dependent communities. For their part, most Democratic politicians prefer to focus on how climate action can be an engine of future economic growth. President Joe Biden likes to say, “When I think about climate change, I think jobs.”
He is not wrong to highlight the economic opportunities of climate solutions. But clean energy jobs rarely offer one-for-one replacements for the high-paying jobs in the oil and gas industries and the public revenues those industries bring local communities.
Third, economists’ policy toolbox is poorly suited to the challenges facing oil and gas communities.
Proposals to support local economic development commonly suggest targeting persistently distressed local economies with measures such as wage subsidies that have the potential to rapidly put more people to work.
A different prescription is needed for oil and gas communities, which are not generally struggling today. Over the 15-year period prior to the pandemic, the U.S. counties with oil and gas production experienced average annual GDP growth of 2.4% per year, compared with 1.9% nationwide.
Most oil and gas communities do not need economic stimulus policies that provide immediate relief. What they need are holistic economic development strategies that can cultivate new industries – building on their existing strengths – that will enable them to prosper into the future.
Solutions to help oil and gas towns prepare
Harvard economist Ricardo Hausmann compares the challenge of developing new economic capabilities to the game of Scrabble, where each additional letter enables the creation of more words. He cites the Finish economy as an example: It evolved from harvesting lumber to making tools that cut wood to producing automated cutting machines. From there, it evolved to sophisticated automated machines, including those used by global corporations such as telecommunications giant Nokia.
Such economic evolutions must be tailored to the characteristics of individual places. But the initial step is to recognize the problem and invest in solutions.
The Southern Ute Indian Tribe is doing this in southwest Colorado. It devotes oil and gas revenues to a Permanent Fund, which promotes fiscal sustainability by ensuring the tribe’s assets are aligned with its long-term financial goals, and a Growth Fund that diversifies the tribe’s revenue sources by investing in a range of businesses.
At the national level, a recent National Academies panel proposed the creation of a federally chartered corporation to help communities facing acute economic threats, including a future decline in oil and gas. This corporation could provide funding for displaced workers, critical public infrastructure and programs that ensure access to economic opportunities.
Colorado’s state Office of Just Transition has started to serve this role. Currently, it focuses only on the transition away from coal, with the goals of helping communities develop new economic opportunities and helping workers transition to new jobs. But its mission could be expanded in the future. In fact, Rangely is already receiving some support due to coal closures nearby.
No one-size-fits-all solution
Small, rural towns like Rangely illustrate how oil- and gas-reliant regions will need unique strategies tailored to the strengths and limitations of individual places. No off-the-shelf playbook exists.
Our group of researchers who visited Rangely are part of the Resilient Energy Economies initiative, which was created by universities, research institutes and philanthropic organizations to ensure that policymakers have the information they need to help fossil fuel-dependent communities successfully navigate the energy transition.
The best time to build a more resilient economy is before a crisis arrives. Anyone familiar with the Bible – or Broadway – knows the story of Joseph, whose dreams foresaw seven years of abundance for Egypt followed by seven years of famine. The pharaoh acted on Joseph’s vision, using the boom to prepare for the bust.
The United States is experiencing abundant oil and gas production today. Policymakers know risks are coming. But so far, the country is failing to prepare communities for harder days to come.
Many commentators believe that the world should move away from measuring economic success in terms of GDP growth. Yes, growth has brought prosperity and untold riches, but it has had significant negative side effects for the planet, including climate change, pollution and species extinction. None of these are captured in GDP data.
A whole “beyond GDP” movement has emerged over the last several decades, arguing that we should adopt a new way of measuring the wealth of nations. There is an ongoing debate about the best alternative, and many indicators have supporters, such as gross national happiness and the genuine progress indicator.
Yet one stands out as having by far the most buy-in from major international institutions. Known as “inclusive wealth”, it expands what we mean by wealth to include things like the natural environment and the abilities of the population. But it comes with a major problem. There’s no agreement around how it should be measured, so different institutions publish very different figures. In our view, this is a major obstacle to its mass adoption.
Inclusive wealth
Inclusive wealth ascribes a value to the assets a nation has produced that generate well-being, and measures how they are changing over time. These assets are:
Human capital: the knowledge and skills of the population.
Produced capital: goods and services produced by human endeavour.
Natural capital: the sum of all nature-based assets from which humans derive well-being, both now and in the future.
Social capital: the social networks that exist within a society.
There is strong theoretical support for the idea that this approach is a good way of measuring the sustainability of economic development. The key point is that when inclusive wealth per capita is going up, the future wellbeing of the population will go up, which is a necessary condition for sustainable development.
Foundational texts in support of inclusive wealth include Cambridge economist Partha Dasgupta’s 2001 book, Human Well-Being and the Environment, and his Harvard counterpart Martin Weitzman’s 2003 book, Income, Wealth and the Maximum Principle.
Dasgupta carried out a review for the UK government in 2021 into the economics of biodiversity, which similarly advocates for measuring national inclusive wealth instead of national income. There have also been recent calls by academics in this field to use inclusive wealth to help with the global biodiversity framework, a UN-led drive to be “living in harmony with nature” by 2050.
Inclusive wealth is measured by both the World Bank and UN Environment Programme (Unep). The World Bank has been measuring it since the late 1990s, and first published global estimates in a 2006 report called Where is the wealth of nations : measuring capital for the 21st century. It has since published three major updates to this report, including a major revision to the methodology, with another on the way. As for Unep, it began measuring inclusive wealth in 2012.
But there are still some kinks that need ironing out before this indicator can be of any practical use. In a new paper in Ecological Economics, we compare the approaches of the World Bank and Unep and find a big divergence in their calculations.
This may explain why inclusive wealth has yet to be adopted in any serious way by any major economies (all we’ve seen so far is some mentions in policy documents, like this one from New Zealand, and a recent decision by the Biden-Harris administration to start tracking the value of US natural resources at federal level using natural-capital accounting).
The discrepancies relate mainly to natural capital. Both Unep and the World Bank include similar if not identical data from the same components: non-renewables such as fossil fuels and minerals, and renewable elements such as fisheries and forest resources. The problem is that the institutions’ research teams value them differently.
The World Bank approach comes up with a present value for expected future earnings by discounting from what they will eventually be worth. In contrast, Unep uses fixed accounting prices, referred to as “shadow prices”, which are based on market prices today.
This leads to different conclusions about the trajectory of our natural capital, and thus, by implication, of the sustainability of current development paths. This is then exacerbated by another discrepancy around how the institutions measure changes in human capital.
Country differences
In our paper, we highlight the case of Qatar. According to Unep, it is one of the worst performers in terms of the change in inclusive wealth per capita, and so is judged unsustainable. Yet according to World Bank estimates, Qatar’s inclusive wealth per capita is growing positively.
Which is it? If development is unsustainable, some remedial action will be necessary, but if it is sustainable, no problem. How is the Qatari government to decide how to proceed?
We find similar conflicting signals for many other countries. According to the World Bank data, 20 countries’ inclusive wealth per capita is in decline (in other words, unsustainable), while the Unep data has 45 countries in decline. There is also little crossover in terms of these two lists.
As many as 34 of the countries that the World Bank says have growing inclusive wealth per capita are in decline according to Unep.
We agree strongly with the basic proposition that measuring inclusive wealth is key to ensuring the world develops sustainably. But there needs to be a more consistent approach for this signal to achieve enough credibility to be widely adopted. In our experience, the World Bank is much more transparent than Unep about the data in its calculations. Without full Unep transparency, it’s difficult to get to the root of the discrepancy.
Having said that, both broad approaches have merits, so it’s more a question of everyone committing to a single approach than arguing that one is better than the other. Unless this measurement problem can be resolved, it’s difficult to see countries taking inclusive wealth seriously. That could have serious consequences in the battle to make economic development sustainable.
At Wednesday’s close, the Dow Jones (US30) Index was up 0.09%, while the S&P 500 (US500) Index fell 0.16% and hit a 2-week low. The NASDAQ Technology Index (US100) closed negative 0.30% and hit a 3-week low. Stocks on Wednesday initially recovered from early losses and headed higher after the 10-year T-note yield fell to a 2-week low after the July JOLTS report on US job openings fell more than expected to a 3-year low. The weak JOLTS report boosted hopes that the Fed would cut interest rates by 50 bps at the September 17–18 FOMC meeting. However, stocks gave up their gains after the release of the Fed’s Beige Book on Wednesday afternoon, which raised fears of a recessionary economy. The Fed’s Beige Book said the number of Fed districts reporting low or declining activity rose to nine from five in the previous period. Employers were more selective in hiring and less inclined to expand, citing concerns about demand and an uncertain economic outlook.
The Bank of Canada (BoC) decided on a 25 bps rate cut, which was widely expected, citing growing economic concerns amid inflation approaching the Central Bank’s 2% target. Preliminary data points to downside risks to third-quarter growth in the Bank’s July estimates, while the labor market remains stagnant, with unemployment holding at 6.4%, hinting at further rate cuts in upcoming meetings. However, amid the lack of surprises, Macklem noted that sustained price pressures in the housing and services sectors continue to support high inflation, which is seen as hawkish for the Bank of Canada going forward.
Equity markets in Europe were down yesterday. Germany’s DAX (DE40) fell by 0.83%, France’s CAC 40 (FR40) closed down 0.98%, Spain’s IBEX 35 (ES35) lost 0.58% and the UK’s FTSE 100 (UK100) closed down 0.35%.
Factory orders in Germany rose 2.9% in July 2024 from the previous month, beating market prognoses, which had expected a 1.5% fall, following an upwardly revised 4.6% rise in the previous month. It was the second consecutive month of growth, driven by strong orders for airplanes, ships, and trains (86.5%). Orders for electrical equipment also grew strongly (18.6%).
Switzerland’s unemployment rate rose to a seasonally unadjusted 2.4% in August 2024, up from 2.3% in the previous four months. The number of unemployed rose by 3,638 from a month earlier to a six-month high of 111,354.
WTI crude oil prices were trading near $69.6 a barrel on Thursday, remaining near the lowest level in eight months after a recent strong sell-off. Recent pressure on oil prices has been driven by oversupply concerns, with OPEC planning to increase production and a potential deal between Libya’s rival governments to restart oil production. Meanwhile, API data showed a significant drop of 7.4 million barrels in US crude inventories last week, much larger than the expected 0.9 million barrel decline.
Asian markets were predominantly down yesterday. Japan’s Nikkei 225 (JP225) was down 4.24%, China’s FTSE China A50 (CHA50) decreased by 0.70%, Hong Kong’s Hang Seng (HK50) was down 1.10%, and Australia’s ASX 200 (AU200) was positive 1.88%.
Thailand’s annual inflation rate for August 2024 fell to a fourth-month low of 0.35% from 0.83% in the previous month and came in below market expectations of 0.4%, remaining outside the Central Bank’s target range of 1–3%. Meanwhile, core inflation, which excludes volatile items such as food and energy prices, rose to 0.62% in August from the previous reading of 0.52%, exceeding market expectations of 0.55%.
Governor Michele Bullock said in a statement that the Reserve Bank of Australia (RBA) aims to balance lowering inflation in a reasonable time frame and preserve as much of the gains in the labor market as possible. She added that the country’s inflation rate has fallen significantly since its peak but remains above the midpoint of the 2–3% target, with core inflation, measured by a trimmed average, at 3.9% in June. It is expected to return to the target range by the end of next year and approach the median in 2026.
The Reserve Bank of New Zealand (RBNZ) cut the official money rate last month, the first move since tightening policy in the post-pandemic period in an attempt to curb inflation. Investors are confident the Central Bank will continue easing policy at its next meeting in October, with a 37% chance of a 50 basis point rate cut.
S&P 500 (US500) 5,520.07 −8.86 (−0.16%)
Dow Jones (US30) 40,974.97 +38.04 (+0.093%)
DAX (DE40) 18,591.85 −155.26 (−0.83%)
FTSE 100 (UK100) 8,269.60 −28.86 (−0.35%)
USD Index 101.31 −0.51 (−0.50%)
News feed for: 2024.09.05
Australia Trade Balance (m/m) at 04:30 (GMT+3);
Australia RBA Gov Bullock Speaks at 05:00 (GMT+3);
Switzerland Unemployment Rate (m/m) at 08:45 (GMT+3);
Eurozone Retail Sales (m/m) at 12:00 (GMT+3);
US ADP Non-Farm Employment Change (m/m) at 15:15 (GMT+3);
This article reflects a personal opinion and should not be interpreted as an investment advice, and/or offer, and/or a persistent request for carrying out financial transactions, and/or a guarantee, and/or a forecast of future events.
The EUR/USD pair remained stable around 1.1077 on Thursday morning, following steady growth in the previous session but still confined within a sideways channel. Investors are holding back and conserving their energy in anticipation of crucial employment data from the United States, which begins with today’s ADP private sector jobs report. Although the ADP report does not directly correlate with Friday’s highly anticipated Nonfarm Payroll (NFP) report, it provides a general sense of market sentiment.
Additionally, the market will closely watch today’s weekly unemployment claims data release, especially given the Federal Reserve’s focused attention on employment indicators. These releases are expected to heighten EUR/USD volatility as the day progresses.
The spotlight will soon shift to Friday’s key employment metrics, including non-farm payrolls, the unemployment rate, and average hourly earnings for August. These indicators are pivotal ahead of the September Fed meeting. Robust employment data may support a minimal 25 basis point rate cut by the Fed, whereas weaker labour market figures could heighten the possibility of a 50 basis point reduction.
EUR/USD Technical Analysis
The pair is currently consolidating around the 1.1065 level. The market may test up to 1.1107 today, which is seen as a correction phase in the context of a broader decline. Following this potential rise, a further decline to 1.1060 is anticipated. A break below this level could signal a continuation of the downtrend, potentially reaching 1.1016. The MACD indicator supports this bearish outlook, with its signal line below zero and pointing downwards.
On the H1 chart, EUR/USD continues to consolidate around 1.1065. A slight dip to 1.1056 might occur, followed by an extension towards 1.1107 as part of a corrective pattern. Once this correction phase is completed, the downward trend is expected to resume. The Stochastic oscillator, currently just above 20, suggests a potential rise to 80, indicating room for short-term upward movement before continuing thebroader bearish trend.
Disclaimer
Any forecasts contained herein are based on the author’s particular opinion. This analysis may not be treated as trading advice. RoboForex bears no responsibility for trading results based on trading recommendations and reviews contained herein.
Traders fully priced in 25 bp cut by BoC this week
Bloomberg FX model: 74% – (1.3400 – 1.3675)
Key technical levels – 1.3550 & 1.3600
After tumbling over 2% in August, the USDCAD has kicked off the new month on a bullish note.
Prices jumped over 60 pips on Tuesday, testing key resistance at 1.3550 ahead of the Bank of Canada rate decision on Wednesday.
The USDCAD’s recent upside could be based around a weaker Canadian Dollar. It is worth noting that the CAD has slipped against most G10 currencies this week thanks to lower oil prices and expectations around a BoC rate cut.
Looking at the charts, prices remain under pressure on the weekly charts with the 100 and 50-week SMA acting as key levels of resistance.
Nevertheless, a significant move may be on the horizon and here are 3 reasons why…
1) Bank of Canada rate decision
On Wednesday, September 4th, the Bank of Canada (BoC) will announce its rate decision.
Weak economic data from Canada have boosted expectations around the BoC cutting interest rates for the third time this year.
Traders have fully priced in a 25-basis point BoC cut by September, another cut by October and one final cut by December!
Note: The latest jobs data from Canada will be published on Friday, September 6th. The unemployment rate is expected to tick higher to 6.5% from 6.4% in the previous month while net change in employment is seen rising to 26.5k after declining by 2.8k in June.
Should the BoC move ahead with a rate cut in September and signal further cuts down the road, this could push the USDCAD higher.
An outcome where the central bank sounds less dovish than expected could strengthen the Canadian Dollar, pulling the USDCAD lower as a result.
Golden nugget: Over the past year, the BoC rate decision has triggered upside moves as much as 0.35% of declines of 0.1% in a 6-hour window post-release.
Given how investors may use this as a guide to how quick or slow the Fed will cut rates from September onwards, this data could rock global financial markets.
The US economy is expected to have created 165k new jobs in August with the unemployment rate ticking lower to 4.2% and average hourly earnings rising to 3.7% year-on-year compared to 3.6% in the previous month.
If the unemployment rate ticks lower to 4.2% and cools recession fears, this may end up boosting the USD – pushing the USDCAD higher.
A scenario where the unemployment rate remains at 4.3% or even higher could fuel recession fears – boosting bets of a 50 bp cut. Given how this is likely to weaken the USD, the USDCAD could end up tumbling.
Traders have fully priced in a 25-basis point Fed cut by September with a 34% probability of a 50 bp move.
Golden nugget: Over the past 12 months, the US jobs report has triggered upside moves as much as 0.4% of declines of 0.3% in a 6-hour window post-release.
3) Technical forces
USDCAD bulls could be handed more power if prices secure a solid daily close above 1.3550. Still, lagging indicators seem to be favour bears with prices still trading below the 50, 100 and 200-day SMA.
A solid breakout above 1.3550 may inspire an incline toward 1.3600 and 1.3677.
Should 1.3550 prove to be reliable resistance, this could see prices decline toward 1.3450 and 1.3400.
Bloomberg’s FX model points to a 75% chance that USDCAD will trade within the 1.3400 – 1.3675 range over the next one-week period.
At the end of Tuesday, the Dow Jones Index (US30) decreased by 1.51%, while the S&P 500 Index (US500) fell 2.12%. The NASDAQ Technology Index (US100) closed yesterday negative 3.26%. Stocks fell sharply on Tuesday, with the S&P 500 Index (US500) hitting a 2-week low and the Nasdaq 100 Index hitting a 2-week low. Tuesday’s drop in chip company stocks had a negative impact on the overall market. Stocks were also hurt by Tuesday’s weaker-than-expected manufacturing activity and construction spending reports from the ISM.
The ISM manufacturing index for August rose by 0.4 to 47.2, weaker than expectations of 47.5. The ISM Services Price Sub-Index for August unexpectedly rose by 1.1 to 54.0 versus expectations of a decline to 52.0, which was hawkish for Fed policy. US construction spending for July unexpectedly fell by 0.3% m/m, weaker than expectations for a 0.1% m/m rise and the biggest decline in a year. Markets rate the odds of a 25 bps rate cut at the September 17-18 FOMC meeting at 100% and a 50 bps rate cut at that meeting at 38%.
Boeing (BA) shares are down more than 7% after Wells Fargo Securities downgraded the stock with a $119 price target. Visa (V) shares closed higher by more than 1% after BNP Paribas Exane upgraded the stock to “improved” from “neutral” with a $325 price target.
Canada’s GDP grew at a 2.1% annualized rate in the second quarter of 2024, the highest rate since the first quarter of 2023. The figure beat the previous quarter’s revised 1.8% growth and expectations of 1.6% growth, easing fears of stagnation and reducing the likelihood of aggressive monetary policy easing by the Bank of Canada. The Bank of Canada will hold a monetary policy meeting today. Canadian overnight index swaps (OIS) indicate that the Bank of Canada (BoC) will cut rates by 0.25% to 4.25% today, and markets now expect two more rate cuts this year after September. There is a 15% chance of a more substantial 50 bps rate cut. A rate cut could hurt the Canadian currency against other currencies.
Equity markets in Europe were declining yesterday. Germany’s DAX (DE40) fell by 0.97%, France’s CAC 40 (FR40) closed down 0.93%, Spain’s IBEX 35 (ES35) lost 1.02%, and the UK’s FTSE 100 (UK100) closed down 0.78%.
The S&P Eurozone Manufacturing PMI for August was revised upward by 0.2 to 45.8 from the previously reported 45.6. German retail sales for May fell by 1.1% year over year, weaker than expectations of 0.7% year over year. Swaps discount the odds of a 25 bps ECB rate cut at the September 12 meeting to 99%.
WTI crude oil prices fell more than 4% below $71/bbl on Tuesday, the lowest since early January, as weak demand amplified the impact of relatively ample supply. New data from China added to concerns that economic growth in one of the world’s biggest oil consumers is unlikely to recover this year, with key indicators of domestic factory demand falling more than expected in August. In the US, data from the EIA showed US oil consumption in June fell to its lowest seasonal level since 2020. Meanwhile, OPEC signaled it would follow earlier signals to increase OPEC+ production in the fourth quarter, offsetting lower production from Libya.
Asian markets were predominantly down yesterday. Japan’s Nikkei 225 (JP225) decreased by 0.04%, China’s FTSE China A50 (CHA50) was down 0.22%, Hong Kong’s Hang Seng (HK50) lost 0.23% and Australia’s ASX 200 (AU200) was positive 0.08%.
Australia’s economy grew by 0.2% quarter-on-quarter in the second quarter of 2024, holding steady in the third quarter and falling short of market forecasts of 0.3%. This was the 11th period of quarterly growth, but the pace remained the slowest in the past five quarters.
S&P 500 (US500) 5,528.93 −119.47 (−2.12%)
Dow Jones (US30) 40,936.93 −626.15 (−1.51%)
DAX (DE40) 18,747.11 −183.74 (−0.97%)
FTSE 100 (UK100) 8,298.46 −65.38 (−0.78%)
USD index 101.75 +0.10 (+0.10%)
Important events today:
– Australia GDP (q/q) at 04:30 (GMT+3);
– German Services PMI (m/m) at 10:55 (GMT+3);
– Eurozone Services PMI (m/m) at 11:00 (GMT+3);
– UK Services PMI (m/m) at 11:30 (GMT+3);
– Eurozone Producer Price Index (m/m) at 12:00 (GMT+3);
– Canada Trade Balance (m/m) at 15:30 (GMT+3);
– US Trade Balance (m/m) at 15:30 (GMT+3);
– Canada BoC Interest Rate Decision at 16:45 (GMT+3);
This article reflects a personal opinion and should not be interpreted as an investment advice, and/or offer, and/or a persistent request for carrying out financial transactions, and/or a guarantee, and/or a forecast of future events.
The USD/JPY pair has slightly increased, rising to 145.95 on Wednesday morning. This movement marks a rebound from two-week lows, though it is still early to suggest a significant reversal in the trend due to the ongoing economic climate.
Market participants are cautious as they await crucial US employment market data for August, which is due later this week. These figures will likely substantially impact the Federal Reserve’s forthcoming decisions.
On the Japanese front, the Bank of Japan (BoJ) has maintained its current policy stance but has signalled potential adjustments should economic projections align with actual outcomes. This cautious but responsive approach, including the possibility of a December interest rate hike, reflects the BoJ’s commitment to stability in the face of economic indicators.
Recent Japanese economic data has shown a slight improvement, with the manufacturing PMI inching up to 49.8 from 49.5, nearly reaching the critical threshold of 50.0 that differentiates contraction from expansion. This positive development suggests a potential stabilisation in the manufacturing sector, which could influence the USD/JPY forecast as market participants assess the implications for monetary policy and economic growth in Japan.
USD/JPY technical analysis
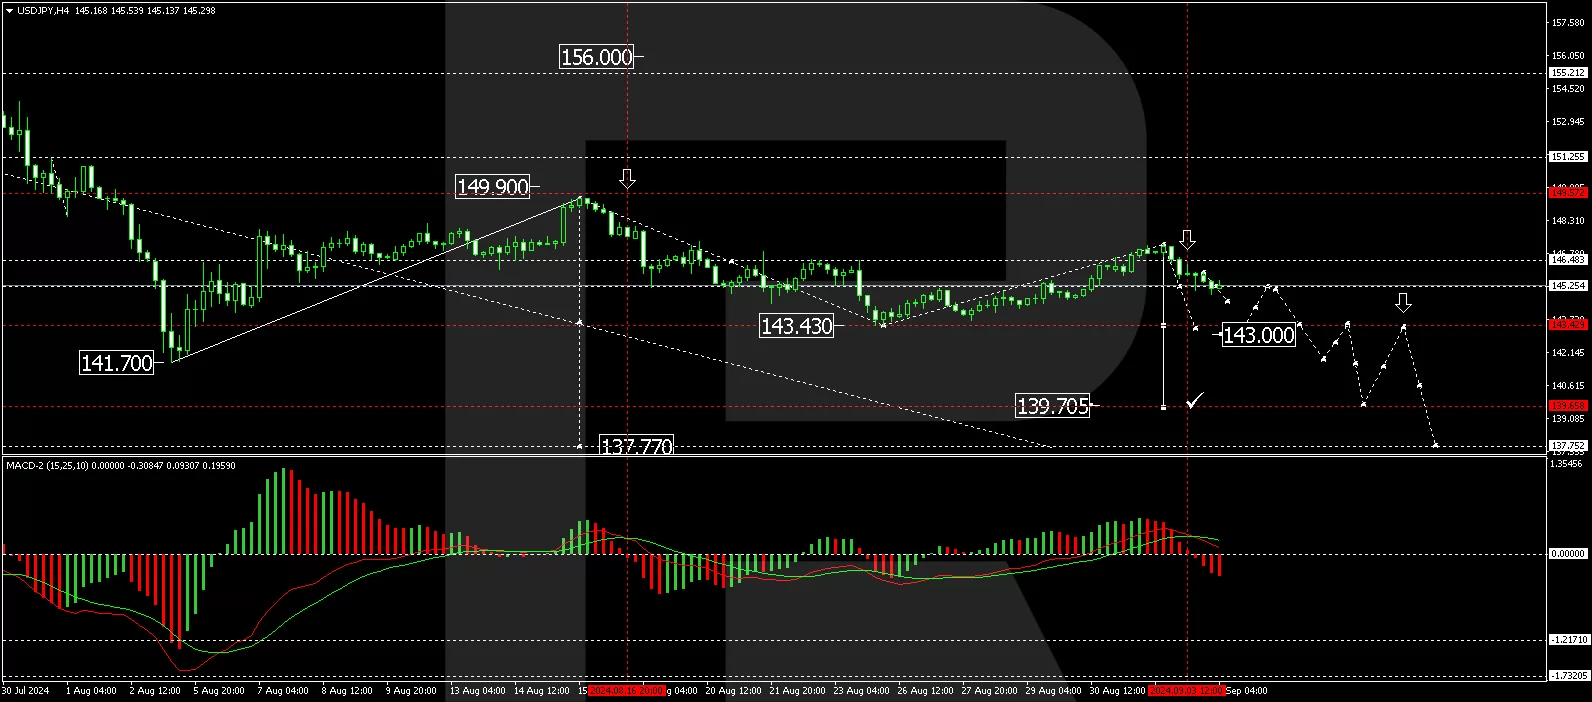
The H4 chart indicates a recent corrective move up to 147.20, followed by a downward wave targeting 144.11. Should this level be reached, a corrective movement to 145.66 could occur, testing it from below. A further decline to 144.11 is conceivable, with a potential continuation to 141.80 and down to 137.77. This bearish outlook is supported by the MACD indicator, with the signal line positioned above zero but trending downward sharply.
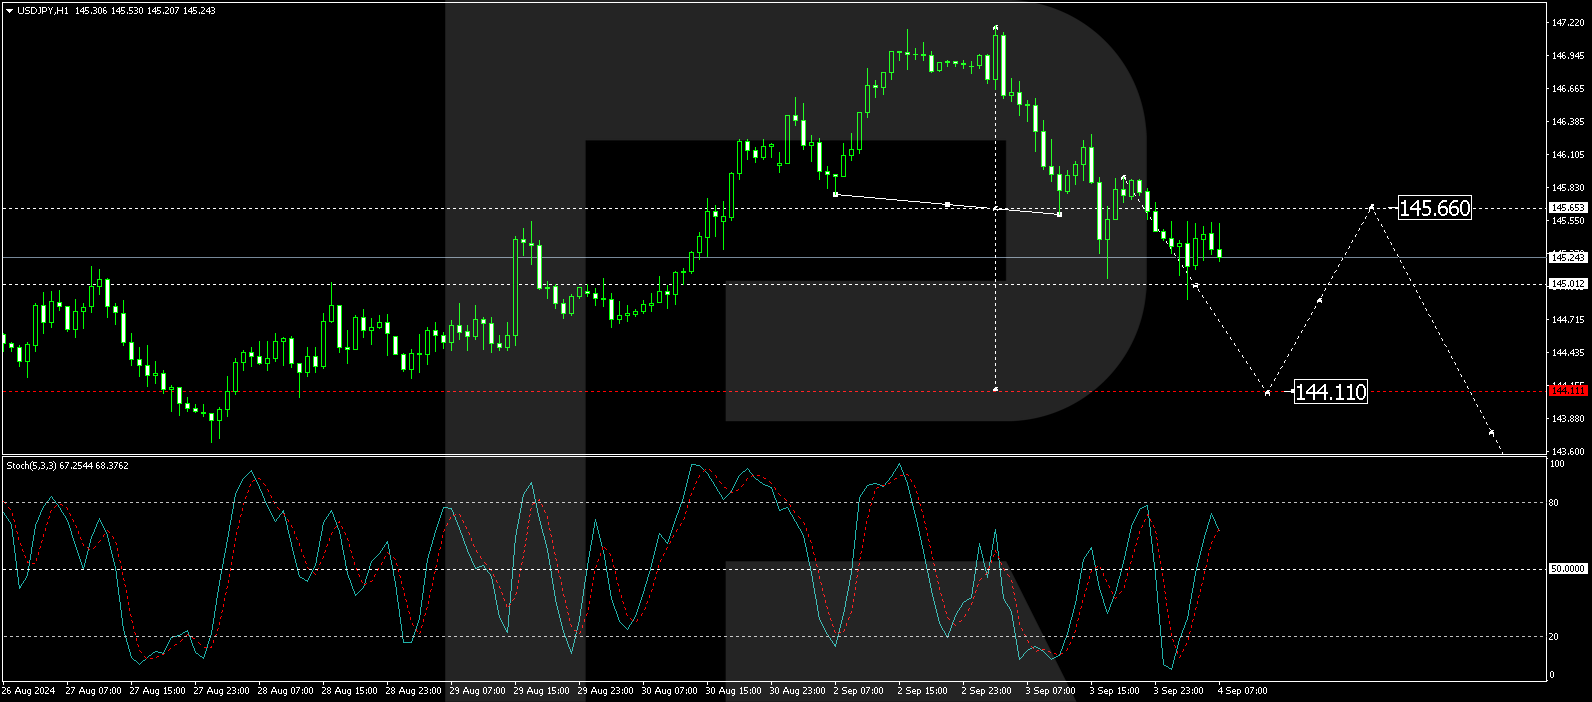
On the H1 chart, USD/JPY executed a downward impulse to 145.66 and has since been consolidating around this level. A break below the consolidation range could initiate the continuation of the downward trend towards 144.11. After reaching this target, a retest of 145.66 may be anticipated. This bearish scenario aligns with the Stochastic oscillator’s readings, where the signal line is just above 50 but indicates a downward movement.
Disclaimer
Any forecasts contained herein are based on the author’s particular opinion. This analysis may not be treated as trading advice. RoboForex bears no responsibility for trading results based on trading recommendations and reviews contained herein.


 Kearny Generating Station, a former coal-fired baseload power plant, now a gas-fired peaker, on the Hackensack River in New Jersey.
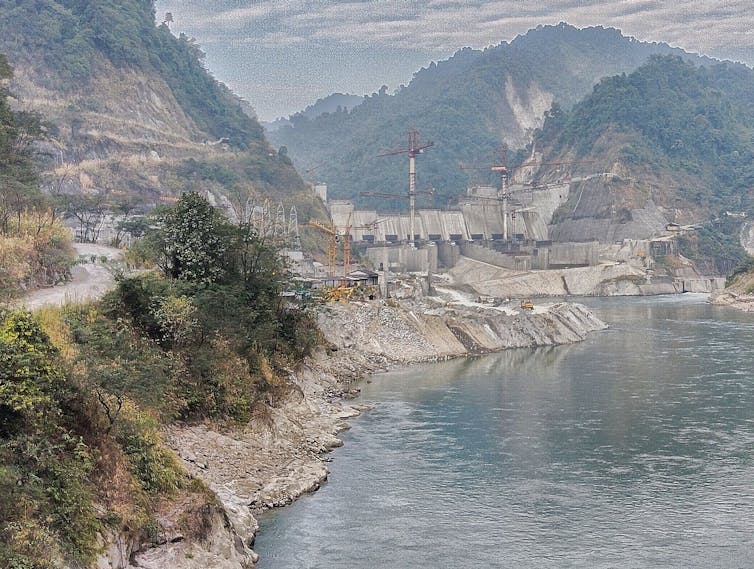 The Subansiri Lower Hydroelectric Project, under construction, will be one of India’s largest hydropower dams.


