By InvestMacro
Here are the latest charts and statistics for the Commitment of Traders (COT) data published by the Commodities Futures Trading Commission (CFTC).
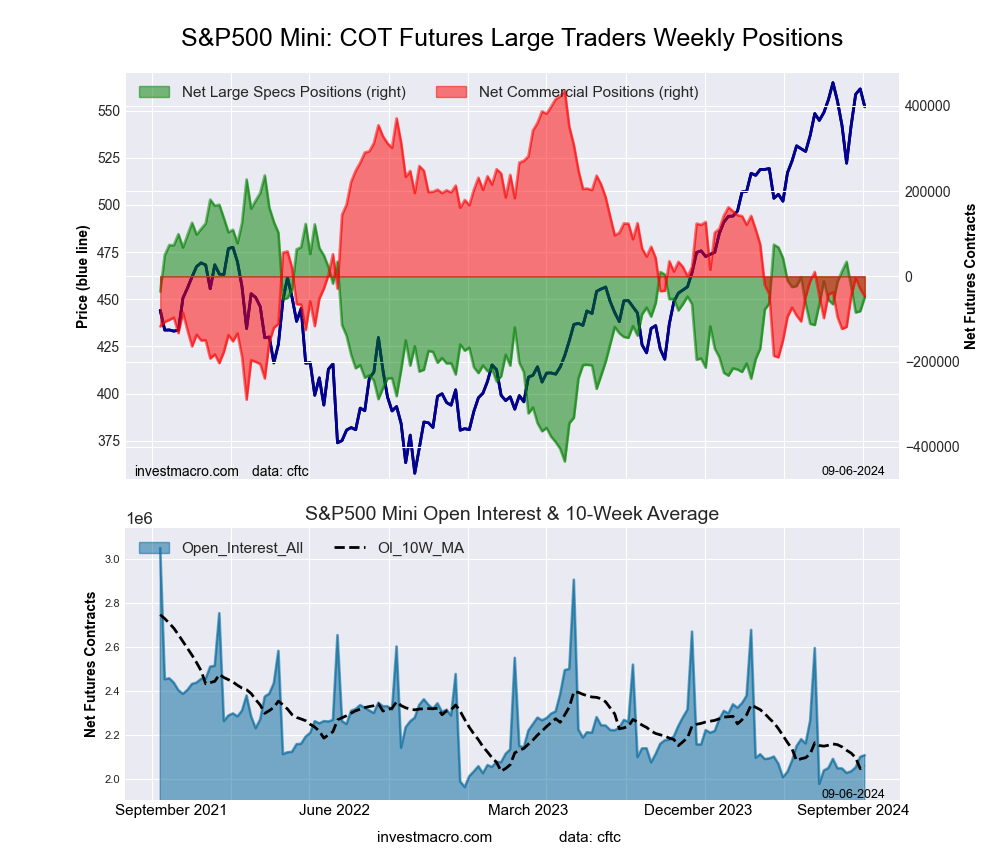
The latest COT data is updated through Tuesday September 3rd and shows a quick view of how large market participants (for-profit speculators and commercial traders) were positioned in the futures markets. All currency positions are in direct relation to the US dollar where, for example, a bet for the euro is a bet that the euro will rise versus the dollar while a bet against the euro will be a bet that the euro will decline versus the dollar.
Weekly Speculator Changes led by CAD, GBP & JPY
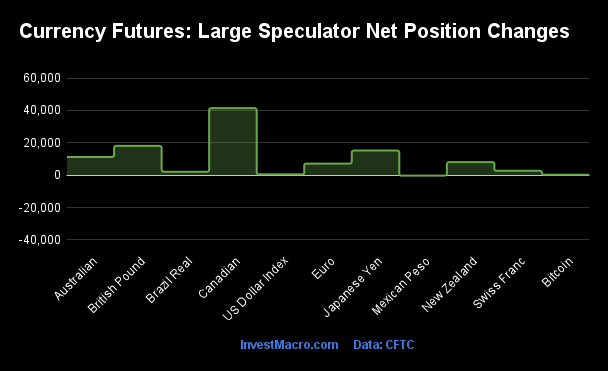
The COT currency market speculator bets were overall higher this week as ten out of the eleven currency markets we cover had higher positioning while the other one markets had lower speculator contracts.
Leading the gains for the currency markets was the Canadian Dollar (41,458 contracts) with the British Pound (18,147 contracts), the Japanese Yen (15,248 contracts), the Australian Dollar (11,295 contracts), the New Zealand Dollar (8,078 contracts), the EuroFX (7,180 contracts), the Swiss Franc (2,730 contracts), the Brazilian Real (2,152 contracts), the US Dollar Index (516 contracts) and with Bitcoin (274 contracts) also having a positive week.
The only currency seeing a decline in speculator bets was the Mexican Peso with a small reduction by -241 contracts on the week.
Speculators push Canadian Dollar, British pound & Yen bets higher for multiple weeks
Highlighting this week’s currency data roundup is the continued gains for the Canadian dollar, British pound and the Japanese yen.
The Canadian dollar speculative position continued to improve this week and rose for a fifth consecutive week. The total gain over the past 5-weeks is now +127,719 contracts after the speculative position had fallen to an all-time low on July 30th at a total of -196,263 contracts. The current CAD positioning remains bearish for a 57th consecutive week but the speculator bets this week sit at a total of -68,544 contracts which is the least bearish level since April 30th. The Canadian dollar exchange rate versus the US dollar dipped this week following four straight weeks of gains that has taken the CADUSD over its 200-day moving average.
The British pound sterling speculator contracts rose strongly again this week (+18,147 contracts) and increased for a third straight week. The overall bullish position standing is back over the +100,000 net contract level after falling below this level in the previous four weeks. The GBP speculator bets recently rose to an all-time most bullish level on record on July 23rd with a total of +142,183 contracts. The top four most bullish levels on record have been in the past few months after eclipsing the previous high of +98,366 contracts that took place way back in July of 2007. The pound sterling exchange rate against the US dollar has been on the uptrend with increases in three out of the past four weeks. Last week, the GBPUSD rose to the best level since March of 2022 above the 1.3280 threshold.
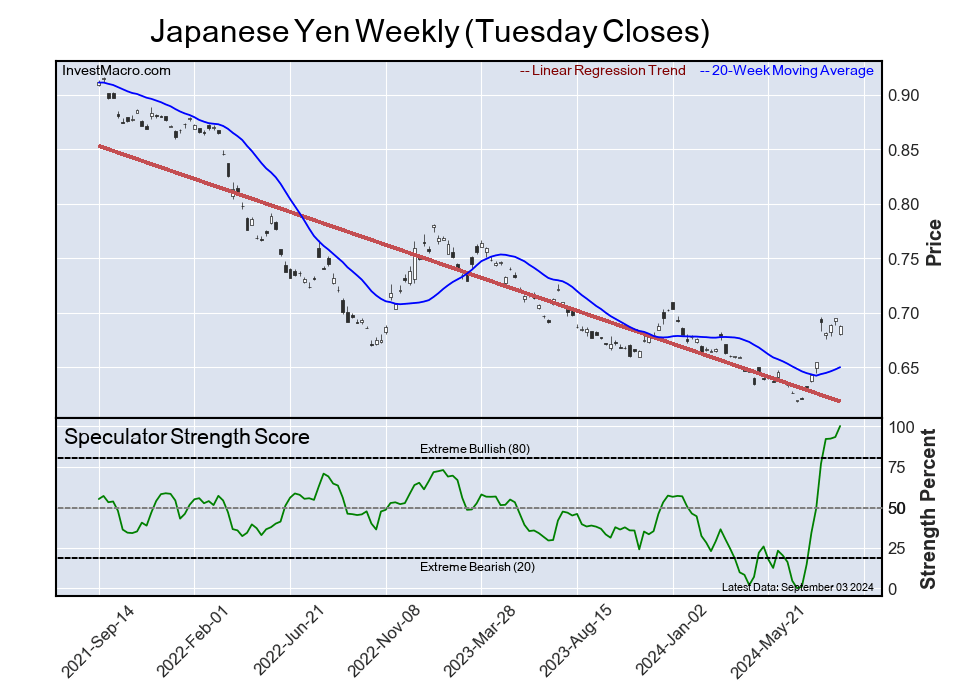
The Japanese yen speculator bets also continued to gain this week and have now advanced for nine straight weeks. The speculative positioning for the yen had fallen to the second most bearish level on July 2nd at a total of -184,223 contracts but since then has seen a sharp turnaround. Over the last nine weeks, a total of +225,339 net contracts have come off that bearish mark and flipped the overall positioning into a bullish level at this week’s standing of +41,116 contracts – the best level since early 2021. The yen exchange rate has risen for six out of the past nine weeks versus the US dollar and is up by over 12 percent in that time-frame.
Currencies Net Speculators Leaderboard
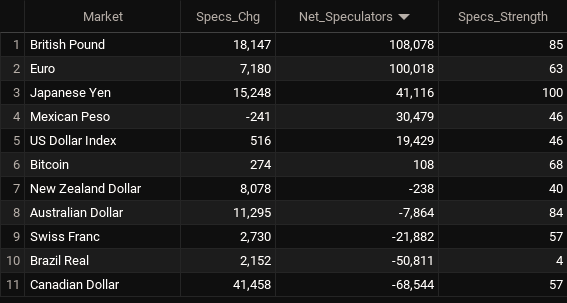
Legend: Weekly Speculators Change | Speculators Current Net Position | Speculators Strength Score compared to last 3-Years (0-100 range)
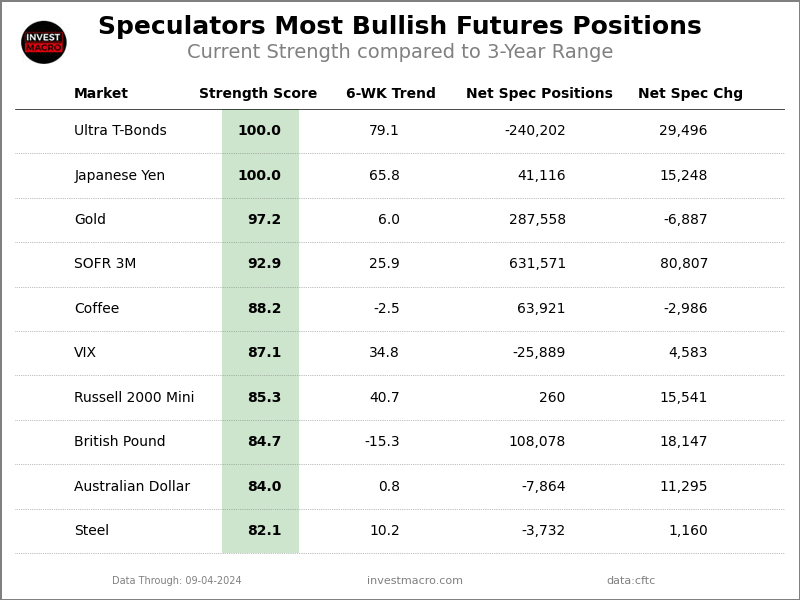
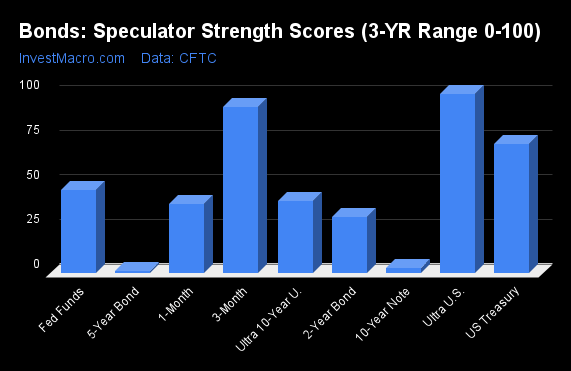
Strength Scores led by Japanese Yen & British Pound
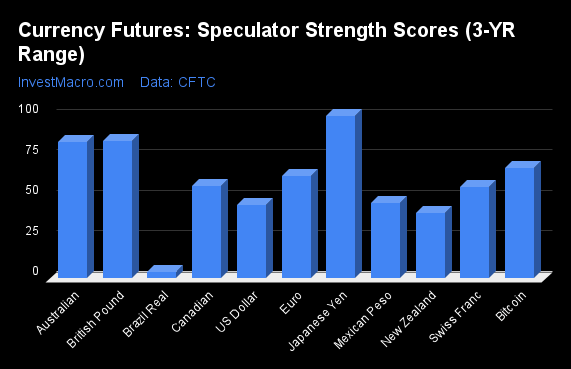
COT Strength Scores (a normalized measure of Speculator positions over a 3-Year range, from 0 to 100 where above 80 is Extreme-Bullish and below 20 is Extreme-Bearish) showed that the Japanese Yen (100 percent) and the British Pound (85 percent) lead the currency markets this week. The Australian Dollar (84 percent), Bitcoin (68 percent) and the EuroFX (63 percent) come in as the next highest in the weekly strength scores.
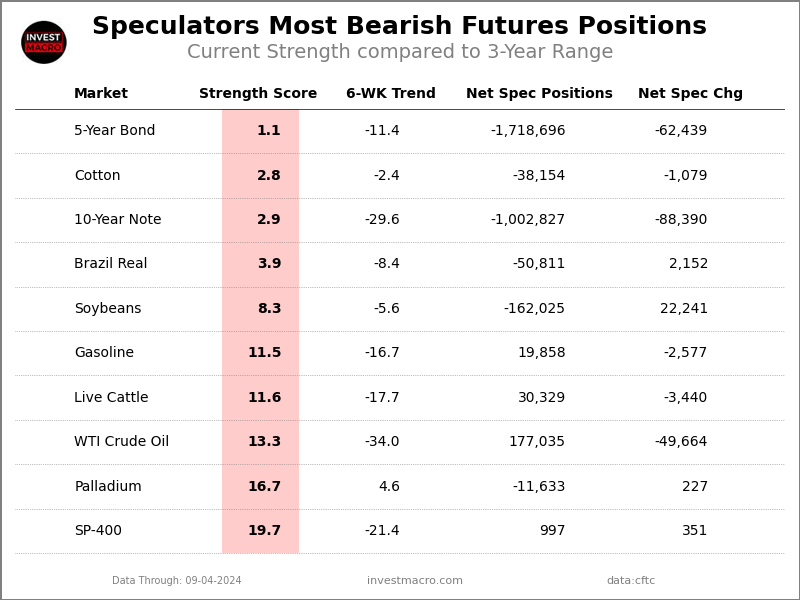
On the downside, the Brazilian Real (4 percent) comes in at the lowest strength levels currently and is in Extreme-Bearish territory (below 20 percent). The next lowest strength scores are the New Zealand Dollar (40 percent), the US Dollar Index (45 percent) and the Mexican Peso (46 percent).
Strength Statistics:
US Dollar Index (45.5 percent) vs US Dollar Index previous week (44.4 percent)
EuroFX (62.9 percent) vs EuroFX previous week (59.9 percent)
British Pound Sterling (84.7 percent) vs British Pound Sterling previous week (76.5 percent)
Japanese Yen (100.0 percent) vs Japanese Yen previous week (93.2 percent)
Swiss Franc (56.5 percent) vs Swiss Franc previous week (51.0 percent)
Canadian Dollar (57.2 percent) vs Canadian Dollar previous week (38.7 percent)
Australian Dollar (84.0 percent) vs Australian Dollar previous week (74.5 percent)
New Zealand Dollar (40.4 percent) vs New Zealand Dollar previous week (24.9 percent)
Mexican Peso (46.4 percent) vs Mexican Peso previous week (46.5 percent)
Brazilian Real (3.9 percent) vs Brazilian Real previous week (1.8 percent)
Bitcoin (68.0 percent) vs Bitcoin previous week (63.9 percent)
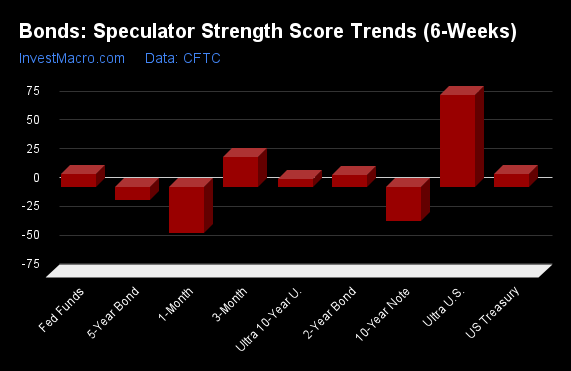
Japanese Yen & Canadian Dollar top the 6-Week Strength Trends
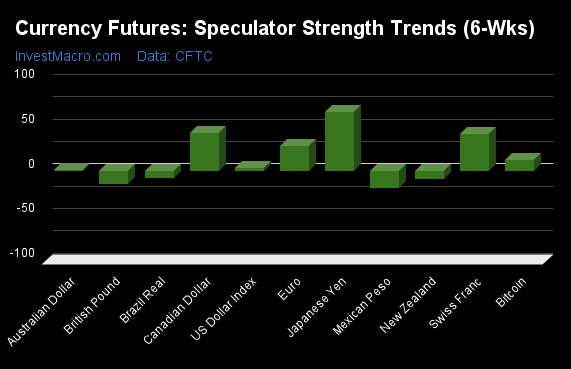
COT Strength Score Trends (or move index, calculates the 6-week changes in strength scores) showed that the Japanese Yen (66 percent) and the Canadian Dollar (42 percent) lead the past six weeks trends for the currencies. The Swiss Franc (41 percent), the EuroFX (27 percent) and Bitcoin (12 percent) are the next highest positive movers in the latest trends data.
The Mexican Peso (-19 percent) leads the downside trend scores currently with the British Pound (-15 percent), the New Zealand Dollar (-9 percent) and the Brazilian Real (-8 percent) following next with lower trend scores.
Strength Trend Statistics:
US Dollar Index (2.6 percent) vs US Dollar Index previous week (0.8 percent)
EuroFX (27.3 percent) vs EuroFX previous week (29.0 percent)
British Pound Sterling (-15.3 percent) vs British Pound Sterling previous week (-19.3 percent)
Japanese Yen (65.8 percent) vs Japanese Yen previous week (78.5 percent)
Swiss Franc (41.2 percent) vs Swiss Franc previous week (51.0 percent)
Canadian Dollar (41.7 percent) vs Canadian Dollar previous week (10.1 percent)
Australian Dollar (0.8 percent) vs Australian Dollar previous week (-25.5 percent)
New Zealand Dollar (-9.1 percent) vs New Zealand Dollar previous week (-40.1 percent)
Mexican Peso (-19.1 percent) vs Mexican Peso previous week (-15.2 percent)
Brazilian Real (-8.4 percent) vs Brazilian Real previous week (-8.0 percent)
Bitcoin (11.6 percent) vs Bitcoin previous week (6.2 percent)
Individual COT Forex Markets:
US Dollar Index Futures:
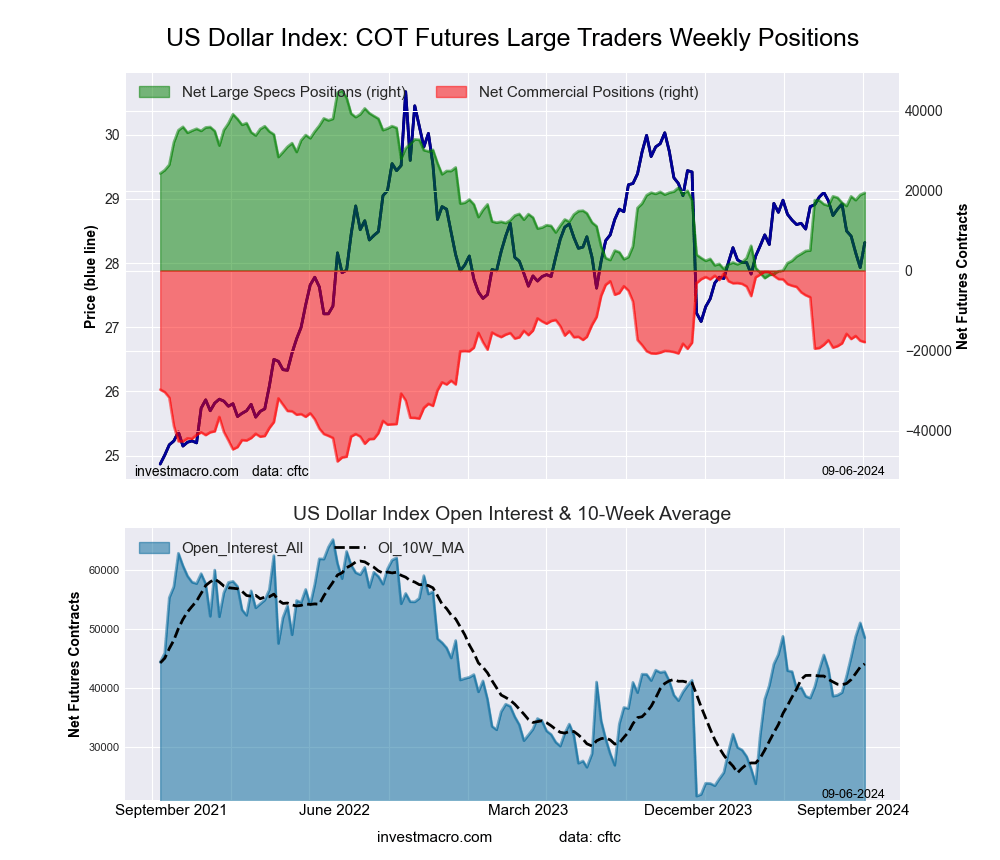 The US Dollar Index large speculator standing this week came in at a net position of 19,429 contracts in the data reported through Tuesday. This was a weekly advance of 516 contracts from the previous week which had a total of 18,913 net contracts.
This week’s current strength score (the trader positioning range over the past three years, measured from 0 to 100) shows the speculators are currently Bearish with a score of 45.5 percent. The commercials are Bullish with a score of 62.9 percent and the small traders (not shown in chart) are Bearish-Extreme with a score of 0.0 percent.
Price Trend-Following Model: Strong Downtrend
Our weekly trend-following model classifies the current market price position as: Strong Downtrend. The current action for the model is considered to be: Hold – Maintain Short Position.
| US DOLLAR INDEX Statistics | SPECULATORS | COMMERCIALS | SMALL TRADERS |
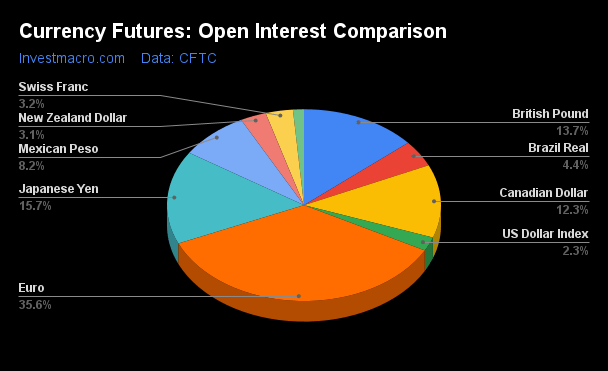
| – Percent of Open Interest Longs: | 71.5 | 20.5 | 4.6 |
| – Percent of Open Interest Shorts: | 31.5 | 57.3 | 7.7 |
| – Net Position: | 19,429 | -17,906 | -1,523 |
| – Gross Longs: | 34,725 | 9,933 | 2,233 |
| – Gross Shorts: | 15,296 | 27,839 | 3,756 |
| – Long to Short Ratio: | 2.3 to 1 | 0.4 to 1 | 0.6 to 1 |
| NET POSITION TREND: | | | |
| – Strength Index Score (3 Year Range Pct): | 45.5 | 62.9 | 0.0 |
| – Strength Index Reading (3 Year Range): | Bearish | Bullish | Bearish-Extreme |
| NET POSITION MOVEMENT INDEX: | | | |
| – 6-Week Change in Strength Index: | 2.6 | 2.1 | -24.2 |
Euro Currency Futures:
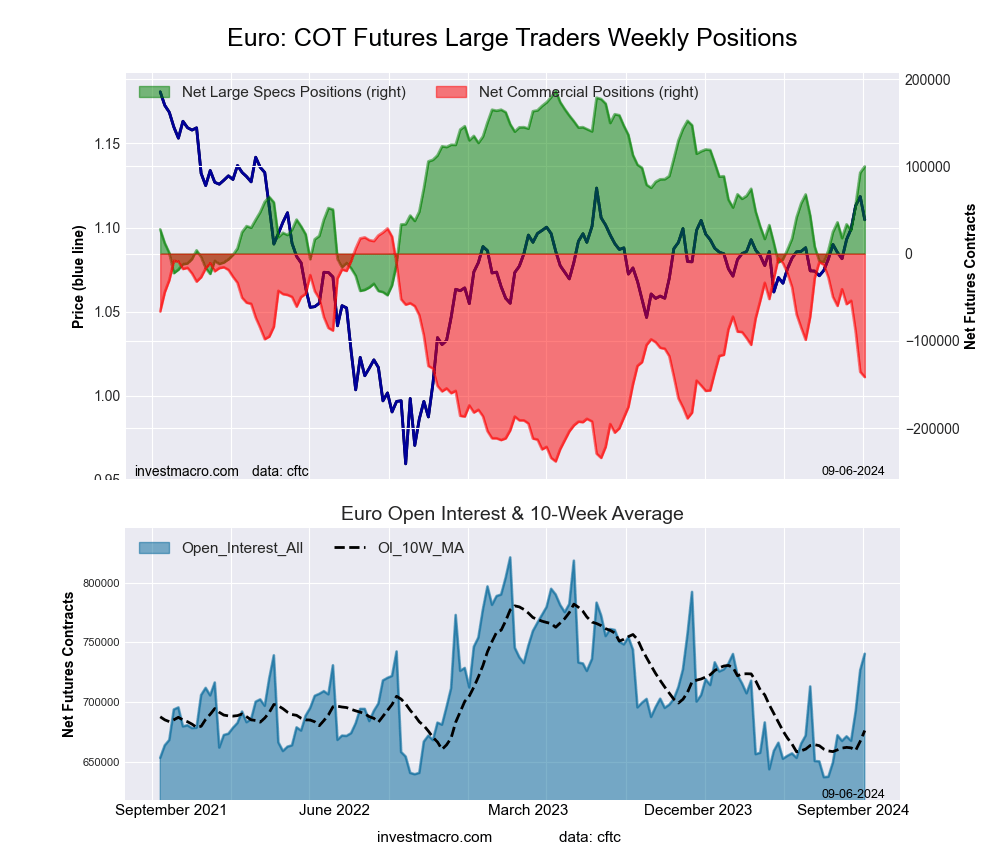 The Euro Currency large speculator standing this week came in at a net position of 100,018 contracts in the data reported through Tuesday. This was a weekly rise of 7,180 contracts from the previous week which had a total of 92,838 net contracts.
This week’s current strength score (the trader positioning range over the past three years, measured from 0 to 100) shows the speculators are currently Bullish with a score of 62.9 percent. The commercials are Bearish with a score of 36.2 percent and the small traders (not shown in chart) are Bullish with a score of 64.7 percent.
Price Trend-Following Model: Strong Uptrend
Our weekly trend-following model classifies the current market price position as: Strong Uptrend. The current action for the model is considered to be: Hold – Maintain Long Position.
| EURO Currency Statistics | SPECULATORS | COMMERCIALS | SMALL TRADERS |
| – Percent of Open Interest Longs: | 29.2 | 54.4 | 11.5 |
| – Percent of Open Interest Shorts: | 15.7 | 73.5 | 5.9 |
| – Net Position: | 100,018 | -141,548 | 41,530 |
| – Gross Longs: | 215,969 | 402,899 | 85,362 |
| – Gross Shorts: | 115,951 | 544,447 | 43,832 |
| – Long to Short Ratio: | 1.9 to 1 | 0.7 to 1 | 1.9 to 1 |
| NET POSITION TREND: | | | |
| – Strength Index Score (3 Year Range Pct): | 62.9 | 36.2 | 64.7 |
| – Strength Index Reading (3 Year Range): | Bullish | Bearish | Bullish |
| NET POSITION MOVEMENT INDEX: | | | |
| – 6-Week Change in Strength Index: | 27.3 | -30.6 | 40.0 |
British Pound Sterling Futures:
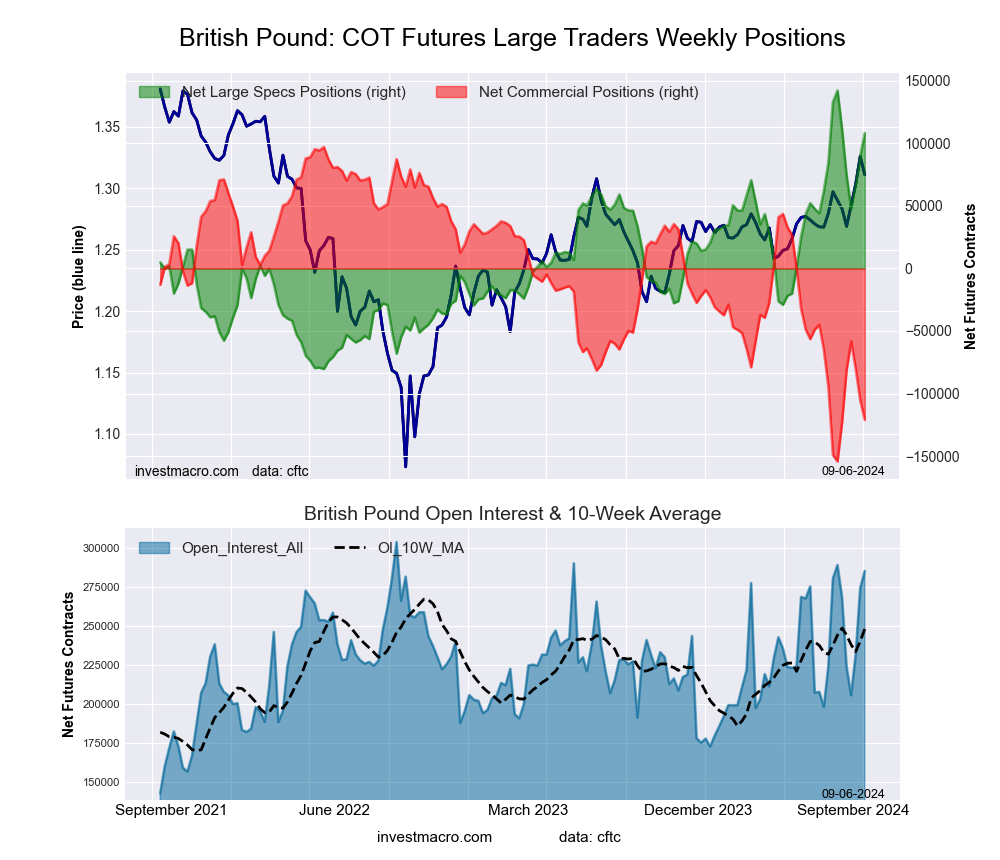 The British Pound Sterling large speculator standing this week came in at a net position of 108,078 contracts in the data reported through Tuesday. This was a weekly rise of 18,147 contracts from the previous week which had a total of 89,931 net contracts.
This week’s current strength score (the trader positioning range over the past three years, measured from 0 to 100) shows the speculators are currently Bullish-Extreme with a score of 84.7 percent. The commercials are Bearish-Extreme with a score of 13.3 percent and the small traders (not shown in chart) are Bullish-Extreme with a score of 89.3 percent.
Price Trend-Following Model: Strong Uptrend
Our weekly trend-following model classifies the current market price position as: Strong Uptrend. The current action for the model is considered to be: Hold – Maintain Long Position.
| BRITISH POUND Statistics | SPECULATORS | COMMERCIALS | SMALL TRADERS |
| – Percent of Open Interest Longs: | 56.3 | 24.5 | 13.9 |
| – Percent of Open Interest Shorts: | 18.5 | 66.9 | 9.4 |
| – Net Position: | 108,078 | -120,955 | 12,877 |
| – Gross Longs: | 160,773 | 69,973 | 39,617 |
| – Gross Shorts: | 52,695 | 190,928 | 26,740 |
| – Long to Short Ratio: | 3.1 to 1 | 0.4 to 1 | 1.5 to 1 |
| NET POSITION TREND: | | | |
| – Strength Index Score (3 Year Range Pct): | 84.7 | 13.3 | 89.3 |
| – Strength Index Reading (3 Year Range): | Bullish-Extreme | Bearish-Extreme | Bullish-Extreme |
| NET POSITION MOVEMENT INDEX: | | | |
| – 6-Week Change in Strength Index: | -15.3 | 13.3 | 1.7 |
Japanese Yen Futures:
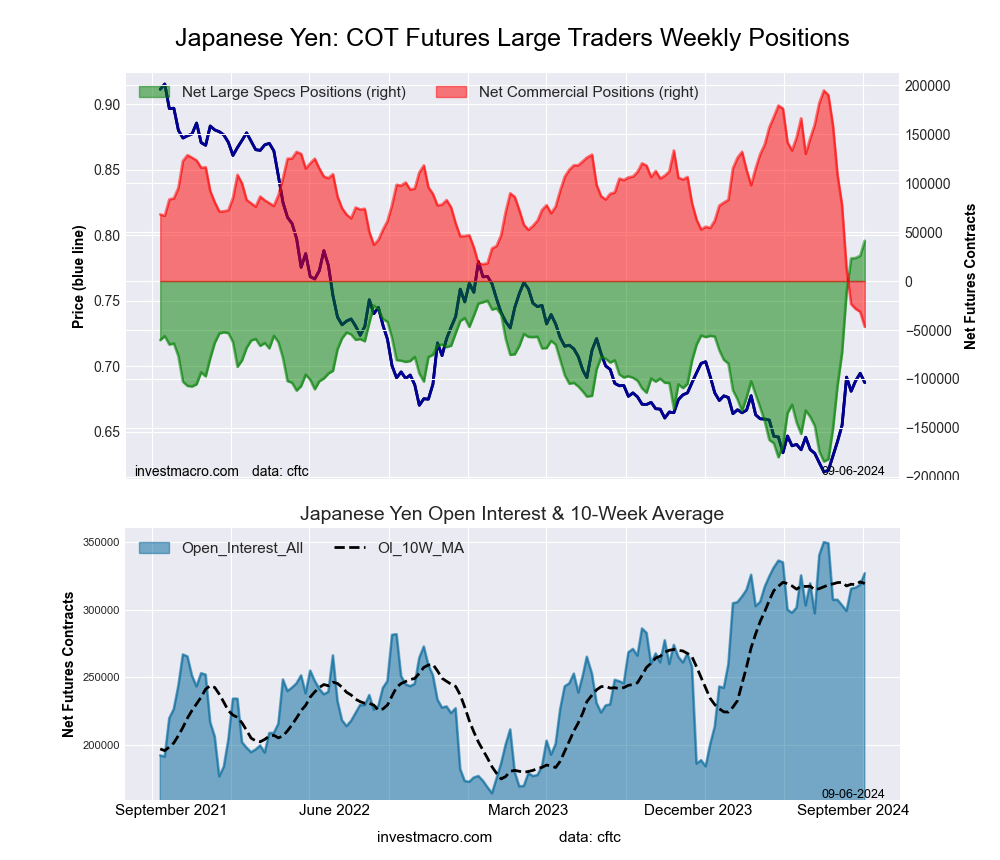 The Japanese Yen large speculator standing this week came in at a net position of 41,116 contracts in the data reported through Tuesday. This was a weekly gain of 15,248 contracts from the previous week which had a total of 25,868 net contracts.
This week’s current strength score (the trader positioning range over the past three years, measured from 0 to 100) shows the speculators are currently Bullish-Extreme with a score of 100.0 percent. The commercials are Bearish-Extreme with a score of 0.0 percent and the small traders (not shown in chart) are Bullish-Extreme with a score of 100.0 percent.
Price Trend-Following Model: Strong Uptrend
Our weekly trend-following model classifies the current market price position as: Strong Uptrend. The current action for the model is considered to be: Hold – Maintain Long Position.
| JAPANESE YEN Statistics | SPECULATORS | COMMERCIALS | SMALL TRADERS |
| – Percent of Open Interest Longs: | 28.1 | 57.9 | 11.7 |
| – Percent of Open Interest Shorts: | 15.5 | 72.2 | 9.9 |
| – Net Position: | 41,116 | -46,765 | 5,649 |
| – Gross Longs: | 91,791 | 189,291 | 38,134 |
| – Gross Shorts: | 50,675 | 236,056 | 32,485 |
| – Long to Short Ratio: | 1.8 to 1 | 0.8 to 1 | 1.2 to 1 |
| NET POSITION TREND: | | | |
| – Strength Index Score (3 Year Range Pct): | 100.0 | 0.0 | 100.0 |
| – Strength Index Reading (3 Year Range): | Bullish-Extreme | Bearish-Extreme | Bullish-Extreme |
| NET POSITION MOVEMENT INDEX: | | | |
| – 6-Week Change in Strength Index: | 65.8 | -64.5 | 22.9 |
Swiss Franc Futures:
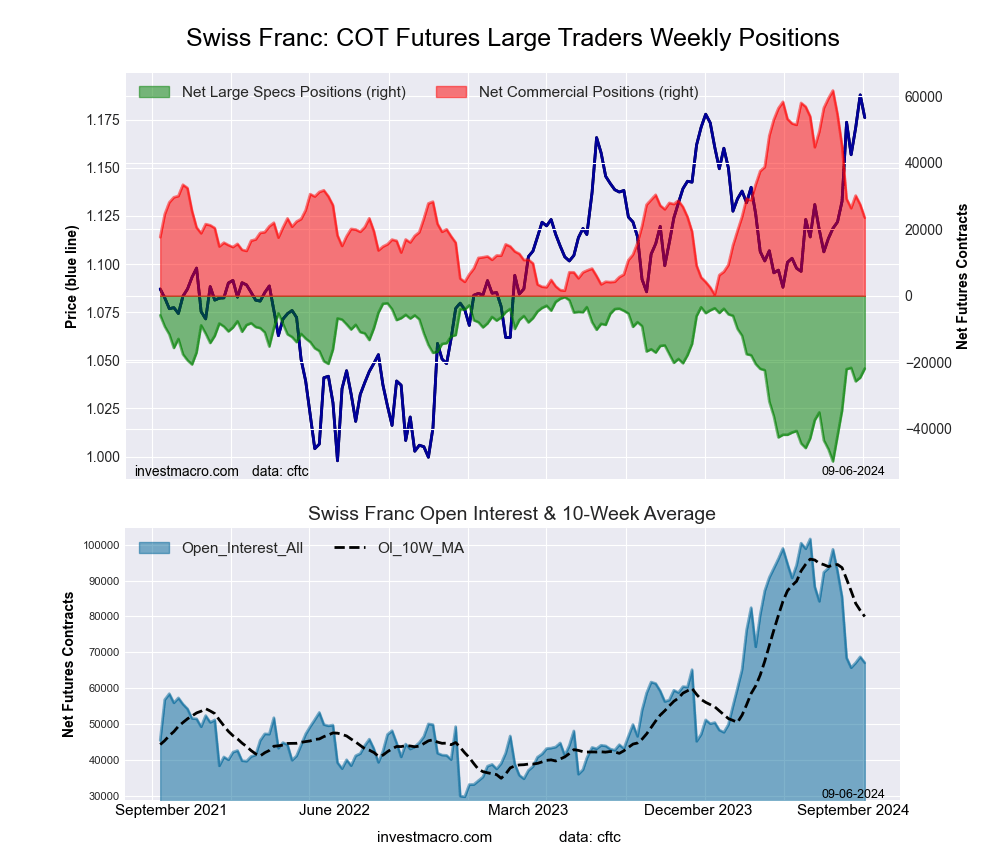 The Swiss Franc large speculator standing this week came in at a net position of -21,882 contracts in the data reported through Tuesday. This was a weekly advance of 2,730 contracts from the previous week which had a total of -24,612 net contracts.
This week’s current strength score (the trader positioning range over the past three years, measured from 0 to 100) shows the speculators are currently Bullish with a score of 56.5 percent. The commercials are Bearish with a score of 37.7 percent and the small traders (not shown in chart) are Bullish with a score of 70.2 percent.
Price Trend-Following Model: Strong Uptrend
Our weekly trend-following model classifies the current market price position as: Strong Uptrend. The current action for the model is considered to be: Hold – Maintain Long Position.
| SWISS FRANC Statistics | SPECULATORS | COMMERCIALS | SMALL TRADERS |
| – Percent of Open Interest Longs: | 13.1 | 62.9 | 20.9 |
| – Percent of Open Interest Shorts: | 45.7 | 28.0 | 23.3 |
| – Net Position: | -21,882 | 23,439 | -1,557 |
| – Gross Longs: | 8,822 | 42,236 | 14,057 |
| – Gross Shorts: | 30,704 | 18,797 | 15,614 |
| – Long to Short Ratio: | 0.3 to 1 | 2.2 to 1 | 0.9 to 1 |
| NET POSITION TREND: | | | |
| – Strength Index Score (3 Year Range Pct): | 56.5 | 37.7 | 70.2 |
| – Strength Index Reading (3 Year Range): | Bullish | Bearish | Bullish |
| NET POSITION MOVEMENT INDEX: | | | |
| – 6-Week Change in Strength Index: | 41.2 | -50.7 | 49.0 |
Canadian Dollar Futures:
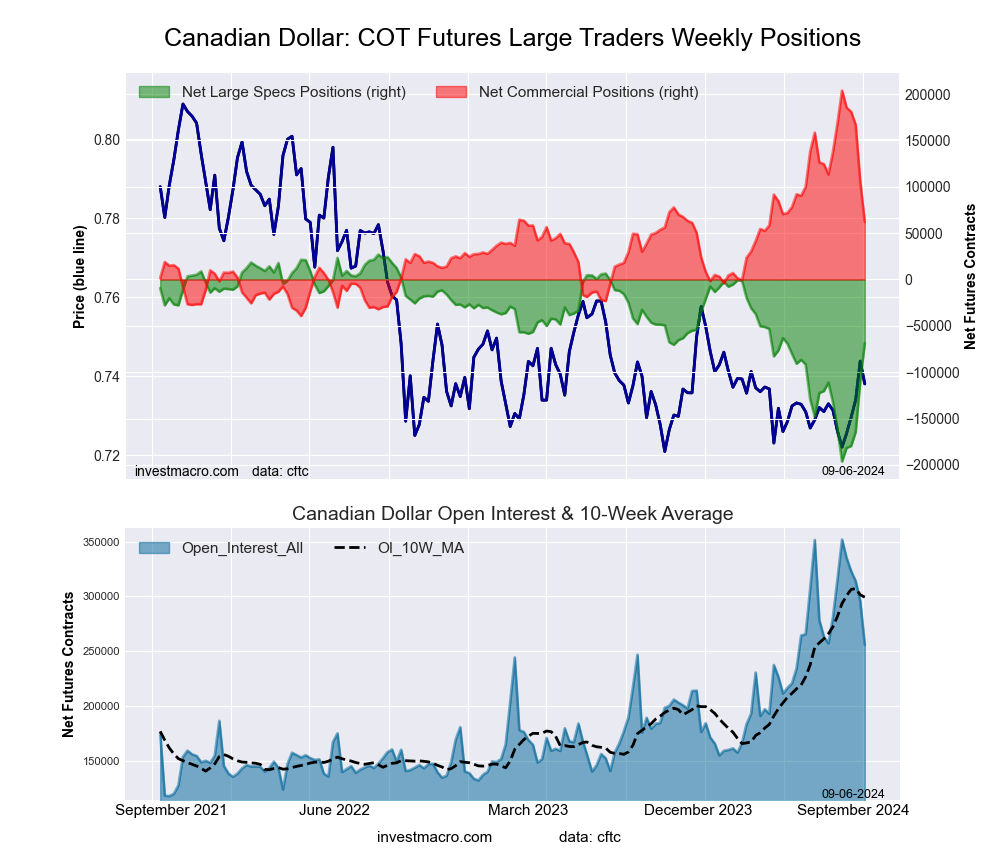 The Canadian Dollar large speculator standing this week came in at a net position of -68,544 contracts in the data reported through Tuesday. This was a weekly rise of 41,458 contracts from the previous week which had a total of -110,002 net contracts.
This week’s current strength score (the trader positioning range over the past three years, measured from 0 to 100) shows the speculators are currently Bullish with a score of 57.2 percent. The commercials are Bearish with a score of 41.7 percent and the small traders (not shown in chart) are Bullish with a score of 50.0 percent.
Price Trend-Following Model: Strong Uptrend
Our weekly trend-following model classifies the current market price position as: Strong Uptrend. The current action for the model is considered to be: Hold – Maintain Long Position.
| CANADIAN DOLLAR Statistics | SPECULATORS | COMMERCIALS | SMALL TRADERS |
| – Percent of Open Interest Longs: | 12.3 | 69.7 | 13.2 |
| – Percent of Open Interest Shorts: | 39.1 | 45.5 | 10.6 |
| – Net Position: | -68,544 | 62,013 | 6,531 |
| – Gross Longs: | 31,460 | 178,469 | 33,726 |
| – Gross Shorts: | 100,004 | 116,456 | 27,195 |
| – Long to Short Ratio: | 0.3 to 1 | 1.5 to 1 | 1.2 to 1 |
| NET POSITION TREND: | | | |
| – Strength Index Score (3 Year Range Pct): | 57.2 | 41.7 | 50.0 |
| – Strength Index Reading (3 Year Range): | Bullish | Bearish | Bullish |
| NET POSITION MOVEMENT INDEX: | | | |
| – 6-Week Change in Strength Index: | 41.7 | -43.9 | 40.0 |
Australian Dollar Futures:
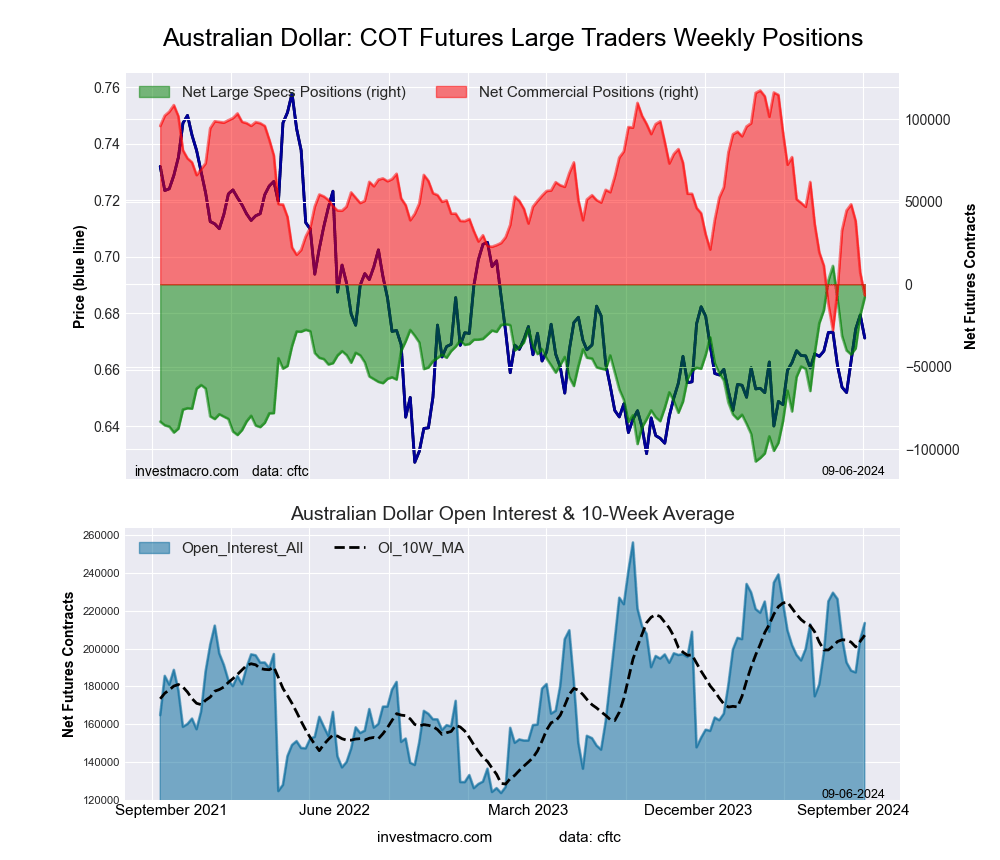 The Australian Dollar large speculator standing this week came in at a net position of -7,864 contracts in the data reported through Tuesday. This was a weekly boost of 11,295 contracts from the previous week which had a total of -19,159 net contracts.
This week’s current strength score (the trader positioning range over the past three years, measured from 0 to 100) shows the speculators are currently Bullish-Extreme with a score of 84.0 percent. The commercials are Bearish-Extreme with a score of 14.5 percent and the small traders (not shown in chart) are Bullish-Extreme with a score of 94.2 percent.
Price Trend-Following Model: Uptrend
Our weekly trend-following model classifies the current market price position as: Uptrend. The current action for the model is considered to be: Hold – Maintain Long Position.
| AUSTRALIAN DOLLAR Statistics | SPECULATORS | COMMERCIALS | SMALL TRADERS |
| – Percent of Open Interest Longs: | 40.8 | 40.9 | 14.9 |
| – Percent of Open Interest Shorts: | 44.5 | 44.1 | 8.0 |
| – Net Position: | -7,864 | -6,812 | 14,676 |
| – Gross Longs: | 87,118 | 87,254 | 31,865 |
| – Gross Shorts: | 94,982 | 94,066 | 17,189 |
| – Long to Short Ratio: | 0.9 to 1 | 0.9 to 1 | 1.9 to 1 |
| NET POSITION TREND: | | | |
| – Strength Index Score (3 Year Range Pct): | 84.0 | 14.5 | 94.2 |
| – Strength Index Reading (3 Year Range): | Bullish-Extreme | Bearish-Extreme | Bullish-Extreme |
| NET POSITION MOVEMENT INDEX: | | | |
| – 6-Week Change in Strength Index: | 0.8 | -1.9 | 5.0 |
New Zealand Dollar Futures:
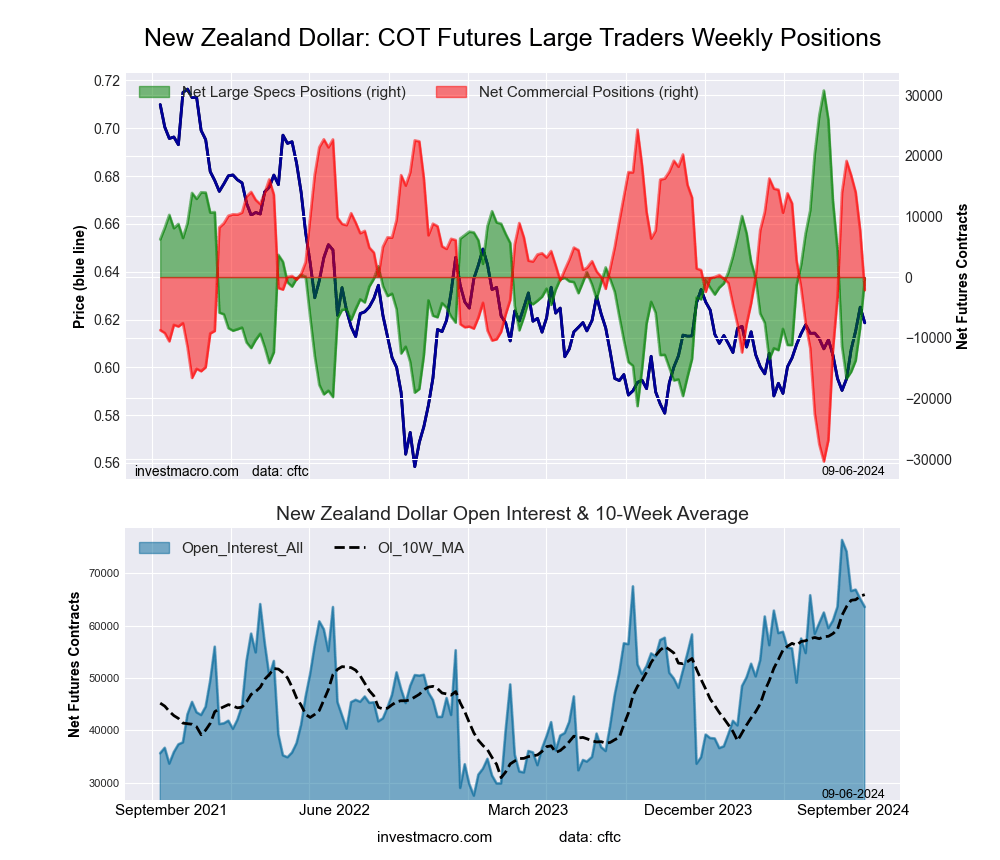 The New Zealand Dollar large speculator standing this week came in at a net position of -238 contracts in the data reported through Tuesday. This was a weekly gain of 8,078 contracts from the previous week which had a total of -8,316 net contracts.
This week’s current strength score (the trader positioning range over the past three years, measured from 0 to 100) shows the speculators are currently Bearish with a score of 40.4 percent. The commercials are Bullish with a score of 51.6 percent and the small traders (not shown in chart) are Bullish-Extreme with a score of 91.8 percent.
Price Trend-Following Model: Strong Uptrend
Our weekly trend-following model classifies the current market price position as: Strong Uptrend. The current action for the model is considered to be: Hold – Maintain Long Position.
| NEW ZEALAND DOLLAR Statistics | SPECULATORS | COMMERCIALS | SMALL TRADERS |
| – Percent of Open Interest Longs: | 39.7 | 47.8 | 9.6 |
| – Percent of Open Interest Shorts: | 40.1 | 51.2 | 5.9 |
| – Net Position: | -238 | -2,156 | 2,394 |
| – Gross Longs: | 25,235 | 30,379 | 6,120 |
| – Gross Shorts: | 25,473 | 32,535 | 3,726 |
| – Long to Short Ratio: | 1.0 to 1 | 0.9 to 1 | 1.6 to 1 |
| NET POSITION TREND: | | | |
| – Strength Index Score (3 Year Range Pct): | 40.4 | 51.6 | 91.8 |
| – Strength Index Reading (3 Year Range): | Bearish | Bullish | Bullish-Extreme |
| NET POSITION MOVEMENT INDEX: | | | |
| – 6-Week Change in Strength Index: | -9.1 | 2.1 | 50.4 |
Mexican Peso Futures:
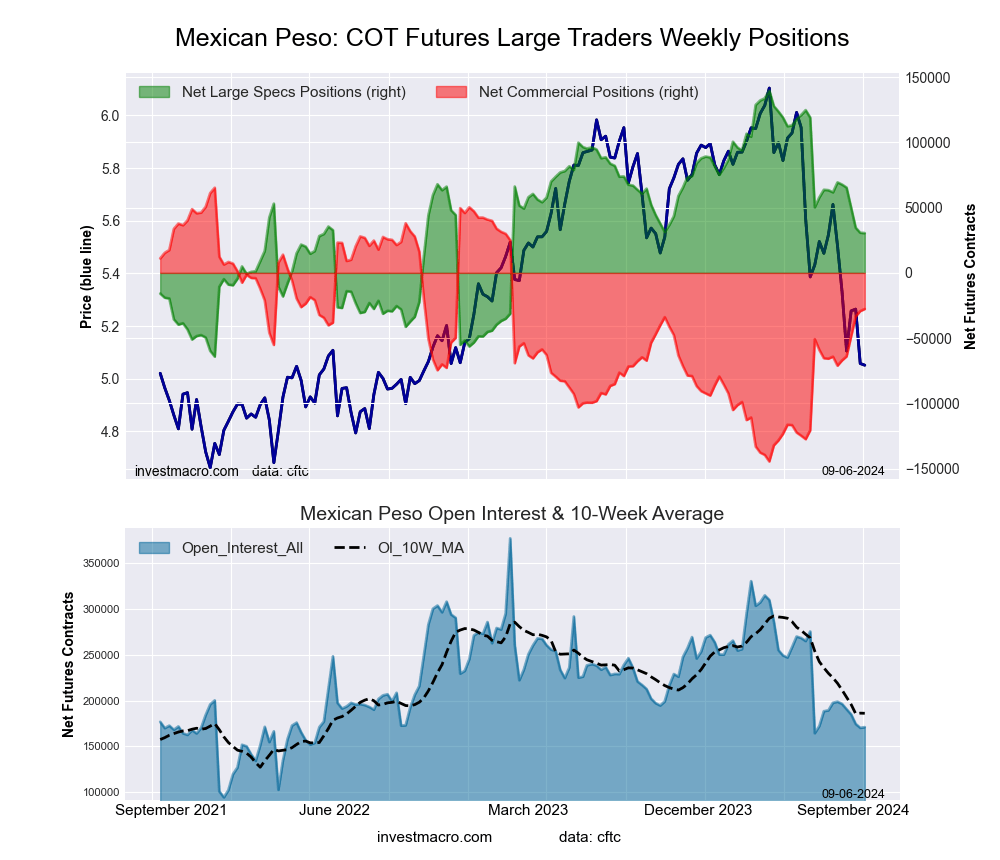 The Mexican Peso large speculator standing this week came in at a net position of 30,479 contracts in the data reported through Tuesday. This was a weekly decrease of -241 contracts from the previous week which had a total of 30,720 net contracts.
This week’s current strength score (the trader positioning range over the past three years, measured from 0 to 100) shows the speculators are currently Bearish with a score of 46.4 percent. The commercials are Bullish with a score of 55.7 percent and the small traders (not shown in chart) are Bearish-Extreme with a score of 0.0 percent.
Price Trend-Following Model: Strong Downtrend
Our weekly trend-following model classifies the current market price position as: Strong Downtrend. The current action for the model is considered to be: Hold – Maintain Short Position.
| MEXICAN PESO Statistics | SPECULATORS | COMMERCIALS | SMALL TRADERS |
| – Percent of Open Interest Longs: | 36.9 | 57.5 | 2.0 |
| – Percent of Open Interest Shorts: | 19.1 | 73.7 | 3.7 |
| – Net Position: | 30,479 | -27,678 | -2,801 |
| – Gross Longs: | 63,103 | 98,278 | 3,503 |
| – Gross Shorts: | 32,624 | 125,956 | 6,304 |
| – Long to Short Ratio: | 1.9 to 1 | 0.8 to 1 | 0.6 to 1 |
| NET POSITION TREND: | | | |
| – Strength Index Score (3 Year Range Pct): | 46.4 | 55.7 | 0.0 |
| – Strength Index Reading (3 Year Range): | Bearish | Bullish | Bearish-Extreme |
| NET POSITION MOVEMENT INDEX: | | | |
| – 6-Week Change in Strength Index: | -19.1 | 20.7 | -27.3 |
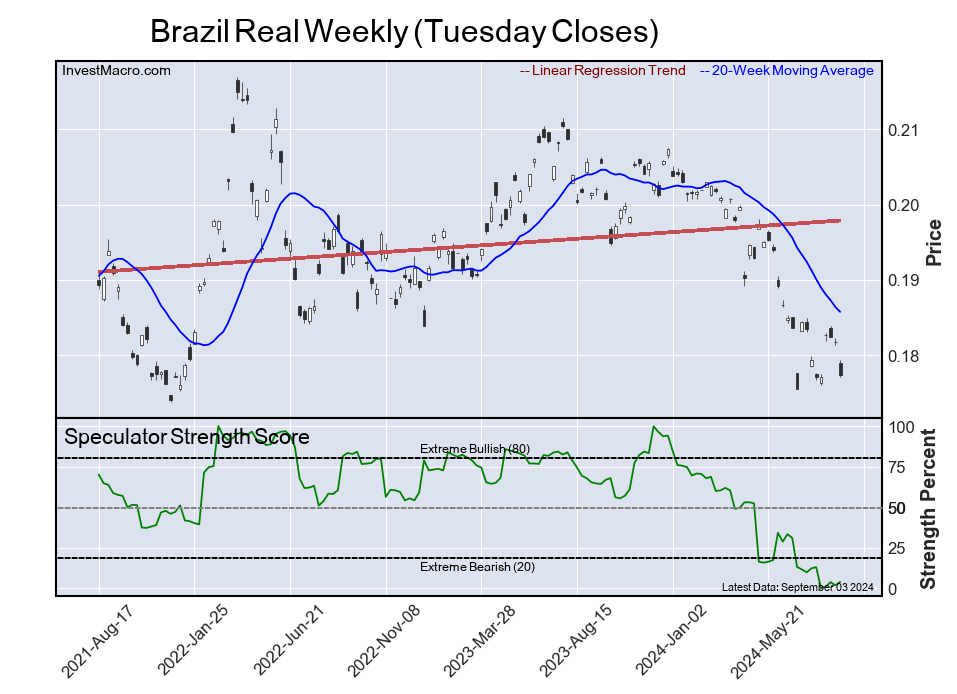
Brazilian Real Futures:
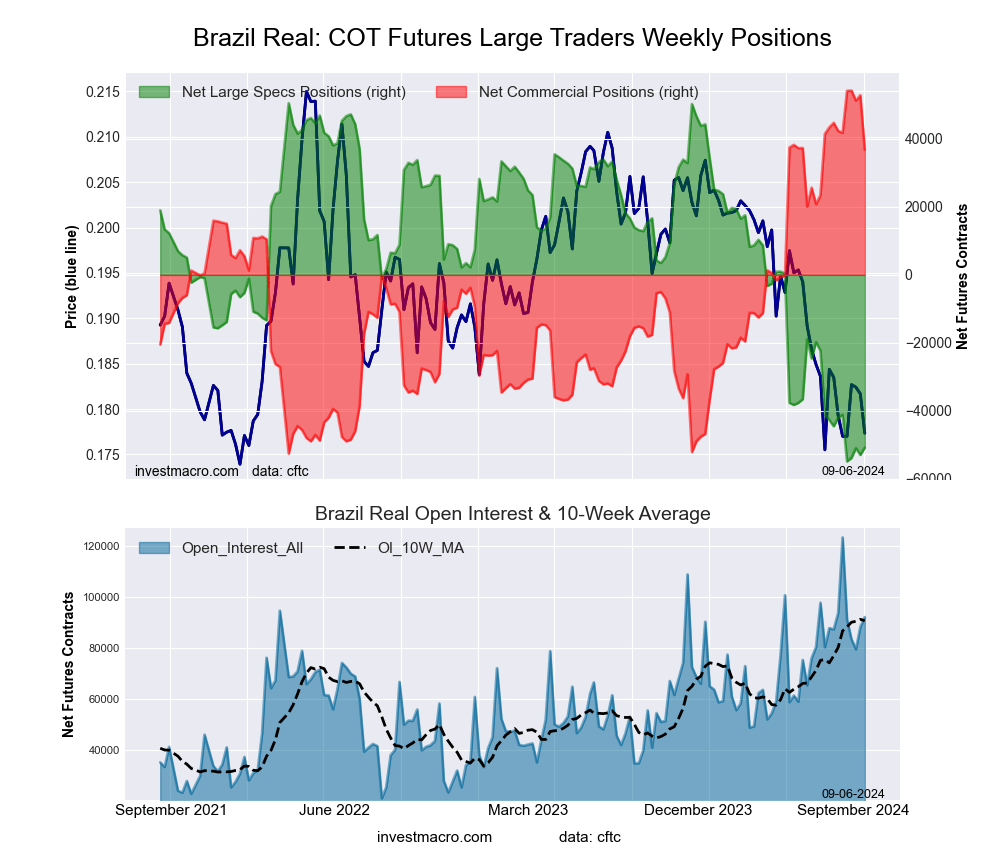 The Brazilian Real large speculator standing this week came in at a net position of -50,811 contracts in the data reported through Tuesday. This was a weekly gain of 2,152 contracts from the previous week which had a total of -52,963 net contracts.
This week’s current strength score (the trader positioning range over the past three years, measured from 0 to 100) shows the speculators are currently Bearish-Extreme with a score of 3.9 percent. The commercials are Bullish-Extreme with a score of 83.7 percent and the small traders (not shown in chart) are Bullish-Extreme with a score of 100.0 percent.
Price Trend-Following Model: Downtrend
Our weekly trend-following model classifies the current market price position as: Downtrend. The current action for the model is considered to be: Hold – Maintain Short Position.
| BRAZIL REAL Statistics | SPECULATORS | COMMERCIALS | SMALL TRADERS |
| – Percent of Open Interest Longs: | 13.2 | 60.9 | 18.2 |
| – Percent of Open Interest Shorts: | 68.4 | 20.9 | 3.0 |
| – Net Position: | -50,811 | 36,778 | 14,033 |
| – Gross Longs: | 12,179 | 56,038 | 16,766 |
| – Gross Shorts: | 62,990 | 19,260 | 2,733 |
| – Long to Short Ratio: | 0.2 to 1 | 2.9 to 1 | 6.1 to 1 |
| NET POSITION TREND: | | | |
| – Strength Index Score (3 Year Range Pct): | 3.9 | 83.7 | 100.0 |
| – Strength Index Reading (3 Year Range): | Bearish-Extreme | Bullish-Extreme | Bullish-Extreme |
| NET POSITION MOVEMENT INDEX: | | | |
| – 6-Week Change in Strength Index: | -8.4 | -5.2 | 81.1 |
Bitcoin Futures:
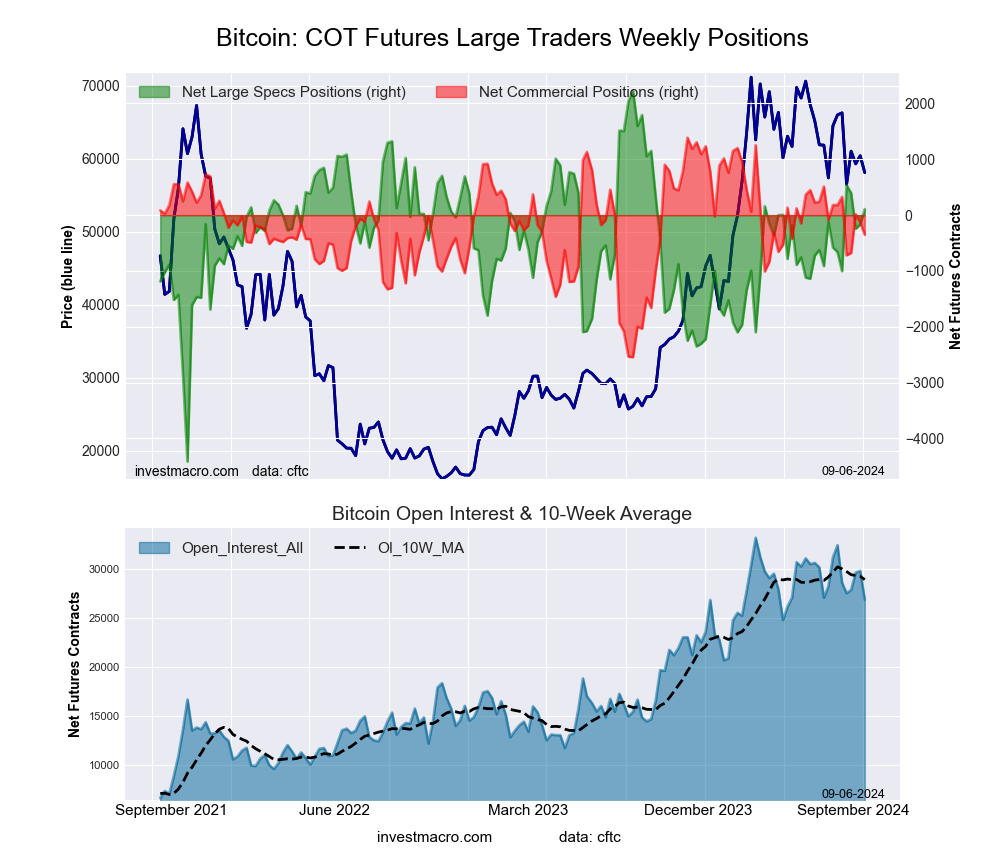 The Bitcoin large speculator standing this week came in at a net position of 108 contracts in the data reported through Tuesday. This was a weekly increase of 274 contracts from the previous week which had a total of -166 net contracts.
This week’s current strength score (the trader positioning range over the past three years, measured from 0 to 100) shows the speculators are currently Bullish with a score of 68.0 percent. The commercials are Bullish with a score of 55.8 percent and the small traders (not shown in chart) are Bearish-Extreme with a score of 18.5 percent.
Price Trend-Following Model: Strong Downtrend
Our weekly trend-following model classifies the current market price position as: Strong Downtrend. The current action for the model is considered to be: Hold – Maintain Short Position.
| BITCOIN Statistics | SPECULATORS | COMMERCIALS | SMALL TRADERS |
| – Percent of Open Interest Longs: | 86.9 | 3.7 | 4.0 |
| – Percent of Open Interest Shorts: | 86.5 | 5.0 | 3.1 |
| – Net Position: | 108 | -351 | 243 |
| – Gross Longs: | 23,349 | 998 | 1,067 |
| – Gross Shorts: | 23,241 | 1,349 | 824 |
| – Long to Short Ratio: | 1.0 to 1 | 0.7 to 1 | 1.3 to 1 |
| NET POSITION TREND: | | | |
| – Strength Index Score (3 Year Range Pct): | 68.0 | 55.8 | 18.5 |
| – Strength Index Reading (3 Year Range): | Bullish | Bullish | Bearish-Extreme |
| NET POSITION MOVEMENT INDEX: | | | |
| – 6-Week Change in Strength Index: | 11.6 | -13.6 | -5.4 |
Article By InvestMacro – Receive our weekly COT Newsletter
*COT Report: The COT data, released weekly to the public each Friday, is updated through the most recent Tuesday (data is 3 days old) and shows a quick view of how large speculators or non-commercials (for-profit traders) were positioned in the futures markets.
The CFTC categorizes trader positions according to commercial hedgers (traders who use futures contracts for hedging as part of the business), non-commercials (large traders who speculate to realize trading profits) and nonreportable traders (usually small traders/speculators) as well as their open interest (contracts open in the market at time of reporting). See CFTC criteria here.