By InvestMacro
Here are the latest charts and statistics for the Commitment of Traders (COT) data published by the Commodities Futures Trading Commission (CFTC).
The latest COT data is updated through Tuesday August 27th and shows a quick view of how large market participants (for-profit speculators and commercial traders) were positioned in the futures markets. All currency positions are in direct relation to the US dollar where, for example, a bet for the euro is a bet that the euro will rise versus the dollar while a bet against the euro will be a bet that the euro will decline versus the dollar.
Weekly Speculator Changes led by Canadian Dollar & Euro
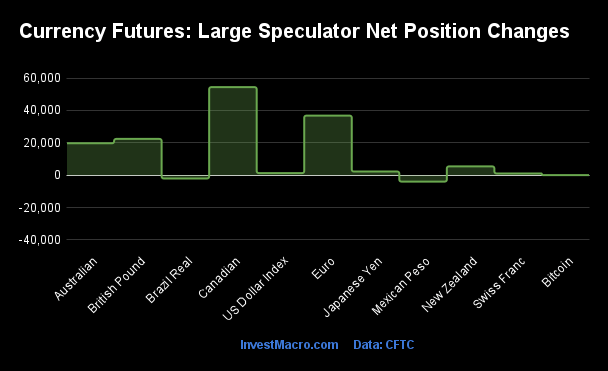
The COT currency market speculator bets were decidedly higher this week as nine out of the eleven currency markets we cover had higher positioning while two markets had lower speculator contracts.
Leading the gains for the currency markets was the Canadian Dollar (54,408 contracts) with the EuroFX (36,821 contracts), the British Pound (22,420 contracts), the Australian Dollar (19,726 contracts), the New Zealand Dollar (5,453 contracts), the Japanese Yen (2,283 contracts), the Swiss Franc (1,102 contracts), the US Dollar Index (1,322 contracts) and Bitcoin (77 contracts) also showing positive weeks.
The only currencies seeing declines in speculator bets were the Mexican Peso (-3,926 contracts) and the Brazilian Real (-2,008 contracts) also registering lower bets on the week.
Speculators boost Canadian Dollar and Euro bets
Highlighting the COT currency’s data this week is the sharp paring of the bearish bets in the Canadian dollar and the pushing higher of the Euro position to the best level in over seven months. Both currencies are potentially benefiting from the speculator’s views the US dollar will weaken with the US Federal Reserve starting on an interest rate cutting cycle.
Large speculative Canadian dollar positions rose this week by the highest weekly amount on record with a huge jump by +54,408 contracts. This week’s record gain surpasses the previous record weekly increase of +36,590 contracts that took place on March 25th of 2014.
This was the fourth straight weekly increase in speculator bets and brings the current speculator standing to a total of -110,002 contracts. The speculator sentiment has now been in a continuous bearish position for fifty-six straight weeks and recently hit the most bearish level on record at a total of -196,263 contracts on July 30th. Since then, the position rebound has been strong and swift – taking a total of 86,251 net contracts off that bearish record level.
The CAD exchange rate has been on the rise as well with the CAD gaining for the past four consecutive weeks against the US dollar. Currently, the CAD is testing a multi-year down-trending line that started in May/June of 2021 versus the USD and is on pace for over a 2 percent gain over the month of August.
Meanwhile, the Euro bets got a boost by +36,821 contracts this week following last week’s +29,034 contract gain. Euro bets have risen in six out of the past eight weeks for a total eight-week increase of +102,357 contracts. The current speculator positioning is now at a total of +92,838 contracts – the most bullish position since January 16th and only nine weeks after the last bearish position (July 2nd).
The Euro exchange versus the US dollar had risen for three out of the past four weeks before declining this week by over 1 percent. The currency closed at 1.1059 on Friday and is currently trading right as it’s 200-week moving average. The Euro is on pace to increase by just under 2 percent in the month of August.
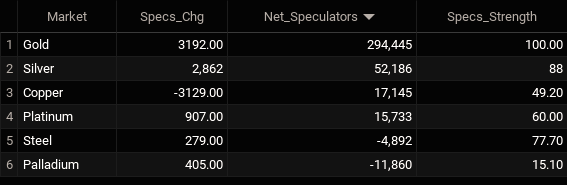
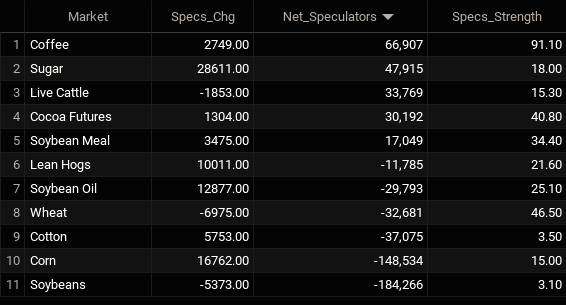
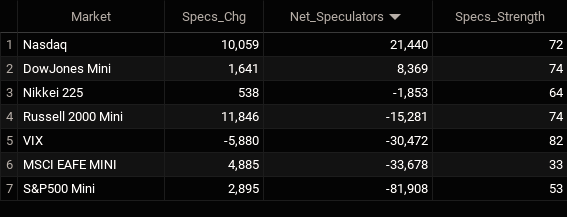
Currencies Net Speculators Leaderboard
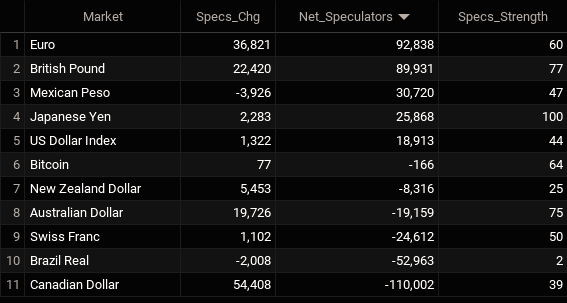
Legend: Weekly Speculators Change | Speculators Current Net Position | Speculators Strength Score compared to last 3-Years (0-100 range)
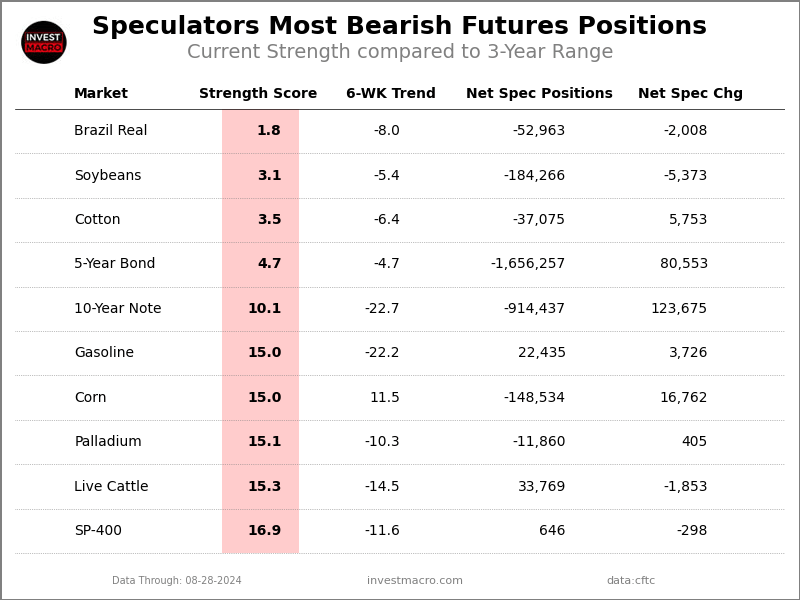
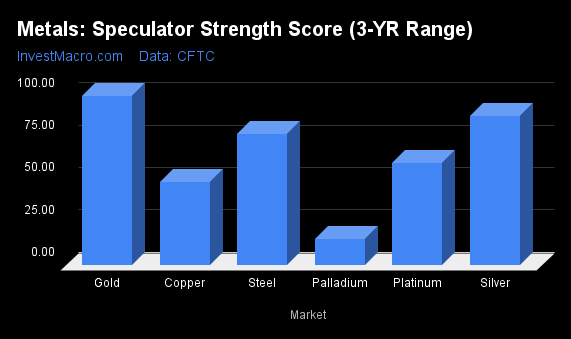
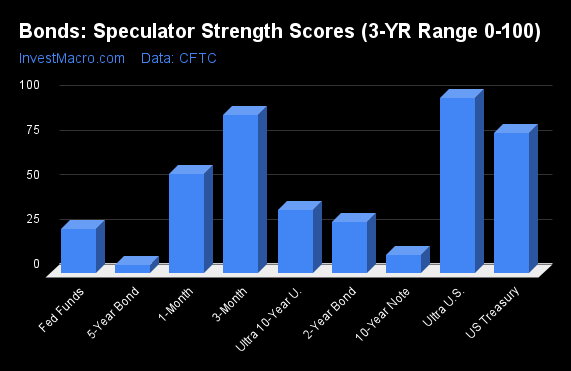
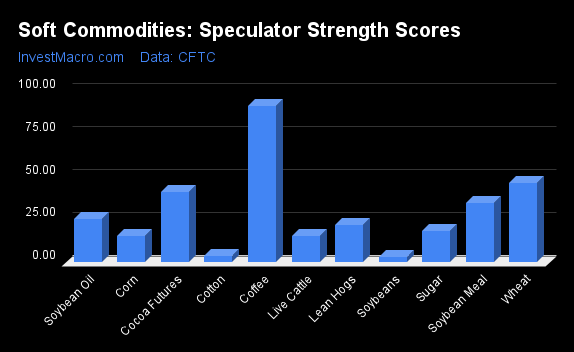
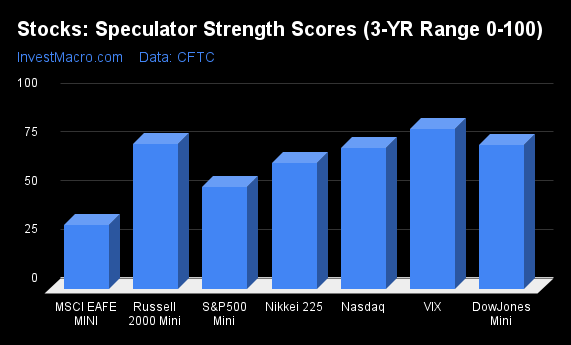
Strength Scores led by Japanese Yen & British Pound
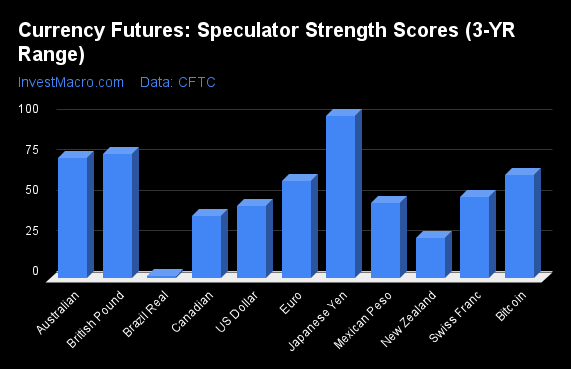
COT Strength Scores (a normalized measure of Speculator positions over a 3-Year range, from 0 to 100 where above 80 is Extreme-Bullish and below 20 is Extreme-Bearish) showed that the Japanese Yen (100 percent) led the currency markets this week. The British Pound (77 percent), the Australian Dollar (74 percent), Bitcoin (64 percent) and the EuroFX (60 percent) came in as the next highest in the weekly strength scores.
On the downside, the Brazilian Real (2 percent) comes in at the lowest strength levels currently and is in Extreme-Bearish territory (below 20 percent). The next lowest strength scores are the New Zealand Dollar (25 percent) and the US Dollar Index (44 percent).
Strength Statistics:
US Dollar Index (44.4 percent) vs US Dollar Index previous week (41.5 percent)
EuroFX (59.9 percent) vs EuroFX previous week (44.2 percent)
British Pound Sterling (76.5 percent) vs British Pound Sterling previous week (66.4 percent)
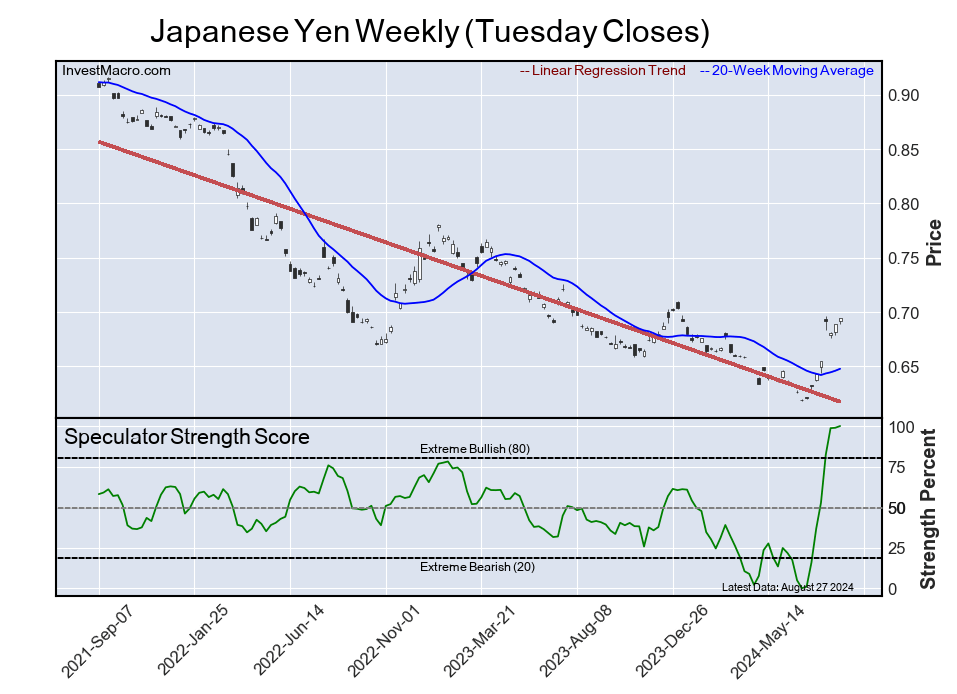
Japanese Yen (100.0 percent) vs Japanese Yen previous week (98.9 percent)
Swiss Franc (50.3 percent) vs Swiss Franc previous week (48.1 percent)
Canadian Dollar (38.7 percent) vs Canadian Dollar previous week (14.3 percent)
Australian Dollar (74.5 percent) vs Australian Dollar previous week (57.9 percent)
New Zealand Dollar (24.9 percent) vs New Zealand Dollar previous week (14.4 percent)
Mexican Peso (46.5 percent) vs Mexican Peso previous week (48.5 percent)
Brazilian Real (1.8 percent) vs Brazilian Real previous week (3.7 percent)
Bitcoin (63.9 percent) vs Bitcoin previous week (62.7 percent)
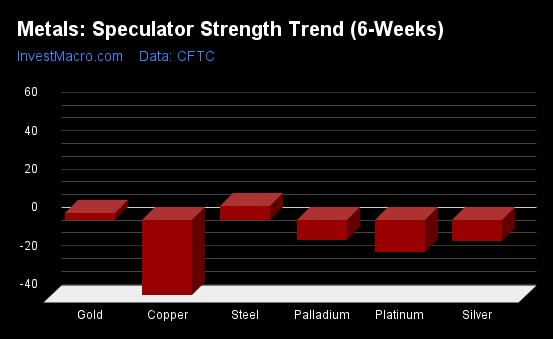
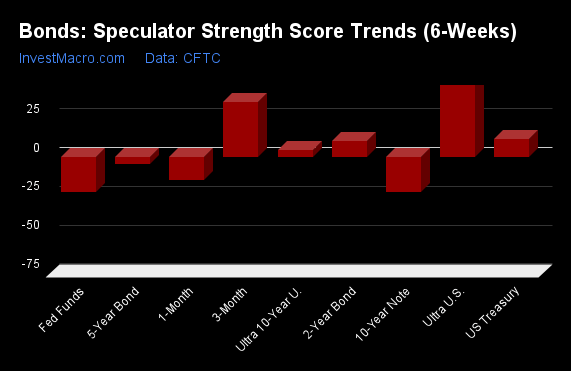
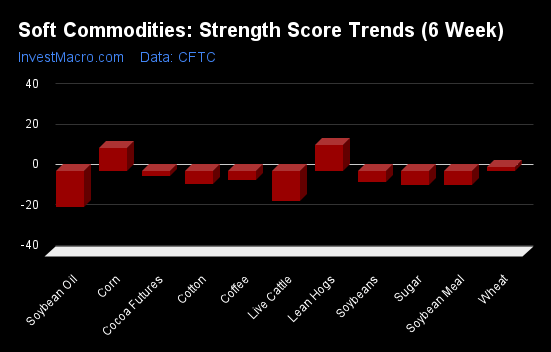
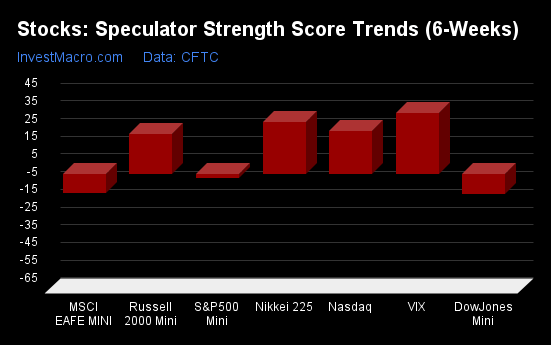
Japanese Yen & Swiss Franc top the 6-Week Strength Trends
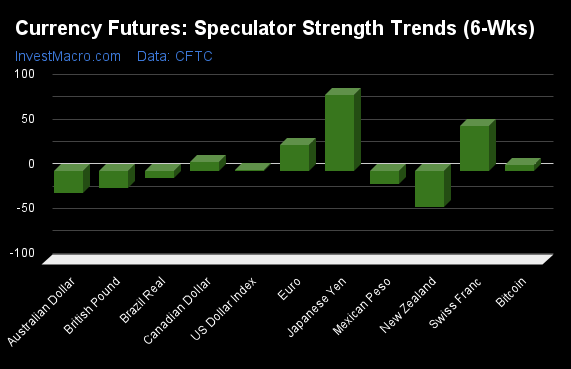
COT Strength Score Trends (or move index, calculates the 6-week changes in strength scores) showed that the Japanese Yen (84 percent) and the Swiss Franc (50 percent) lead the past six weeks trends for the currencies. The EuroFX (29 percent), the Canadian Dollar (10 percent) and Bitcoin (6 percent) are the next highest positive movers in the latest trends data.
The New Zealand Dollar (-40 percent) leads the downside trend scores currently with the Australian Dollar (-26 percent), British Pound (-19 percent) and the Mexican Peso (-15 percent) following next with lower trend scores.
Strength Trend Statistics:
US Dollar Index (0.8 percent) vs US Dollar Index previous week (2.9 percent)
EuroFX (29.0 percent) vs EuroFX previous week (22.3 percent)
British Pound Sterling (-19.3 percent) vs British Pound Sterling previous week (-7.7 percent)
Japanese Yen (84.2 percent) vs Japanese Yen previous week (97.9 percent)
Swiss Franc (50.3 percent) vs Swiss Franc previous week (40.7 percent)
Canadian Dollar (10.1 percent) vs Canadian Dollar previous week (-23.8 percent)
Australian Dollar (-25.5 percent) vs Australian Dollar previous week (-34.8 percent)
New Zealand Dollar (-40.1 percent) vs New Zealand Dollar previous week (-76.3 percent)
Mexican Peso (-15.2 percent) vs Mexican Peso previous week (-14.1 percent)
Brazilian Real (-8.0 percent) vs Brazilian Real previous week (-7.8 percent)
Bitcoin (6.2 percent) vs Bitcoin previous week (-1.9 percent)
Individual COT Forex Markets:
US Dollar Index Futures:
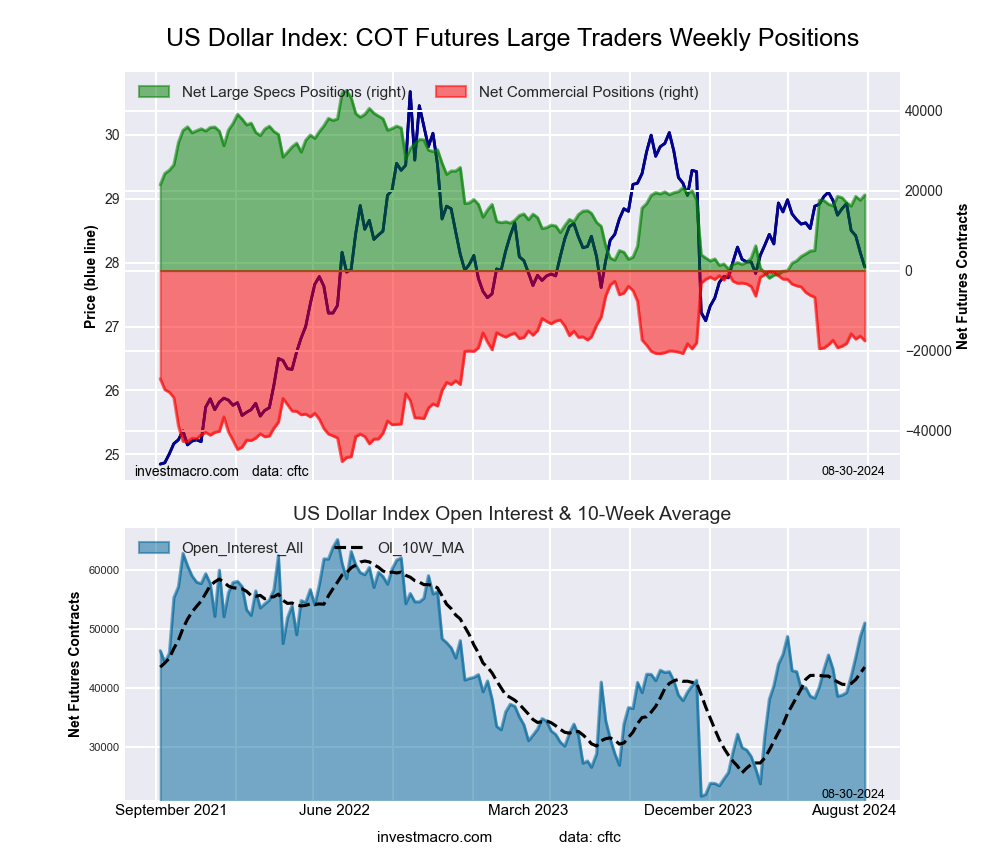 The US Dollar Index large speculator standing this week was a net position of 18,913 contracts in the data reported through Tuesday. This was a weekly increase of 1,322 contracts from the previous week which had a total of 17,591 net contracts.
This week’s current strength score (the trader positioning range over the past three years, measured from 0 to 100) shows the speculators are currently Bearish with a score of 44.4 percent. The commercials are Bullish with a score of 63.6 percent and the small traders (not shown in chart) are Bearish-Extreme with a score of 0.6 percent.
Price Trend-Following Model: Strong Downtrend
Our weekly trend-following model classifies the current market price position as: Strong Downtrend. The current action for the model is considered to be: Hold – Maintain Short Position.
| US DOLLAR INDEX Statistics | SPECULATORS | COMMERCIALS | SMALL TRADERS |
| – Percent of Open Interest Longs: | 73.2 | 19.3 | 4.3 |
| – Percent of Open Interest Shorts: | 36.2 | 53.7 | 7.0 |
| – Net Position: | 18,913 | -17,555 | -1,358 |
| – Gross Longs: | 37,377 | 9,846 | 2,191 |
| – Gross Shorts: | 18,464 | 27,401 | 3,549 |
| – Long to Short Ratio: | 2.0 to 1 | 0.4 to 1 | 0.6 to 1 |
| NET POSITION TREND: | | | |
| – Strength Index Score (3 Year Range Pct): | 44.4 | 63.6 | 0.6 |
| – Strength Index Reading (3 Year Range): | Bearish | Bullish | Bearish-Extreme |
| NET POSITION MOVEMENT INDEX: | | | |
| – 6-Week Change in Strength Index: | 0.8 | 3.6 | -23.1 |
Euro Currency Futures:
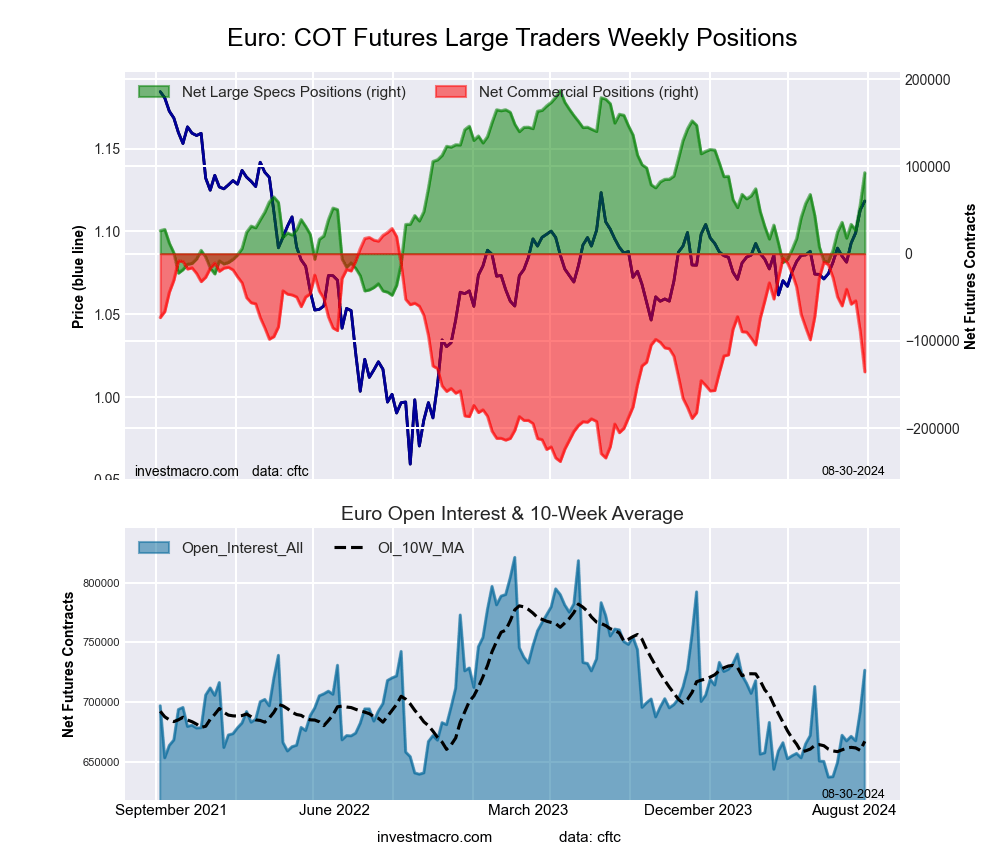 The Euro Currency large speculator standing this week was a net position of 92,838 contracts in the data reported through Tuesday. This was a weekly increase of 36,821 contracts from the previous week which had a total of 56,017 net contracts.
This week’s current strength score (the trader positioning range over the past three years, measured from 0 to 100) shows the speculators are currently Bullish with a score of 59.9 percent. The commercials are Bearish with a score of 38.5 percent and the small traders (not shown in chart) are Bullish with a score of 67.3 percent.
Price Trend-Following Model: Strong Uptrend
Our weekly trend-following model classifies the current market price position as: Strong Uptrend. The current action for the model is considered to be: Hold – Maintain Long Position.
| EURO Currency Statistics | SPECULATORS | COMMERCIALS | SMALL TRADERS |
| – Percent of Open Interest Longs: | 30.1 | 53.4 | 12.2 |
| – Percent of Open Interest Shorts: | 17.3 | 72.1 | 6.3 |
| – Net Position: | 92,838 | -135,522 | 42,684 |
| – Gross Longs: | 218,381 | 388,226 | 88,749 |
| – Gross Shorts: | 125,543 | 523,748 | 46,065 |
| – Long to Short Ratio: | 1.7 to 1 | 0.7 to 1 | 1.9 to 1 |
| NET POSITION TREND: | | | |
| – Strength Index Score (3 Year Range Pct): | 59.9 | 38.5 | 67.3 |
| – Strength Index Reading (3 Year Range): | Bullish | Bearish | Bullish |
| NET POSITION MOVEMENT INDEX: | | | |
| – 6-Week Change in Strength Index: | 29.0 | -32.2 | 40.8 |
British Pound Sterling Futures:
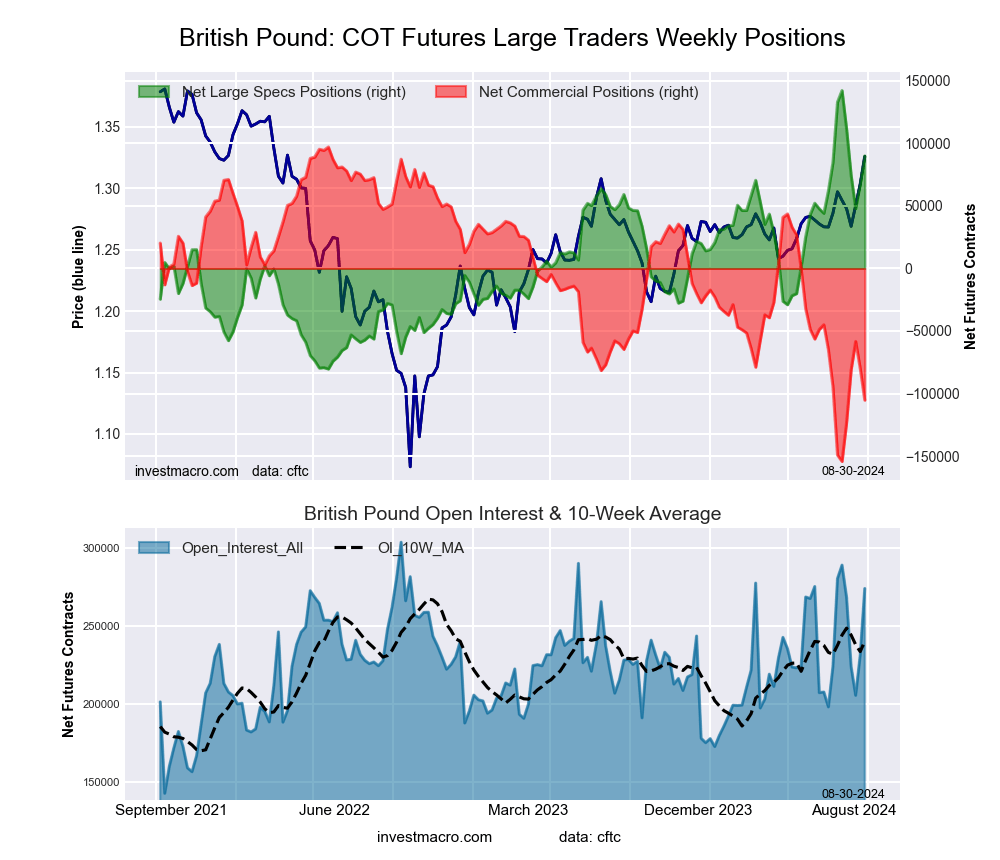 The British Pound Sterling large speculator standing this week was a net position of 89,931 contracts in the data reported through Tuesday. This was a weekly boost of 22,420 contracts from the previous week which had a total of 67,511 net contracts.
This week’s current strength score (the trader positioning range over the past three years, measured from 0 to 100) shows the speculators are currently Bullish with a score of 76.5 percent. The commercials are Bearish-Extreme with a score of 19.5 percent and the small traders (not shown in chart) are Bullish-Extreme with a score of 94.4 percent.
Price Trend-Following Model: Strong Uptrend
Our weekly trend-following model classifies the current market price position as: Strong Uptrend. The current action for the model is considered to be: Hold – Maintain Long Position.
| BRITISH POUND Statistics | SPECULATORS | COMMERCIALS | SMALL TRADERS |
| – Percent of Open Interest Longs: | 55.5 | 23.7 | 15.2 |
| – Percent of Open Interest Shorts: | 22.7 | 62.1 | 9.6 |
| – Net Position: | 89,931 | -105,245 | 15,314 |
| – Gross Longs: | 152,163 | 65,042 | 41,570 |
| – Gross Shorts: | 62,232 | 170,287 | 26,256 |
| – Long to Short Ratio: | 2.4 to 1 | 0.4 to 1 | 1.6 to 1 |
| NET POSITION TREND: | | | |
| – Strength Index Score (3 Year Range Pct): | 76.5 | 19.5 | 94.4 |
| – Strength Index Reading (3 Year Range): | Bullish | Bearish-Extreme | Bullish-Extreme |
| NET POSITION MOVEMENT INDEX: | | | |
| – 6-Week Change in Strength Index: | -19.3 | 17.5 | -1.9 |
Japanese Yen Futures:
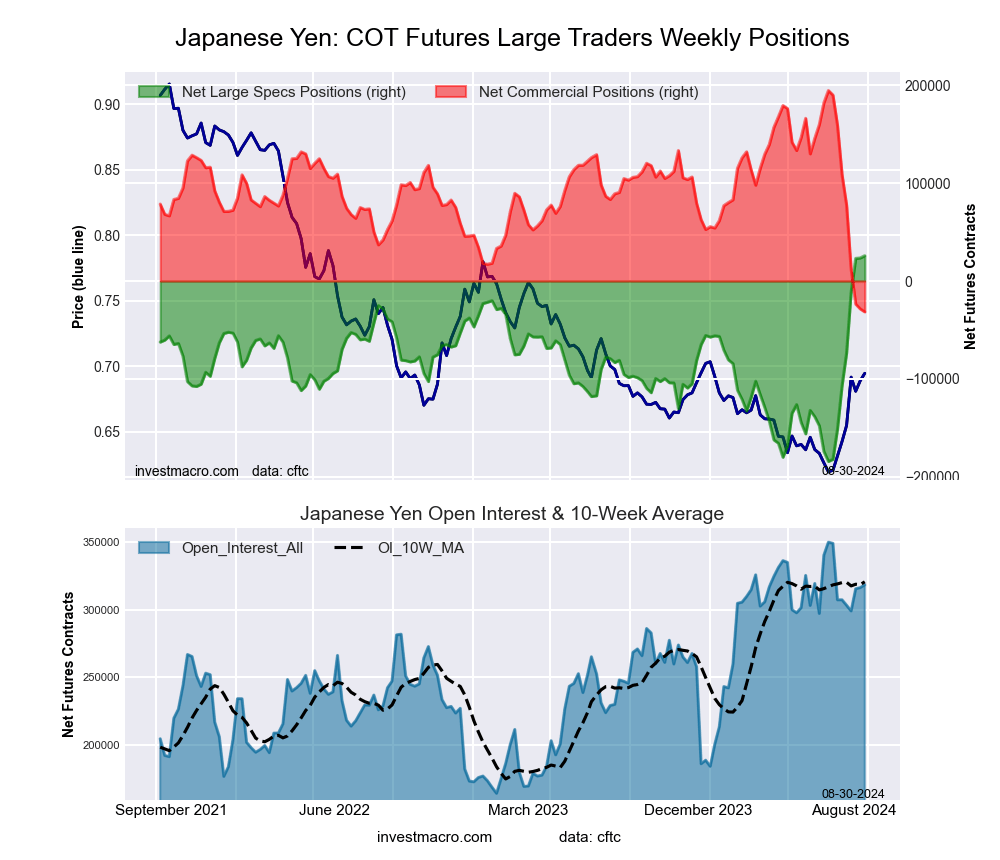 The Japanese Yen large speculator standing this week was a net position of 25,868 contracts in the data reported through Tuesday. This was a weekly advance of 2,283 contracts from the previous week which had a total of 23,585 net contracts.
This week’s current strength score (the trader positioning range over the past three years, measured from 0 to 100) shows the speculators are currently Bullish-Extreme with a score of 100.0 percent. The commercials are Bearish-Extreme with a score of 0.0 percent and the small traders (not shown in chart) are Bullish-Extreme with a score of 100.0 percent.
Price Trend-Following Model: Strong Uptrend
Our weekly trend-following model classifies the current market price position as: Strong Uptrend. The current action for the model is considered to be: Hold – Maintain Long Position.
| JAPANESE YEN Statistics | SPECULATORS | COMMERCIALS | SMALL TRADERS |
| – Percent of Open Interest Longs: | 26.5 | 59.7 | 12.2 |
| – Percent of Open Interest Shorts: | 18.4 | 69.6 | 10.5 |
| – Net Position: | 25,868 | -31,450 | 5,582 |
| – Gross Longs: | 84,305 | 190,141 | 38,943 |
| – Gross Shorts: | 58,437 | 221,591 | 33,361 |
| – Long to Short Ratio: | 1.4 to 1 | 0.9 to 1 | 1.2 to 1 |
| NET POSITION TREND: | | | |
| – Strength Index Score (3 Year Range Pct): | 100.0 | 0.0 | 100.0 |
| – Strength Index Reading (3 Year Range): | Bullish-Extreme | Bearish-Extreme | Bullish-Extreme |
| NET POSITION MOVEMENT INDEX: | | | |
| – 6-Week Change in Strength Index: | 84.2 | -84.3 | 42.6 |
Swiss Franc Futures:
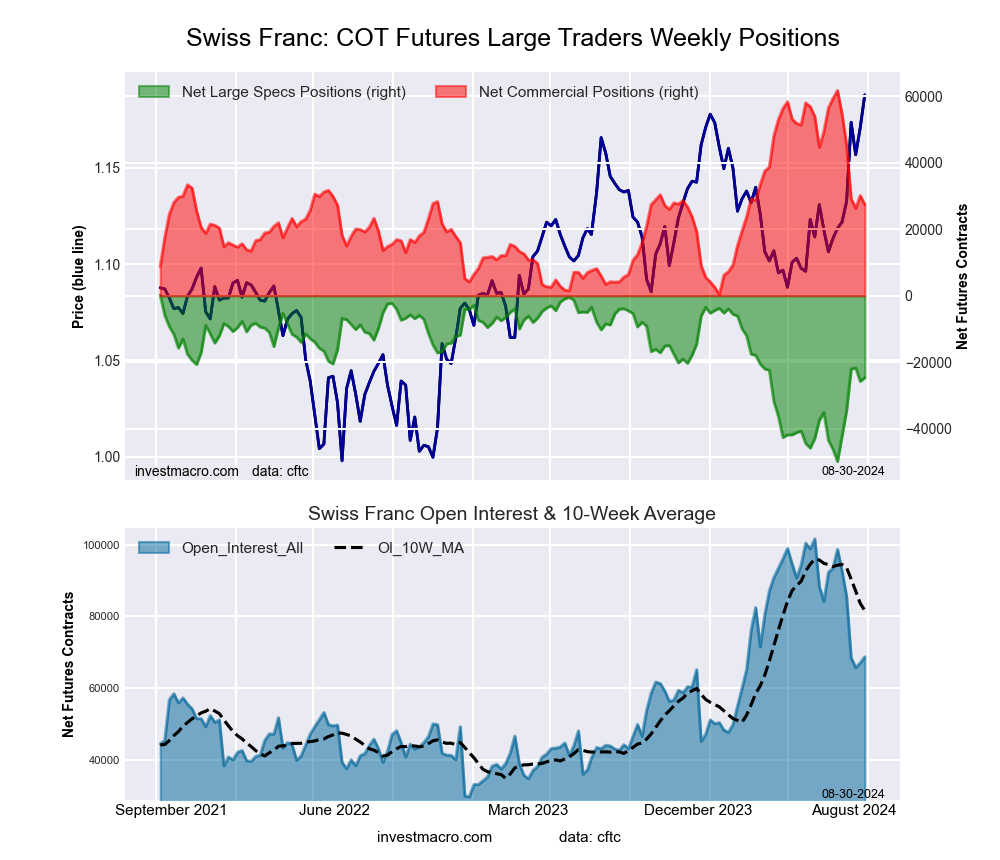 The Swiss Franc large speculator standing this week was a net position of -24,612 contracts in the data reported through Tuesday. This was a weekly rise of 1,102 contracts from the previous week which had a total of -25,714 net contracts.
This week’s current strength score (the trader positioning range over the past three years, measured from 0 to 100) shows the speculators are currently Bullish with a score of 50.3 percent. The commercials are Bearish with a score of 44.3 percent and the small traders (not shown in chart) are Bullish with a score of 64.3 percent.
Price Trend-Following Model: Strong Uptrend
Our weekly trend-following model classifies the current market price position as: Strong Uptrend. The current action for the model is considered to be: Hold – Maintain Long Position.
| SWISS FRANC Statistics | SPECULATORS | COMMERCIALS | SMALL TRADERS |
| – Percent of Open Interest Longs: | 14.4 | 65.7 | 18.1 |
| – Percent of Open Interest Shorts: | 50.1 | 25.8 | 22.2 |
| – Net Position: | -24,612 | 27,446 | -2,834 |
| – Gross Longs: | 9,873 | 45,169 | 12,417 |
| – Gross Shorts: | 34,485 | 17,723 | 15,251 |
| – Long to Short Ratio: | 0.3 to 1 | 2.5 to 1 | 0.8 to 1 |
| NET POSITION TREND: | | | |
| – Strength Index Score (3 Year Range Pct): | 50.3 | 44.3 | 64.3 |
| – Strength Index Reading (3 Year Range): | Bullish | Bearish | Bullish |
| NET POSITION MOVEMENT INDEX: | | | |
| – 6-Week Change in Strength Index: | 50.3 | -55.7 | 41.1 |
Canadian Dollar Futures:
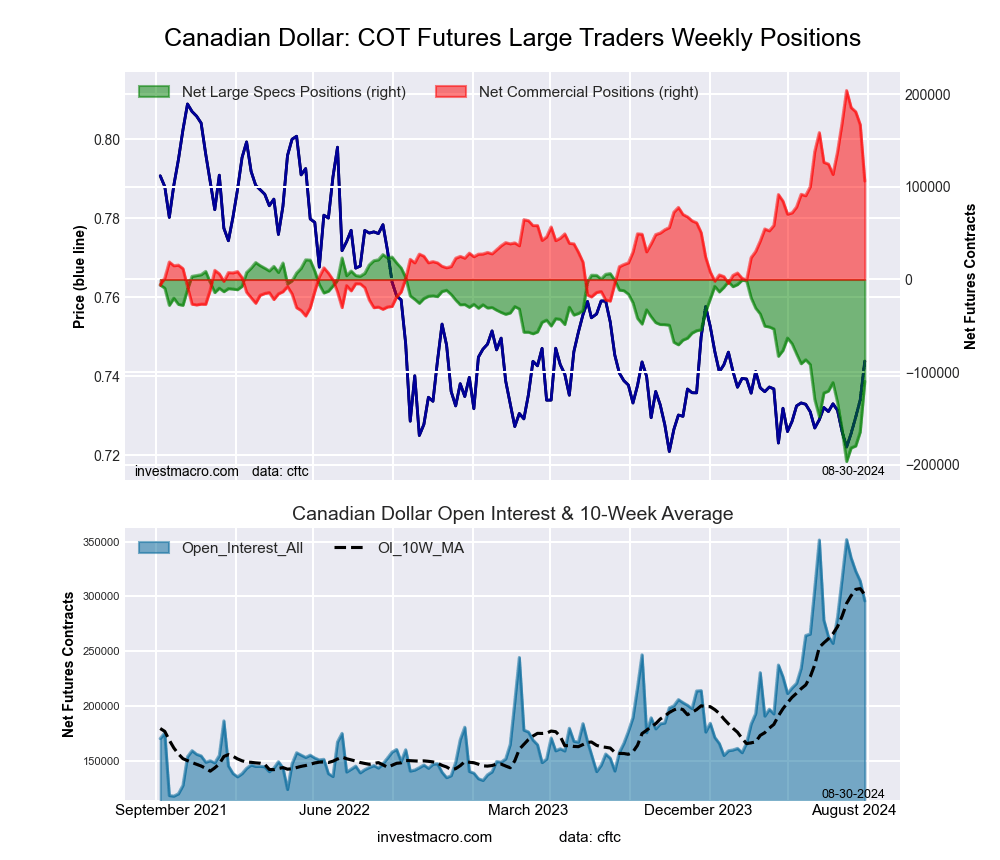 The Canadian Dollar large speculator standing this week was a net position of -110,002 contracts in the data reported through Tuesday. This was a weekly increase of 54,408 contracts from the previous week which had a total of -164,410 net contracts.
This week’s current strength score (the trader positioning range over the past three years, measured from 0 to 100) shows the speculators are currently Bearish with a score of 38.7 percent. The commercials are Bullish with a score of 59.8 percent and the small traders (not shown in chart) are Bearish with a score of 42.2 percent.
Price Trend-Following Model: Strong Uptrend
Our weekly trend-following model classifies the current market price position as: Strong Uptrend. The current action for the model is considered to be: New Buy – Long Position.
| CANADIAN DOLLAR Statistics | SPECULATORS | COMMERCIALS | SMALL TRADERS |
| – Percent of Open Interest Longs: | 6.5 | 77.3 | 10.8 |
| – Percent of Open Interest Shorts: | 43.7 | 41.4 | 9.5 |
| – Net Position: | -110,002 | 106,144 | 3,858 |
| – Gross Longs: | 19,325 | 228,771 | 32,042 |
| – Gross Shorts: | 129,327 | 122,627 | 28,184 |
| – Long to Short Ratio: | 0.1 to 1 | 1.9 to 1 | 1.1 to 1 |
| NET POSITION TREND: | | | |
| – Strength Index Score (3 Year Range Pct): | 38.7 | 59.8 | 42.2 |
| – Strength Index Reading (3 Year Range): | Bearish | Bullish | Bearish |
| NET POSITION MOVEMENT INDEX: | | | |
| – 6-Week Change in Strength Index: | 10.1 | -12.9 | 26.4 |
Australian Dollar Futures:
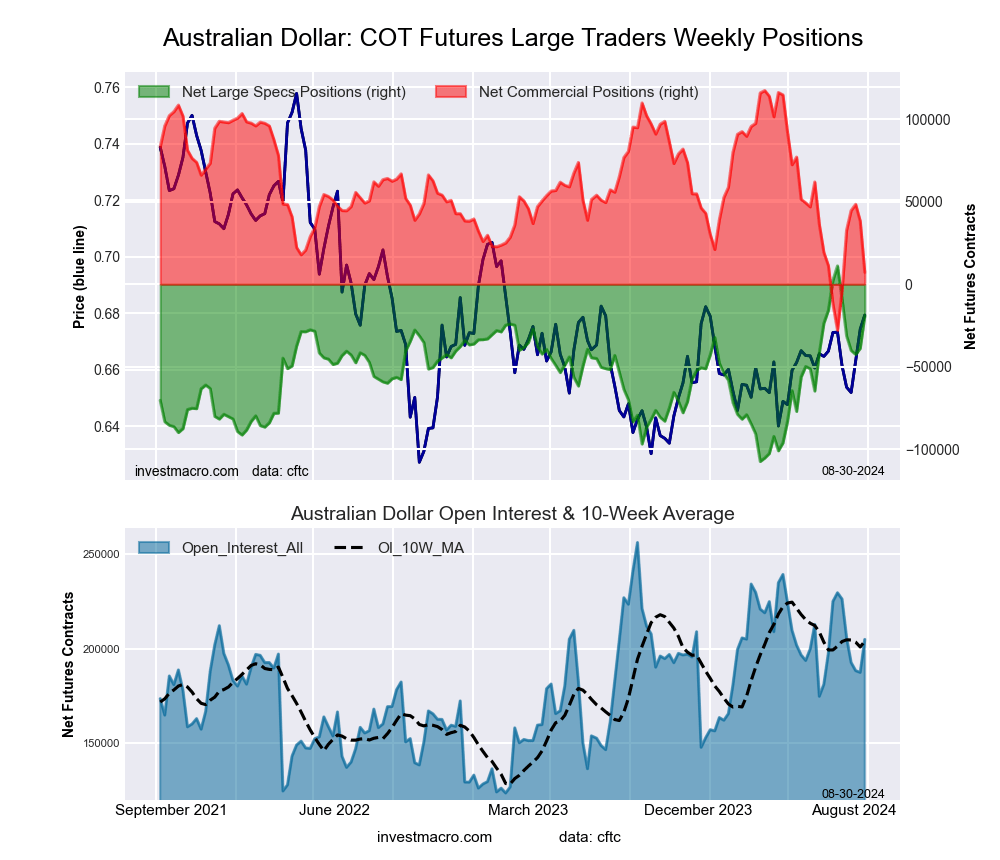 The Australian Dollar large speculator standing this week was a net position of -19,159 contracts in the data reported through Tuesday. This was a weekly lift of 19,726 contracts from the previous week which had a total of -38,885 net contracts.
This week’s current strength score (the trader positioning range over the past three years, measured from 0 to 100) shows the speculators are currently Bullish with a score of 74.5 percent. The commercials are Bearish with a score of 24.1 percent and the small traders (not shown in chart) are Bullish-Extreme with a score of 86.7 percent.
Price Trend-Following Model: Strong Uptrend
Our weekly trend-following model classifies the current market price position as: Strong Uptrend. The current action for the model is considered to be: Hold – Maintain Long Position.
| AUSTRALIAN DOLLAR Statistics | SPECULATORS | COMMERCIALS | SMALL TRADERS |
| – Percent of Open Interest Longs: | 39.8 | 42.8 | 15.4 |
| – Percent of Open Interest Shorts: | 49.1 | 39.3 | 9.5 |
| – Net Position: | -19,159 | 7,222 | 11,937 |
| – Gross Longs: | 81,486 | 87,629 | 31,461 |
| – Gross Shorts: | 100,645 | 80,407 | 19,524 |
| – Long to Short Ratio: | 0.8 to 1 | 1.1 to 1 | 1.6 to 1 |
| NET POSITION TREND: | | | |
| – Strength Index Score (3 Year Range Pct): | 74.5 | 24.1 | 86.7 |
| – Strength Index Reading (3 Year Range): | Bullish | Bearish | Bullish-Extreme |
| NET POSITION MOVEMENT INDEX: | | | |
| – 6-Week Change in Strength Index: | -25.5 | 24.1 | -13.3 |
New Zealand Dollar Futures:
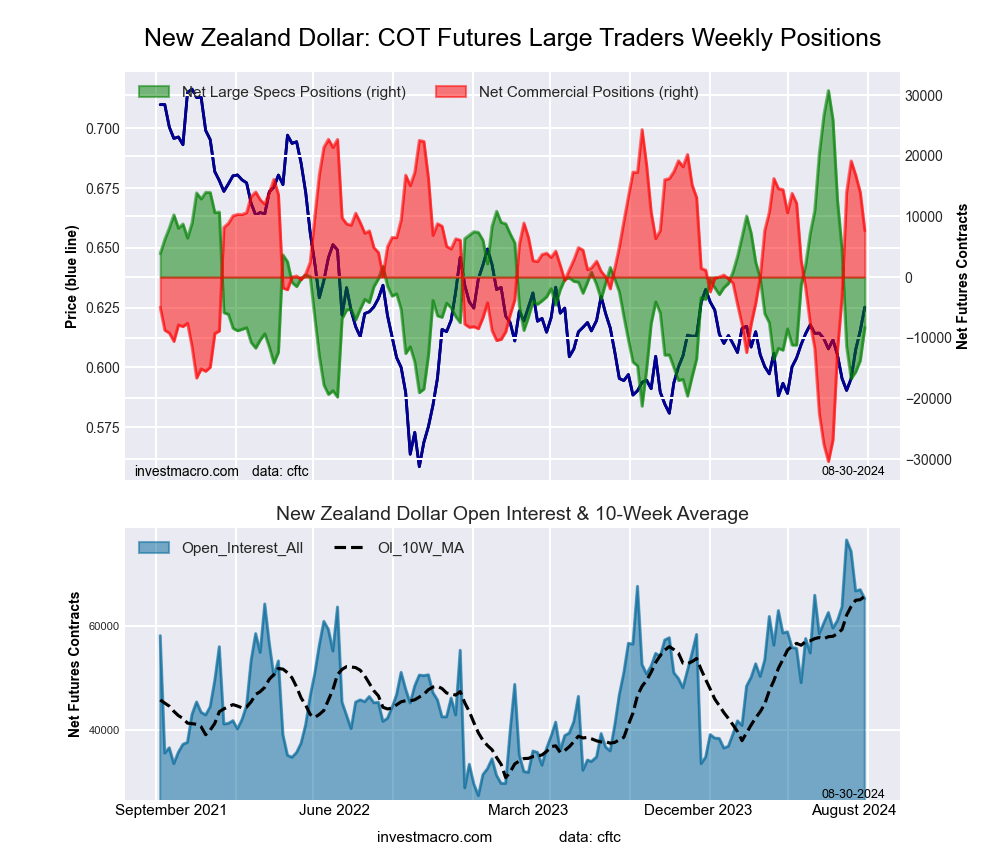 The New Zealand Dollar large speculator standing this week was a net position of -8,316 contracts in the data reported through Tuesday. This was a weekly boost of 5,453 contracts from the previous week which had a total of -13,769 net contracts.
This week’s current strength score (the trader positioning range over the past three years, measured from 0 to 100) shows the speculators are currently Bearish with a score of 24.9 percent. The commercials are Bullish with a score of 69.6 percent and the small traders (not shown in chart) are Bullish with a score of 67.6 percent.
Price Trend-Following Model: Strong Uptrend
Our weekly trend-following model classifies the current market price position as: Strong Uptrend. The current action for the model is considered to be: Hold – Maintain Long Position.
| NEW ZEALAND DOLLAR Statistics | SPECULATORS | COMMERCIALS | SMALL TRADERS |
| – Percent of Open Interest Longs: | 31.7 | 58.3 | 7.6 |
| – Percent of Open Interest Shorts: | 44.5 | 46.5 | 6.6 |
| – Net Position: | -8,316 | 7,659 | 657 |
| – Gross Longs: | 20,648 | 37,932 | 4,943 |
| – Gross Shorts: | 28,964 | 30,273 | 4,286 |
| – Long to Short Ratio: | 0.7 to 1 | 1.3 to 1 | 1.2 to 1 |
| NET POSITION TREND: | | | |
| – Strength Index Score (3 Year Range Pct): | 24.9 | 69.6 | 67.6 |
| – Strength Index Reading (3 Year Range): | Bearish | Bullish | Bullish |
| NET POSITION MOVEMENT INDEX: | | | |
| – 6-Week Change in Strength Index: | -40.1 | 36.1 | 15.5 |
Mexican Peso Futures:
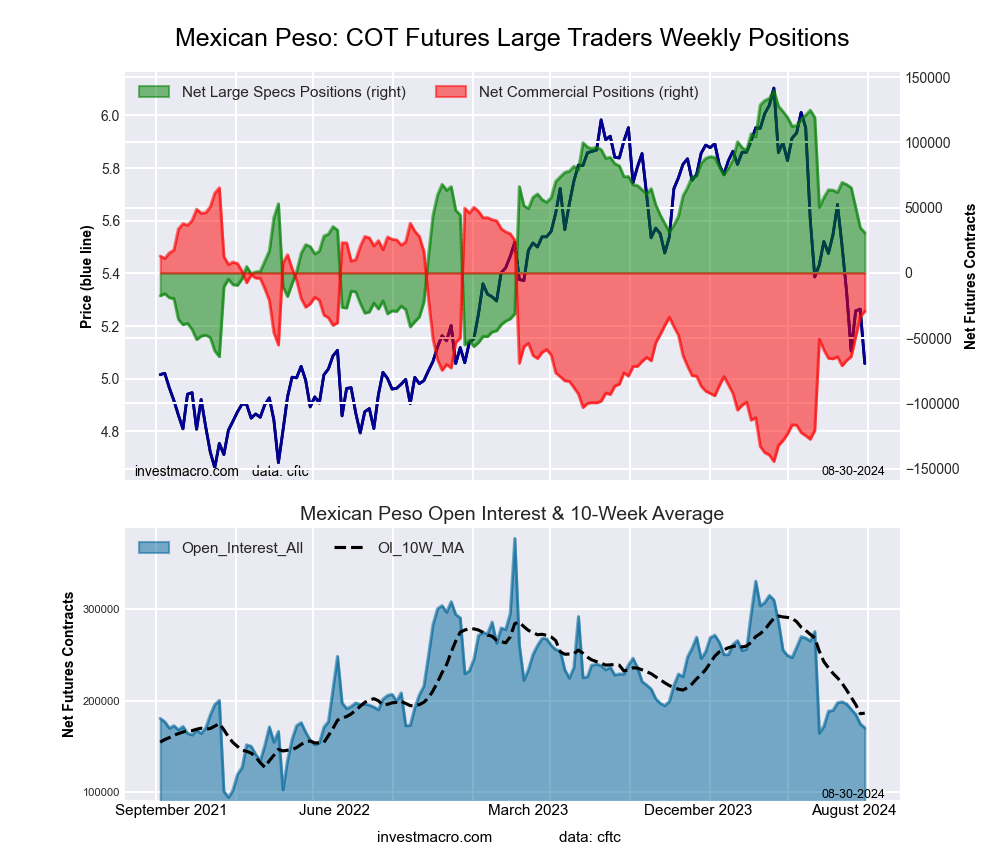 The Mexican Peso large speculator standing this week was a net position of 30,720 contracts in the data reported through Tuesday. This was a weekly reduction of -3,926 contracts from the previous week which had a total of 34,646 net contracts.
This week’s current strength score (the trader positioning range over the past three years, measured from 0 to 100) shows the speculators are currently Bearish with a score of 46.5 percent. The commercials are Bullish with a score of 54.9 percent and the small traders (not shown in chart) are Bearish-Extreme with a score of 2.2 percent.
Price Trend-Following Model: Strong Downtrend
Our weekly trend-following model classifies the current market price position as: Strong Downtrend. The current action for the model is considered to be: Hold – Maintain Short Position.
| MEXICAN PESO Statistics | SPECULATORS | COMMERCIALS | SMALL TRADERS |
| – Percent of Open Interest Longs: | 39.2 | 54.5 | 2.5 |
| – Percent of Open Interest Shorts: | 21.1 | 71.7 | 3.4 |
| – Net Position: | 30,720 | -29,312 | -1,408 |
| – Gross Longs: | 66,669 | 92,793 | 4,303 |
| – Gross Shorts: | 35,949 | 122,105 | 5,711 |
| – Long to Short Ratio: | 1.9 to 1 | 0.8 to 1 | 0.8 to 1 |
| NET POSITION TREND: | | | |
| – Strength Index Score (3 Year Range Pct): | 46.5 | 54.9 | 2.2 |
| – Strength Index Reading (3 Year Range): | Bearish | Bullish | Bearish-Extreme |
| NET POSITION MOVEMENT INDEX: | | | |
| – 6-Week Change in Strength Index: | -15.2 | 16.6 | -24.8 |
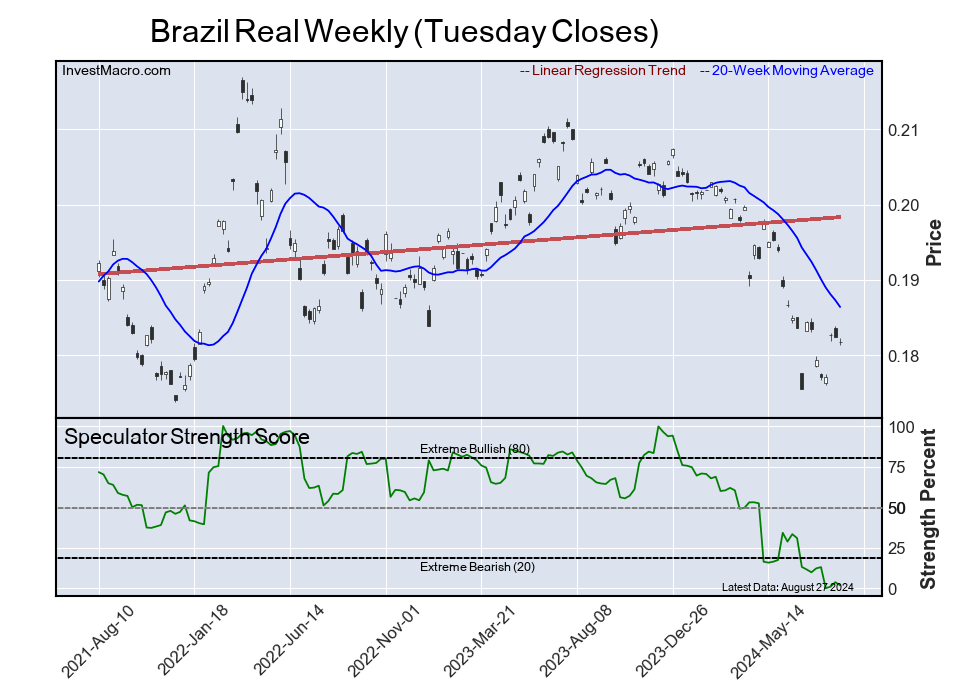
Brazilian Real Futures:
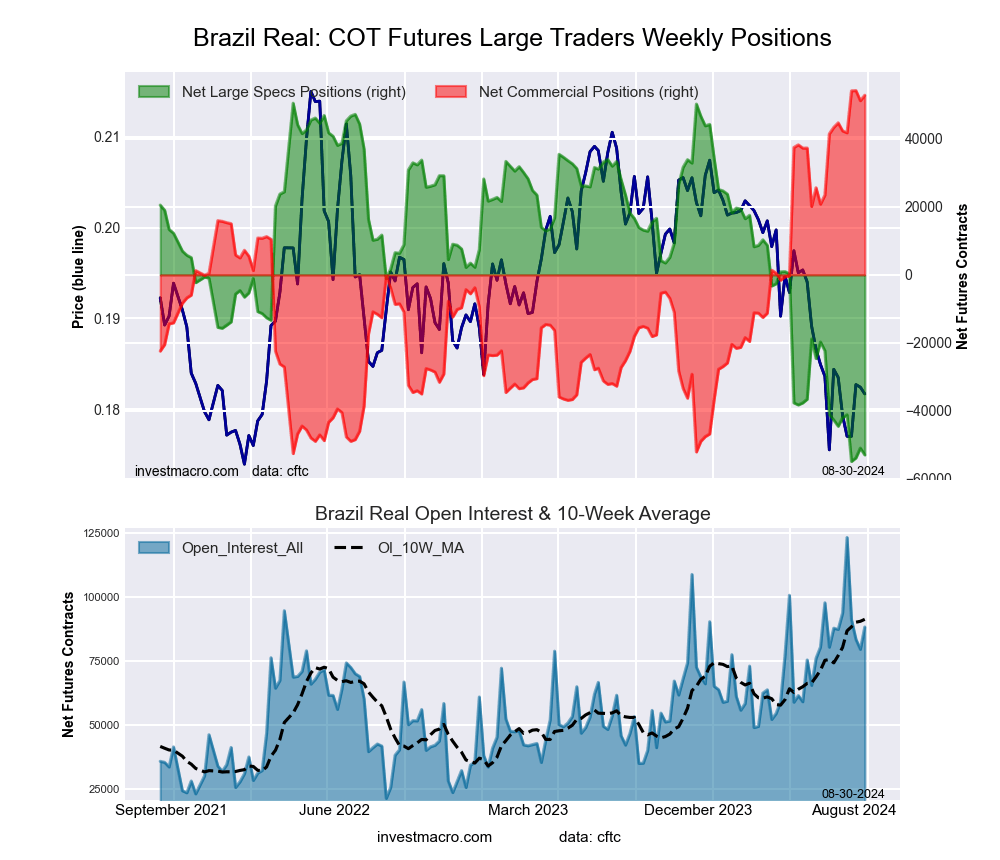 The Brazilian Real large speculator standing this week was a net position of -52,963 contracts in the data reported through Tuesday. This was a weekly decline of -2,008 contracts from the previous week which had a total of -50,955 net contracts.
This week’s current strength score (the trader positioning range over the past three years, measured from 0 to 100) shows the speculators are currently Bearish-Extreme with a score of 1.8 percent. The commercials are Bullish-Extreme with a score of 98.7 percent and the small traders (not shown in chart) are Bearish with a score of 35.6 percent.
Price Trend-Following Model: Downtrend
Our weekly trend-following model classifies the current market price position as: Downtrend. The current action for the model is considered to be: Hold – Maintain Short Position.
| BRAZIL REAL Statistics | SPECULATORS | COMMERCIALS | SMALL TRADERS |
| – Percent of Open Interest Longs: | 14.8 | 76.7 | 3.2 |
| – Percent of Open Interest Shorts: | 74.8 | 16.8 | 3.1 |
| – Net Position: | -52,963 | 52,841 | 122 |
| – Gross Longs: | 13,034 | 67,673 | 2,832 |
| – Gross Shorts: | 65,997 | 14,832 | 2,710 |
| – Long to Short Ratio: | 0.2 to 1 | 4.6 to 1 | 1.0 to 1 |
| NET POSITION TREND: | | | |
| – Strength Index Score (3 Year Range Pct): | 1.8 | 98.7 | 35.6 |
| – Strength Index Reading (3 Year Range): | Bearish-Extreme | Bullish-Extreme | Bearish |
| NET POSITION MOVEMENT INDEX: | | | |
| – 6-Week Change in Strength Index: | -8.0 | 7.6 | 2.9 |
Bitcoin Futures:
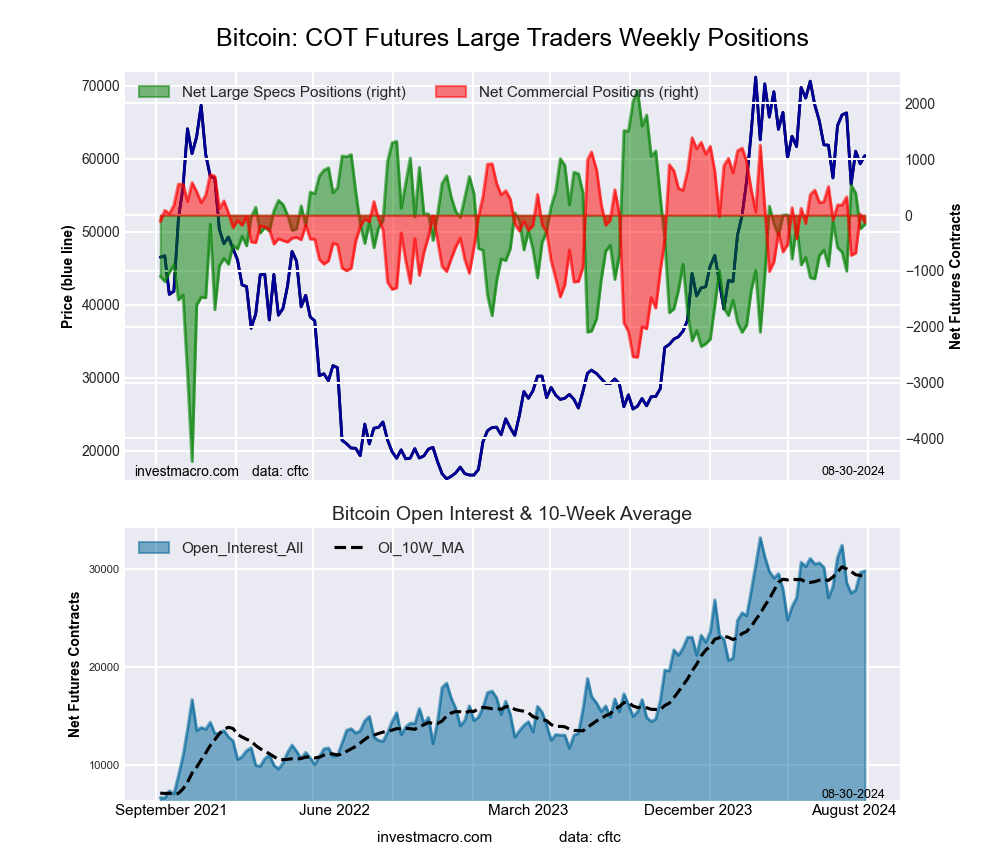 The Bitcoin large speculator standing this week was a net position of -166 contracts in the data reported through Tuesday. This was a weekly increase of 77 contracts from the previous week which had a total of -243 net contracts.
This week’s current strength score (the trader positioning range over the past three years, measured from 0 to 100) shows the speculators are currently Bullish with a score of 63.9 percent. The commercials are Bullish with a score of 61.3 percent and the small traders (not shown in chart) are Bearish-Extreme with a score of 19.7 percent.
Price Trend-Following Model: Strong Downtrend
Our weekly trend-following model classifies the current market price position as: Strong Downtrend. The current action for the model is considered to be: Hold – Maintain Short Position.
| BITCOIN Statistics | SPECULATORS | COMMERCIALS | SMALL TRADERS |
| – Percent of Open Interest Longs: | 84.2 | 3.6 | 4.4 |
| – Percent of Open Interest Shorts: | 84.8 | 4.1 | 3.4 |
| – Net Position: | -166 | -132 | 298 |
| – Gross Longs: | 25,105 | 1,083 | 1,308 |
| – Gross Shorts: | 25,271 | 1,215 | 1,010 |
| – Long to Short Ratio: | 1.0 to 1 | 0.9 to 1 | 1.3 to 1 |
| NET POSITION TREND: | | | |
| – Strength Index Score (3 Year Range Pct): | 63.9 | 61.3 | 19.7 |
| – Strength Index Reading (3 Year Range): | Bullish | Bullish | Bearish-Extreme |
| NET POSITION MOVEMENT INDEX: | | | |
| – 6-Week Change in Strength Index: | 6.2 | -8.0 | -2.3 |
Article By InvestMacro – Receive our weekly COT Newsletter
*COT Report: The COT data, released weekly to the public each Friday, is updated through the most recent Tuesday (data is 3 days old) and shows a quick view of how large speculators or non-commercials (for-profit traders) were positioned in the futures markets.
The CFTC categorizes trader positions according to commercial hedgers (traders who use futures contracts for hedging as part of the business), non-commercials (large traders who speculate to realize trading profits) and nonreportable traders (usually small traders/speculators) as well as their open interest (contracts open in the market at time of reporting). See CFTC criteria here.