By InvestMacro
Here are the latest charts and statistics for the Commitment of Traders (COT) reports data published by the Commodities Futures Trading Commission (CFTC).
The latest COT data is updated through Tuesday October 8th and shows a quick view of how large traders (for-profit speculators and commercial entities) were positioned in the futures markets.
Weekly Speculator Changes led higher by Corn & Soybeans
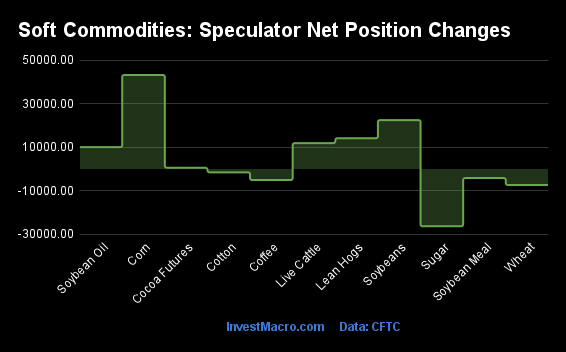
The COT soft commodities markets speculator bets were slightly higher this week as six out of the eleven softs markets we cover had higher positioning while the other five markets had lower speculator contracts.
Leading the gains for the softs markets was Corn (43,264 contracts) with Soybeans (22,511 contracts), Lean Hogs (14,156 contracts), Live Cattle (11,909 contracts), Soybean Oil (10,065 contracts) and with Cocoa (558 contracts) also showing a positive week.
The markets with the declines in speculator bets this week were Sugar (-26,375 contracts) with Wheat (-7,366 contracts), Coffee (-5,098 contracts), Soybean Meal (-4,175 contracts) and Cotton (-1,553 contracts) also registering lower bets on the week.
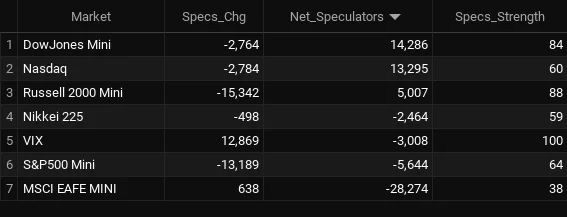
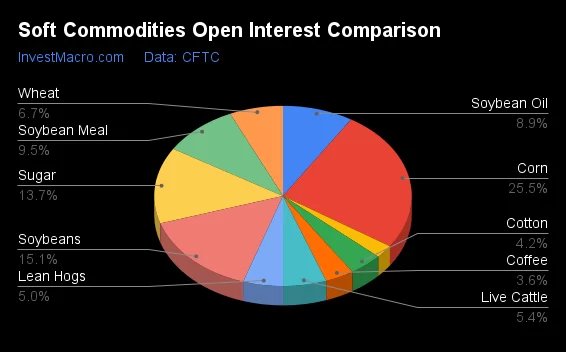
Soft Commodities Net Speculators Leaderboard
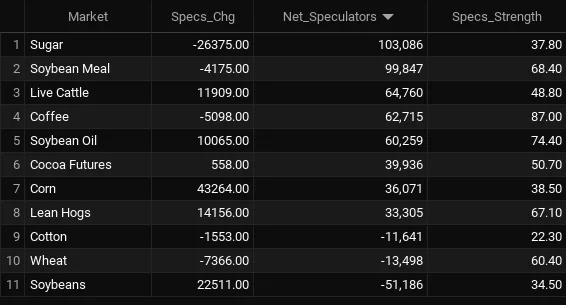
Legend: Weekly Speculators Change | Speculators Current Net Position | Speculators Strength Score compared to last 3-Years (0-100 range)
Strength Scores led by Coffee & Soybean Oil
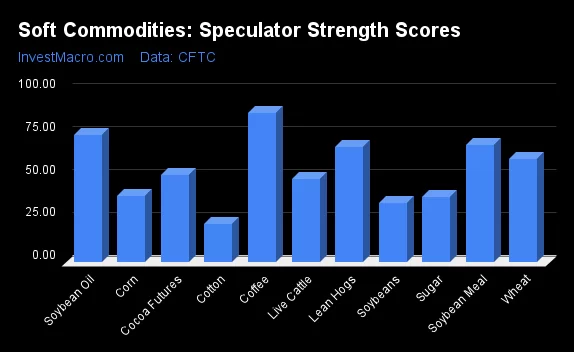
COT Strength Scores (a normalized measure of Speculator positions over a 3-Year range, from 0 to 100 where above 80 is Extreme-Bullish and below 20 is Extreme-Bearish) showed that Coffee (87 percent) and Soybean Oil (74 percent) lead the softs markets this week. Soybean Meal (68 percent), Lean Hogs (67 percent) and Wheat (60 percent) come in as the next highest in the weekly strength scores.
On the downside, Cotton (22 percent) and Soybeans (34 percent) come in at the lowest strength levels currently followed next by Sugar (38 percent) and Corn (38 percent).
Strength Statistics:
Corn (38.5 percent) vs Corn previous week (33.0 percent)
Sugar (37.8 percent) vs Sugar previous week (47.1 percent)
Coffee (87.0 percent) vs Coffee previous week (92.0 percent)
Soybeans (34.5 percent) vs Soybeans previous week (29.2 percent)
Soybean Oil (74.4 percent) vs Soybean Oil previous week (68.9 percent)
Soybean Meal (68.4 percent) vs Soybean Meal previous week (70.1 percent)
Live Cattle (48.8 percent) vs Live Cattle previous week (35.9 percent)
Lean Hogs (67.1 percent) vs Lean Hogs previous week (53.4 percent)
Cotton (22.3 percent) vs Cotton previous week (23.3 percent)
Cocoa (50.7 percent) vs Cocoa previous week (50.1 percent)
Wheat (60.4 percent) vs Wheat previous week (65.7 percent)
Soybean Oil & Lean Hogs top the 6-Week Strength Trends
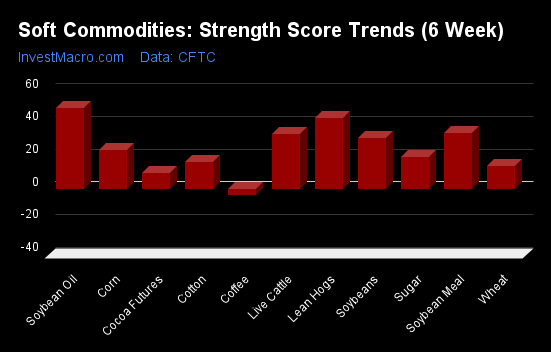
COT Strength Score Trends (or move index, calculates the 6-week changes in strength scores) showed that Soybean Oil (49 percent) and Lean Hogs (44 percent) lead the past six weeks trends for soft commodities. Soybean Meal (34 percent), Live Cattle (33 percent) and Soybeans (31 percent) are the next highest positive movers in the latest trends data.
Coffee (-4 percent) leads the downside trend scores currently and is the only market with a negative trend.
Strength Trend Statistics:
Corn (23.5 percent) vs Corn previous week (20.1 percent)
Sugar (19.5 percent) vs Sugar previous week (38.8 percent)
Coffee (-4.1 percent) vs Coffee previous week (3.6 percent)
Soybeans (31.4 percent) vs Soybeans previous week (24.8 percent)
Soybean Oil (49.3 percent) vs Soybean Oil previous week (50.8 percent)
Soybean Meal (34.0 percent) vs Soybean Meal previous week (37.1 percent)
Live Cattle (33.4 percent) vs Live Cattle previous week (18.6 percent)
Lean Hogs (43.6 percent) vs Lean Hogs previous week (39.6 percent)
Cotton (16.5 percent) vs Cotton previous week (21.2 percent)
Cocoa (9.9 percent) vs Cocoa previous week (10.7 percent)
Wheat (13.8 percent) vs Wheat previous week (14.1 percent)
Individual Soft Commodities Markets:
CORN Futures:
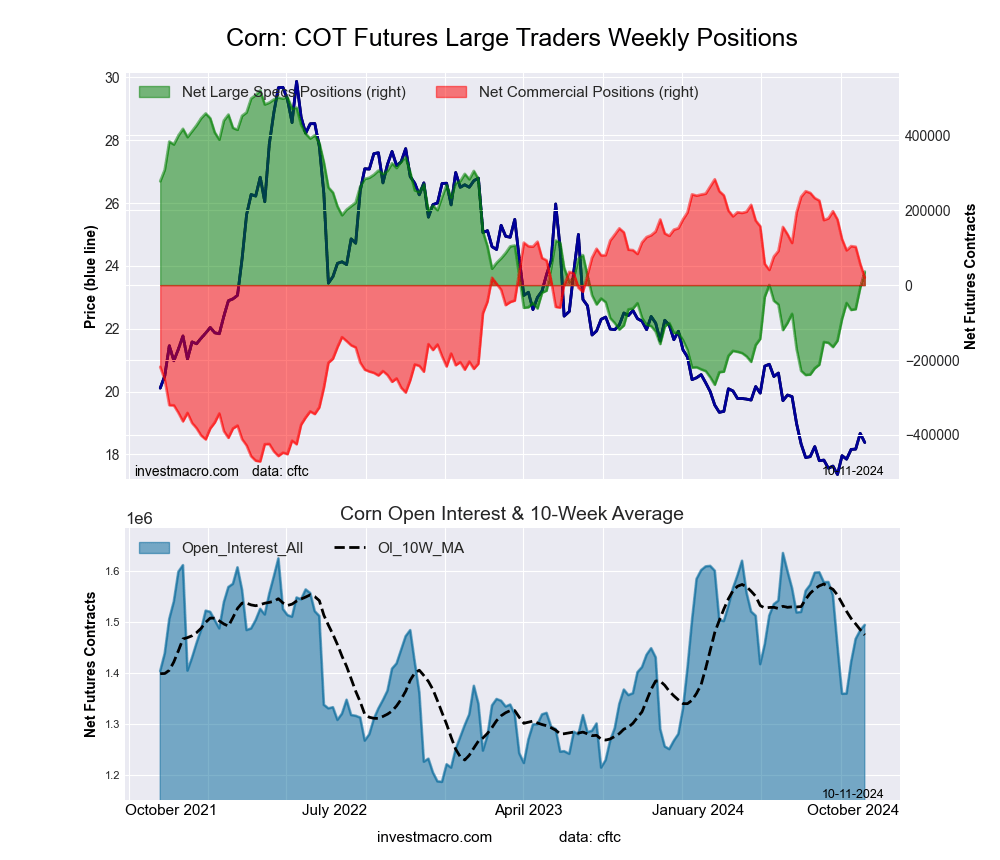 The CORN large speculator standing this week recorded a net position of 36,071 contracts in the data reported through Tuesday. This was a weekly gain of 43,264 contracts from the previous week which had a total of -7,193 net contracts.
This week’s current strength score (the trader positioning range over the past three years, measured from 0 to 100) shows the speculators are currently Bearish with a score of 38.5 percent. The commercials are Bullish with a score of 65.2 percent and the small traders (not shown in chart) are Bearish with a score of 32.9 percent.
Price Trend-Following Model: Downtrend
Our weekly trend-following model classifies the current market price position as: Downtrend.
| CORN Futures Statistics | SPECULATORS | COMMERCIALS | SMALL TRADERS |
| – Percent of Open Interest Longs: | 21.7 | 44.9 | 8.5 |
| – Percent of Open Interest Shorts: | 19.2 | 43.5 | 12.3 |
| – Net Position: | 36,071 | 20,228 | -56,299 |
| – Gross Longs: | 323,640 | 670,624 | 127,234 |
| – Gross Shorts: | 287,569 | 650,396 | 183,533 |
| – Long to Short Ratio: | 1.1 to 1 | 1.0 to 1 | 0.7 to 1 |
| NET POSITION TREND: | | | |
| – Strength Index Score (3 Year Range Pct): | 38.5 | 65.2 | 32.9 |
| – Strength Index Reading (3 Year Range): | Bearish | Bullish | Bearish |
| NET POSITION MOVEMENT INDEX: | | | |
| – 6-Week Change in Strength Index: | 23.5 | -20.6 | -39.5 |
SUGAR Futures:
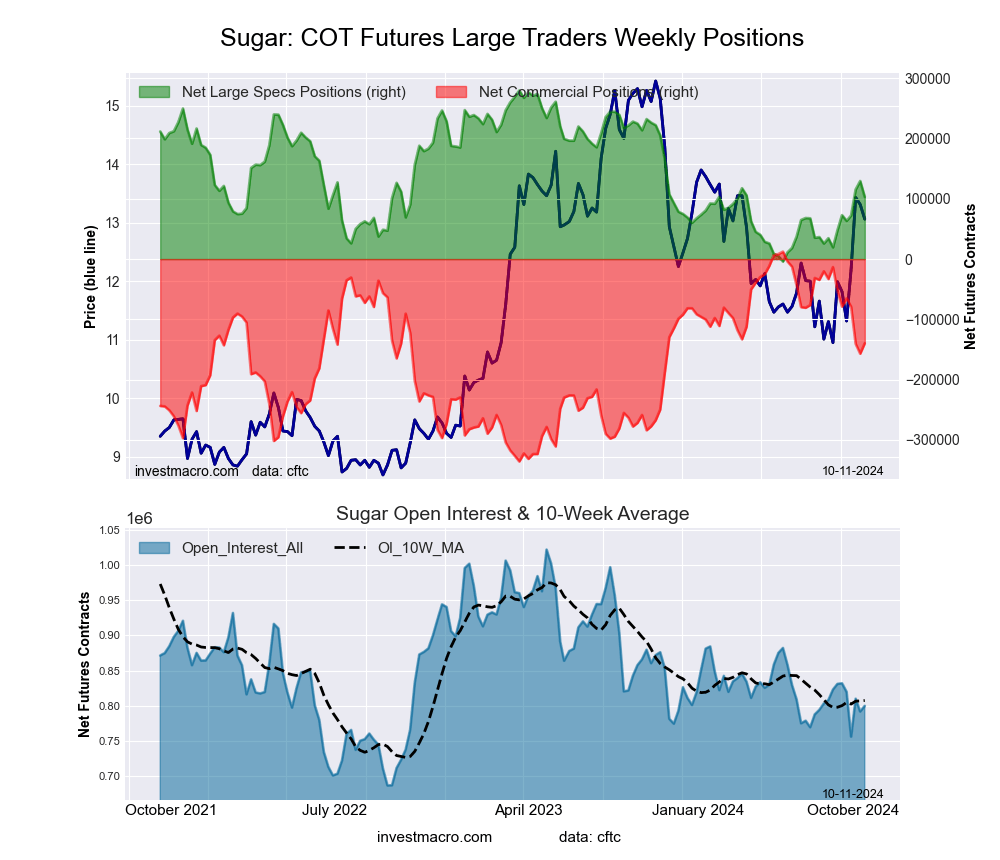 The SUGAR large speculator standing this week recorded a net position of 103,086 contracts in the data reported through Tuesday. This was a weekly reduction of -26,375 contracts from the previous week which had a total of 129,461 net contracts.
This week’s current strength score (the trader positioning range over the past three years, measured from 0 to 100) shows the speculators are currently Bearish with a score of 37.8 percent. The commercials are Bullish with a score of 56.3 percent and the small traders (not shown in chart) are Bullish with a score of 67.2 percent.
Price Trend-Following Model: Strong Uptrend
Our weekly trend-following model classifies the current market price position as: Strong Uptrend.
| SUGAR Futures Statistics | SPECULATORS | COMMERCIALS | SMALL TRADERS |
| – Percent of Open Interest Longs: | 28.8 | 47.8 | 10.1 |
| – Percent of Open Interest Shorts: | 15.9 | 65.2 | 5.6 |
| – Net Position: | 103,086 | -139,667 | 36,581 |
| – Gross Longs: | 230,158 | 382,030 | 81,111 |
| – Gross Shorts: | 127,072 | 521,697 | 44,530 |
| – Long to Short Ratio: | 1.8 to 1 | 0.7 to 1 | 1.8 to 1 |
| NET POSITION TREND: | | | |
| – Strength Index Score (3 Year Range Pct): | 37.8 | 56.3 | 67.2 |
| – Strength Index Reading (3 Year Range): | Bearish | Bullish | Bullish |
| NET POSITION MOVEMENT INDEX: | | | |
| – 6-Week Change in Strength Index: | 19.5 | -24.9 | 41.0 |
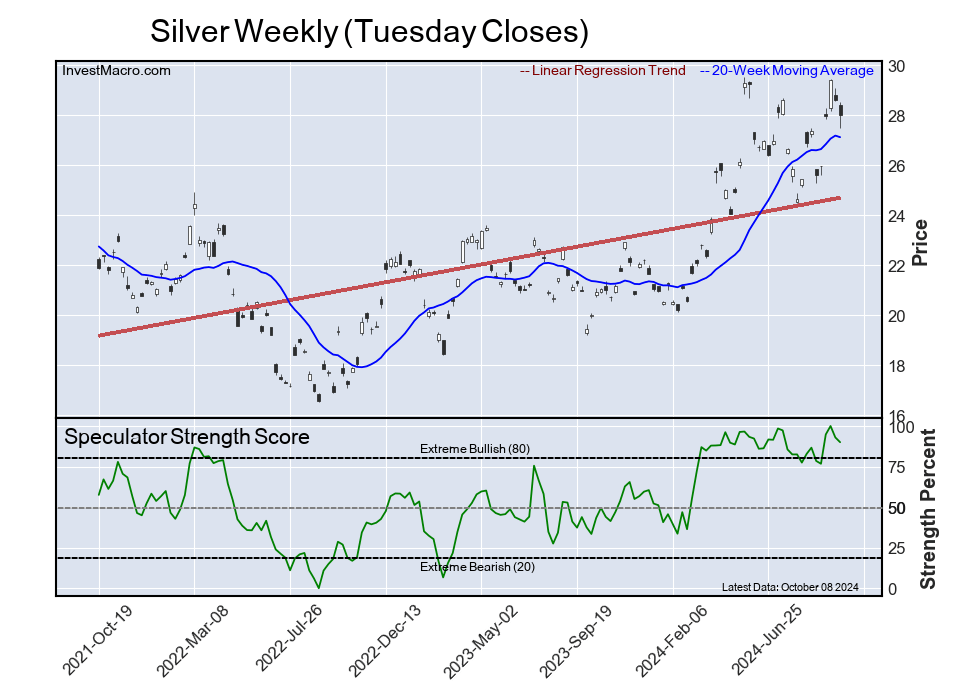
COFFEE Futures:
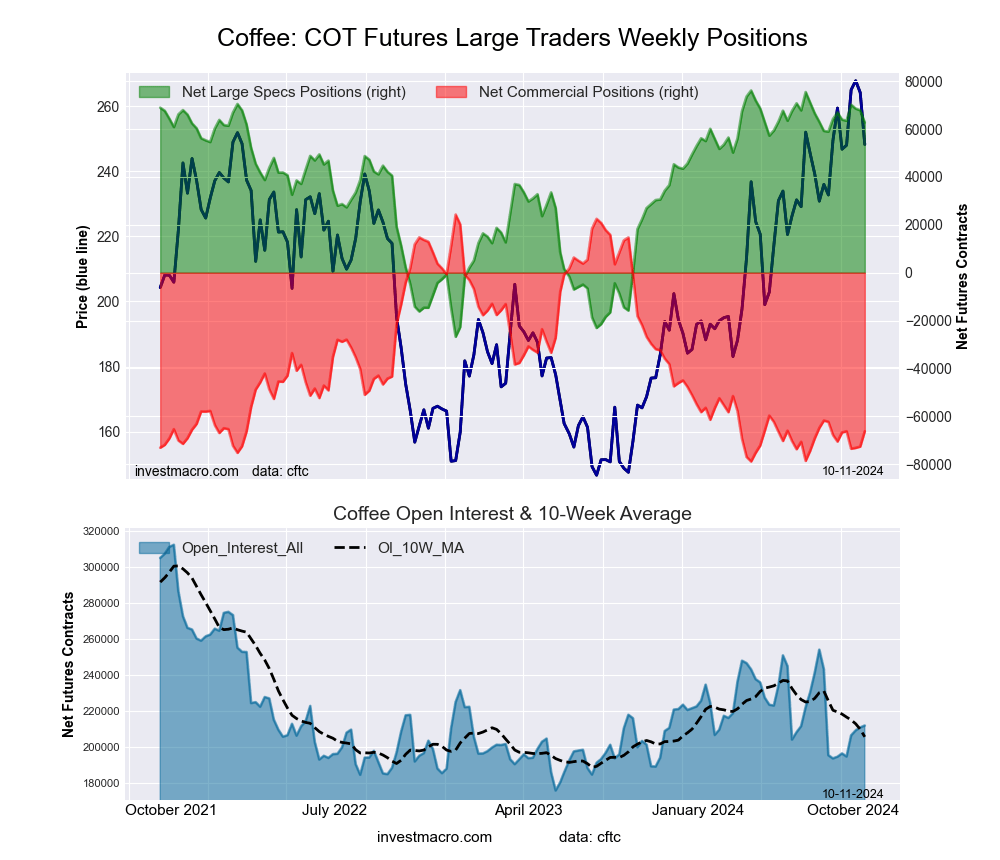 The COFFEE large speculator standing this week recorded a net position of 62,715 contracts in the data reported through Tuesday. This was a weekly decrease of -5,098 contracts from the previous week which had a total of 67,813 net contracts.
This week’s current strength score (the trader positioning range over the past three years, measured from 0 to 100) shows the speculators are currently Bullish-Extreme with a score of 87.0 percent. The commercials are Bearish-Extreme with a score of 12.2 percent and the small traders (not shown in chart) are Bullish with a score of 71.2 percent.
Price Trend-Following Model: Uptrend
Our weekly trend-following model classifies the current market price position as: Uptrend.
| COFFEE Futures Statistics | SPECULATORS | COMMERCIALS | SMALL TRADERS |
| – Percent of Open Interest Longs: | 36.2 | 39.8 | 4.1 |
| – Percent of Open Interest Shorts: | 6.6 | 71.1 | 2.4 |
| – Net Position: | 62,715 | -66,254 | 3,539 |
| – Gross Longs: | 76,743 | 84,209 | 8,621 |
| – Gross Shorts: | 14,028 | 150,463 | 5,082 |
| – Long to Short Ratio: | 5.5 to 1 | 0.6 to 1 | 1.7 to 1 |
| NET POSITION TREND: | | | |
| – Strength Index Score (3 Year Range Pct): | 87.0 | 12.2 | 71.2 |
| – Strength Index Reading (3 Year Range): | Bullish-Extreme | Bearish-Extreme | Bullish |
| NET POSITION MOVEMENT INDEX: | | | |
| – 6-Week Change in Strength Index: | -4.1 | 4.1 | -1.2 |
SOYBEANS Futures:
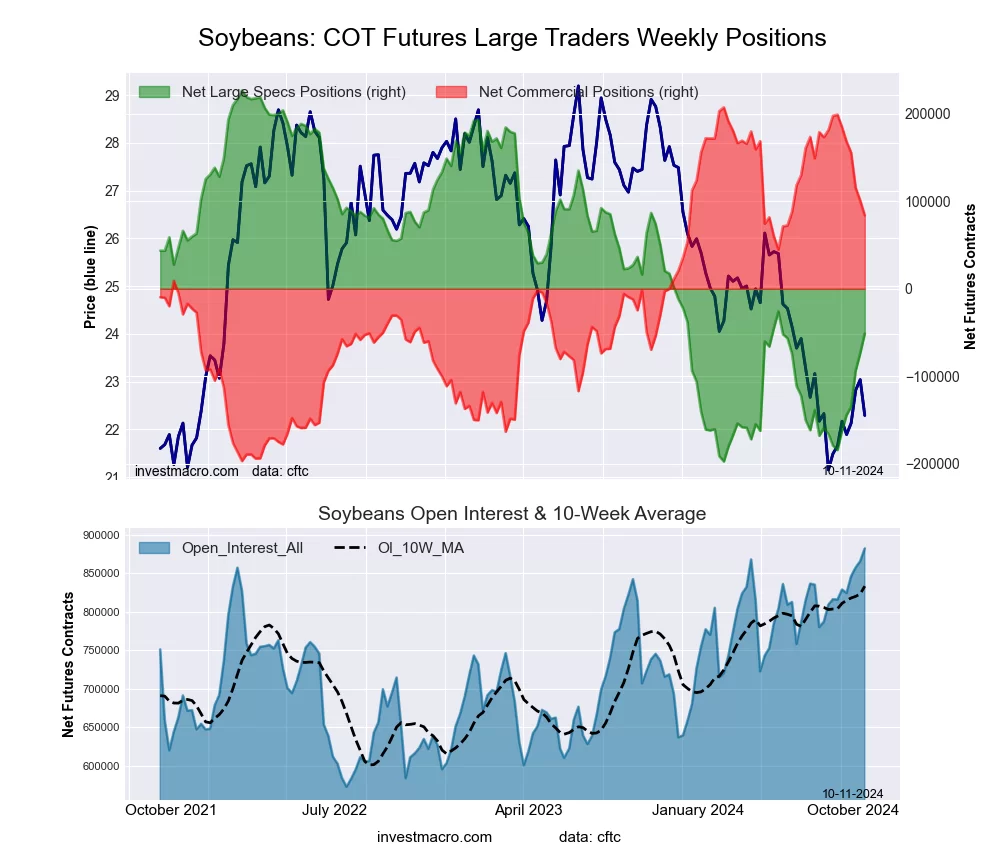 The SOYBEANS large speculator standing this week recorded a net position of -51,186 contracts in the data reported through Tuesday. This was a weekly boost of 22,511 contracts from the previous week which had a total of -73,697 net contracts.
This week’s current strength score (the trader positioning range over the past three years, measured from 0 to 100) shows the speculators are currently Bearish with a score of 34.5 percent. The commercials are Bullish with a score of 69.5 percent and the small traders (not shown in chart) are Bearish with a score of 27.1 percent.
Price Trend-Following Model: Downtrend
Our weekly trend-following model classifies the current market price position as: Downtrend.
| SOYBEANS Futures Statistics | SPECULATORS | COMMERCIALS | SMALL TRADERS |
| – Percent of Open Interest Longs: | 16.4 | 59.9 | 5.3 |
| – Percent of Open Interest Shorts: | 22.2 | 50.4 | 9.0 |
| – Net Position: | -51,186 | 83,915 | -32,729 |
| – Gross Longs: | 144,361 | 528,197 | 46,489 |
| – Gross Shorts: | 195,547 | 444,282 | 79,218 |
| – Long to Short Ratio: | 0.7 to 1 | 1.2 to 1 | 0.6 to 1 |
| NET POSITION TREND: | | | |
| – Strength Index Score (3 Year Range Pct): | 34.5 | 69.5 | 27.1 |
| – Strength Index Reading (3 Year Range): | Bearish | Bullish | Bearish |
| NET POSITION MOVEMENT INDEX: | | | |
| – 6-Week Change in Strength Index: | 31.4 | -28.5 | -47.0 |
SOYBEAN OIL Futures:
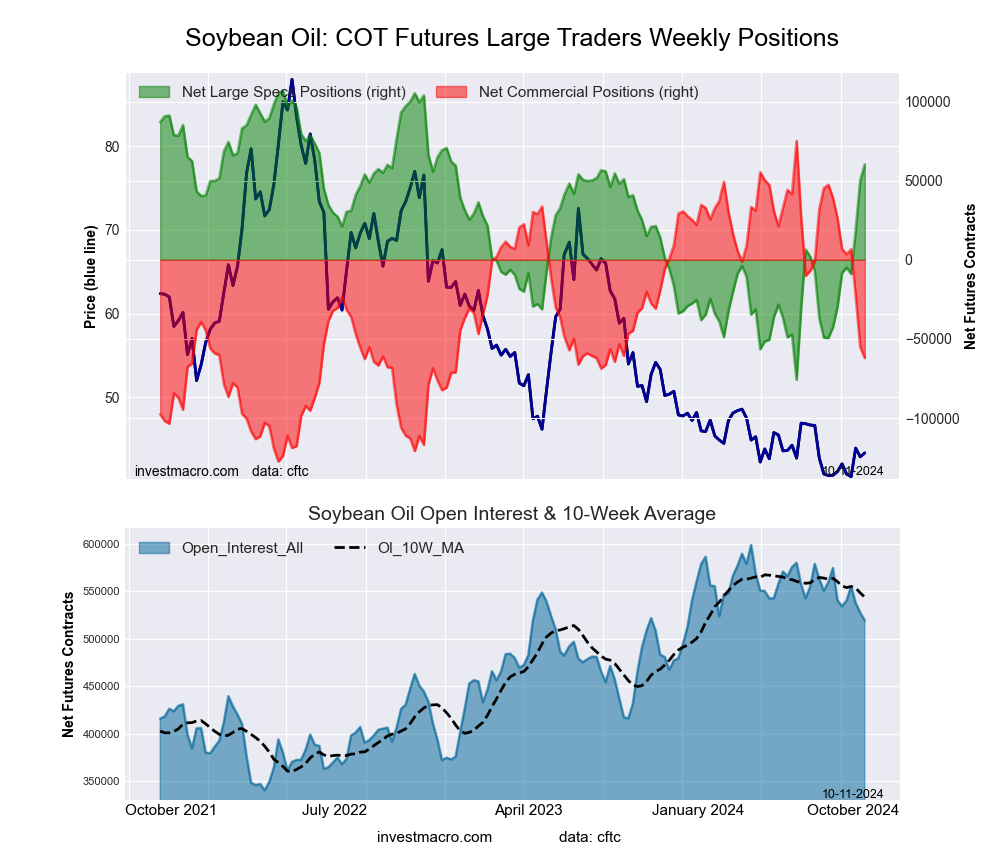 The SOYBEAN OIL large speculator standing this week recorded a net position of 60,259 contracts in the data reported through Tuesday. This was a weekly lift of 10,065 contracts from the previous week which had a total of 50,194 net contracts.
This week’s current strength score (the trader positioning range over the past three years, measured from 0 to 100) shows the speculators are currently Bullish with a score of 74.4 percent. The commercials are Bearish with a score of 32.3 percent and the small traders (not shown in chart) are Bearish with a score of 21.0 percent.
Price Trend-Following Model: Weak Downtrend
Our weekly trend-following model classifies the current market price position as: Weak Downtrend.
| SOYBEAN OIL Futures Statistics | SPECULATORS | COMMERCIALS | SMALL TRADERS |
| – Percent of Open Interest Longs: | 29.0 | 48.2 | 5.9 |
| – Percent of Open Interest Shorts: | 17.4 | 60.1 | 5.5 |
| – Net Position: | 60,259 | -62,043 | 1,784 |
| – Gross Longs: | 150,758 | 250,162 | 30,403 |
| – Gross Shorts: | 90,499 | 312,205 | 28,619 |
| – Long to Short Ratio: | 1.7 to 1 | 0.8 to 1 | 1.1 to 1 |
| NET POSITION TREND: | | | |
| – Strength Index Score (3 Year Range Pct): | 74.4 | 32.3 | 21.0 |
| – Strength Index Reading (3 Year Range): | Bullish | Bearish | Bearish |
| NET POSITION MOVEMENT INDEX: | | | |
| – 6-Week Change in Strength Index: | 49.3 | -43.6 | -7.0 |
SOYBEAN MEAL Futures:
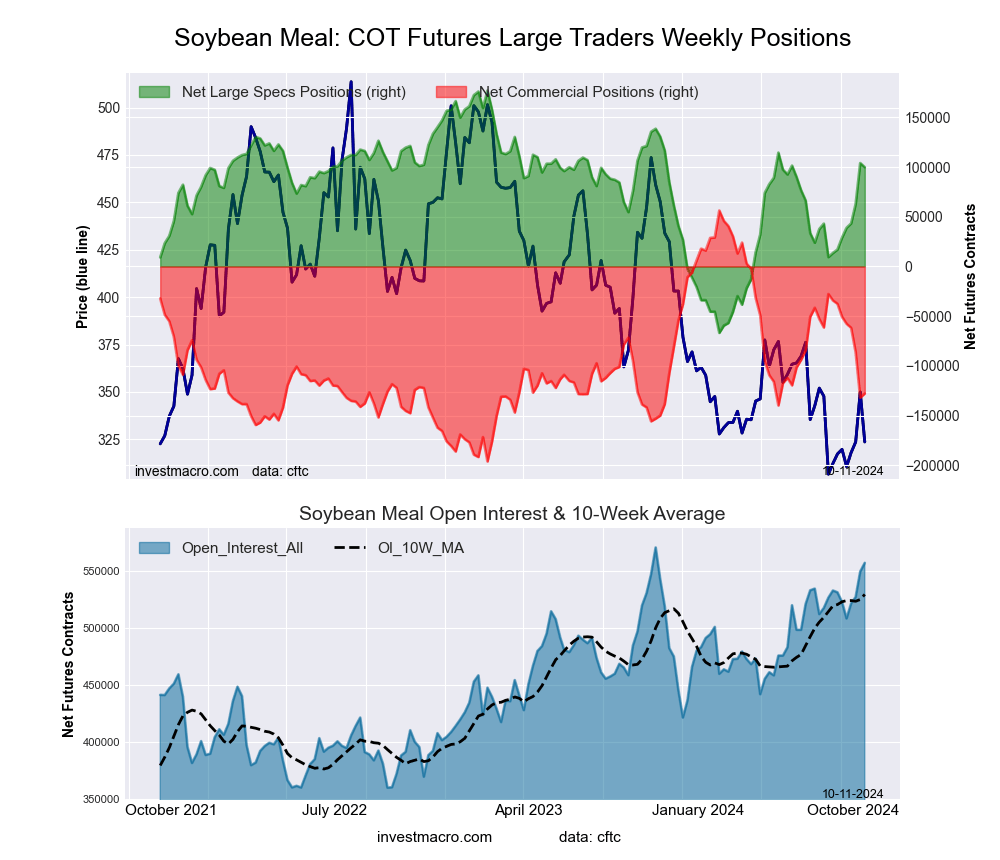 The SOYBEAN MEAL large speculator standing this week recorded a net position of 99,847 contracts in the data reported through Tuesday. This was a weekly decline of -4,175 contracts from the previous week which had a total of 104,022 net contracts.
This week’s current strength score (the trader positioning range over the past three years, measured from 0 to 100) shows the speculators are currently Bullish with a score of 68.4 percent. The commercials are Bearish with a score of 27.1 percent and the small traders (not shown in chart) are Bullish-Extreme with a score of 81.5 percent.
Price Trend-Following Model: Downtrend
Our weekly trend-following model classifies the current market price position as: Downtrend.
| SOYBEAN MEAL Futures Statistics | SPECULATORS | COMMERCIALS | SMALL TRADERS |
| – Percent of Open Interest Longs: | 28.9 | 40.9 | 9.8 |
| – Percent of Open Interest Shorts: | 11.0 | 63.8 | 4.8 |
| – Net Position: | 99,847 | -127,797 | 27,950 |
| – Gross Longs: | 160,991 | 227,883 | 54,493 |
| – Gross Shorts: | 61,144 | 355,680 | 26,543 |
| – Long to Short Ratio: | 2.6 to 1 | 0.6 to 1 | 2.1 to 1 |
| NET POSITION TREND: | | | |
| – Strength Index Score (3 Year Range Pct): | 68.4 | 27.1 | 81.5 |
| – Strength Index Reading (3 Year Range): | Bullish | Bearish | Bullish-Extreme |
| NET POSITION MOVEMENT INDEX: | | | |
| – 6-Week Change in Strength Index: | 34.0 | -35.7 | 33.3 |
LIVE CATTLE Futures:
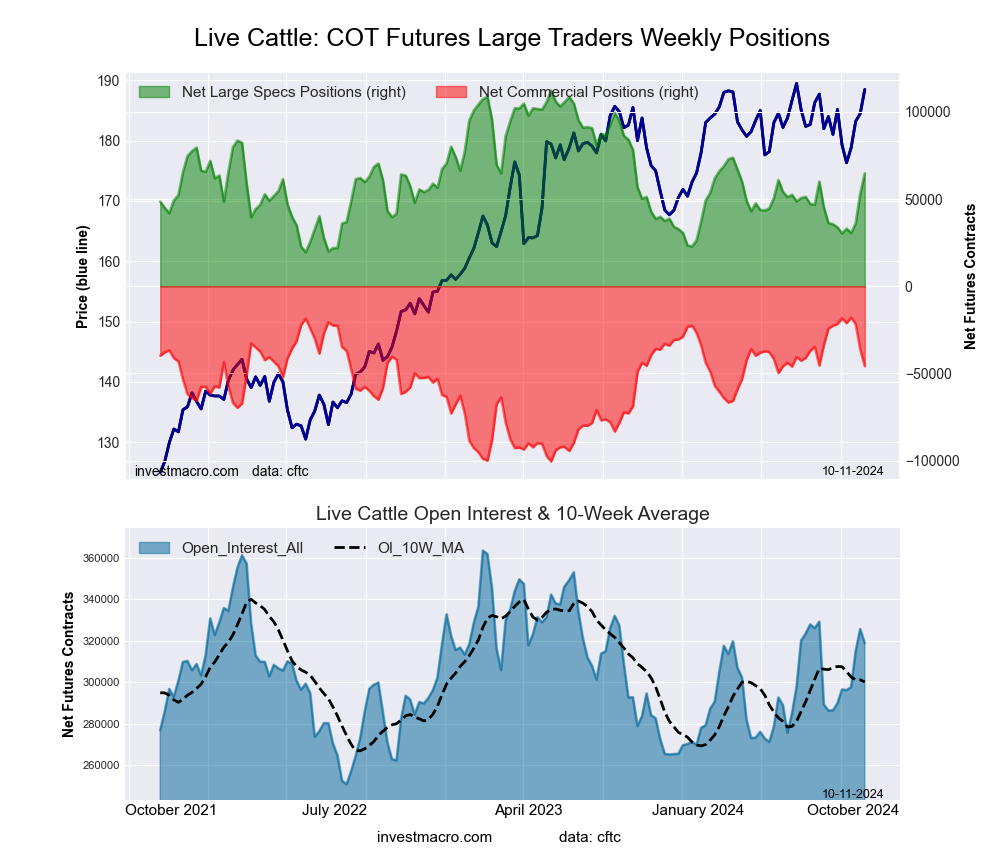 The LIVE CATTLE large speculator standing this week recorded a net position of 64,760 contracts in the data reported through Tuesday. This was a weekly lift of 11,909 contracts from the previous week which had a total of 52,851 net contracts.
This week’s current strength score (the trader positioning range over the past three years, measured from 0 to 100) shows the speculators are currently Bearish with a score of 48.8 percent. The commercials are Bullish with a score of 66.3 percent and the small traders (not shown in chart) are Bearish-Extreme with a score of 0.0 percent.
Price Trend-Following Model: Weak Downtrend
Our weekly trend-following model classifies the current market price position as: Weak Downtrend.
| LIVE CATTLE Futures Statistics | SPECULATORS | COMMERCIALS | SMALL TRADERS |
| – Percent of Open Interest Longs: | 40.2 | 34.5 | 7.7 |
| – Percent of Open Interest Shorts: | 19.9 | 48.9 | 13.7 |
| – Net Position: | 64,760 | -45,798 | -18,962 |
| – Gross Longs: | 128,051 | 110,049 | 24,596 |
| – Gross Shorts: | 63,291 | 155,847 | 43,558 |
| – Long to Short Ratio: | 2.0 to 1 | 0.7 to 1 | 0.6 to 1 |
| NET POSITION TREND: | | | |
| – Strength Index Score (3 Year Range Pct): | 48.8 | 66.3 | 0.0 |
| – Strength Index Reading (3 Year Range): | Bearish | Bullish | Bearish-Extreme |
| NET POSITION MOVEMENT INDEX: | | | |
| – 6-Week Change in Strength Index: | 33.4 | -29.4 | -32.3 |
LEAN HOGS Futures:
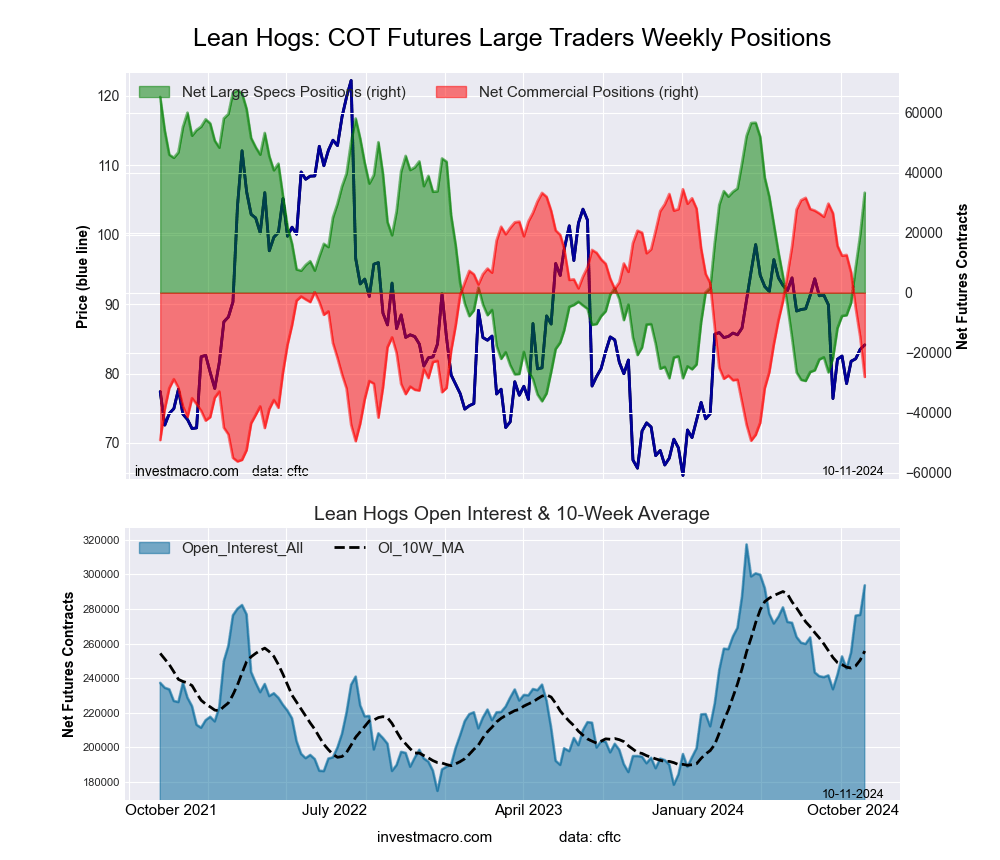 The LEAN HOGS large speculator standing this week recorded a net position of 33,305 contracts in the data reported through Tuesday. This was a weekly lift of 14,156 contracts from the previous week which had a total of 19,149 net contracts.
This week’s current strength score (the trader positioning range over the past three years, measured from 0 to 100) shows the speculators are currently Bullish with a score of 67.1 percent. The commercials are Bearish with a score of 31.0 percent and the small traders (not shown in chart) are Bullish with a score of 59.7 percent.
Price Trend-Following Model: Downtrend
Our weekly trend-following model classifies the current market price position as: Downtrend.
| LEAN HOGS Futures Statistics | SPECULATORS | COMMERCIALS | SMALL TRADERS |
| – Percent of Open Interest Longs: | 42.1 | 34.0 | 7.3 |
| – Percent of Open Interest Shorts: | 30.8 | 43.6 | 9.1 |
| – Net Position: | 33,305 | -28,030 | -5,275 |
| – Gross Longs: | 123,646 | 99,845 | 21,505 |
| – Gross Shorts: | 90,341 | 127,875 | 26,780 |
| – Long to Short Ratio: | 1.4 to 1 | 0.8 to 1 | 0.8 to 1 |
| NET POSITION TREND: | | | |
| – Strength Index Score (3 Year Range Pct): | 67.1 | 31.0 | 59.7 |
| – Strength Index Reading (3 Year Range): | Bullish | Bearish | Bullish |
| NET POSITION MOVEMENT INDEX: | | | |
| – 6-Week Change in Strength Index: | 43.6 | -48.2 | -6.5 |
COTTON Futures:
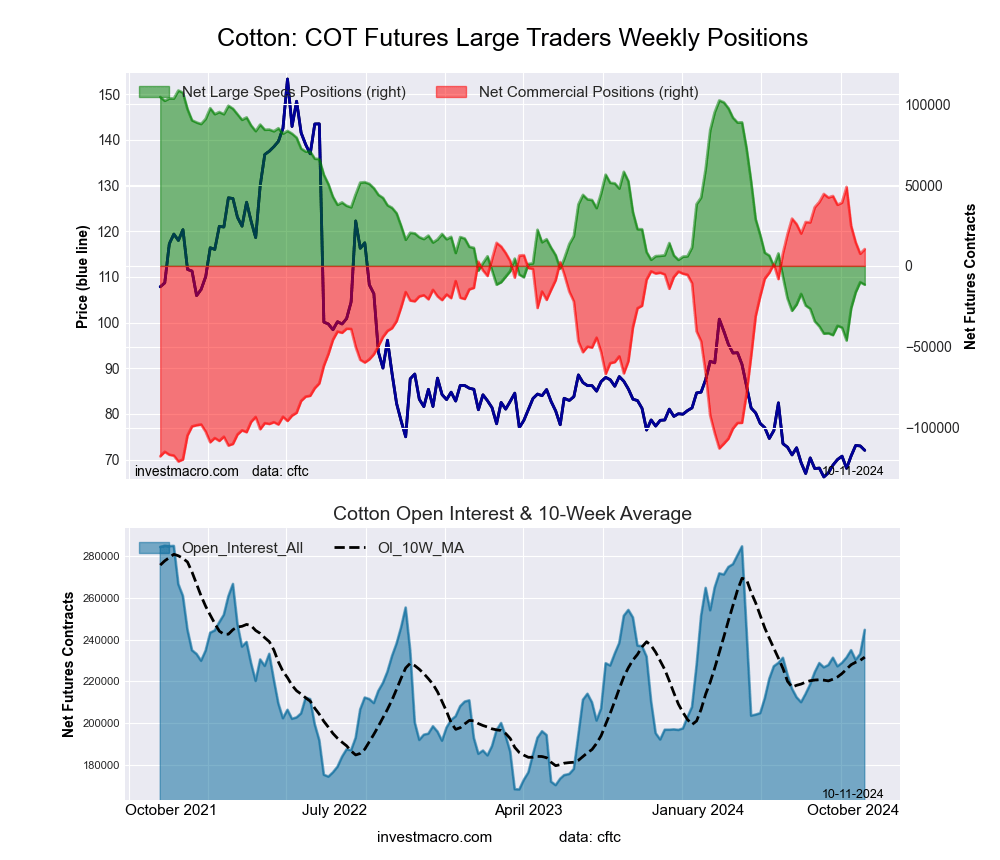 The COTTON large speculator standing this week recorded a net position of -11,641 contracts in the data reported through Tuesday. This was a weekly reduction of -1,553 contracts from the previous week which had a total of -10,088 net contracts.
This week’s current strength score (the trader positioning range over the past three years, measured from 0 to 100) shows the speculators are currently Bearish with a score of 22.3 percent. The commercials are Bullish with a score of 77.4 percent and the small traders (not shown in chart) are Bearish with a score of 23.9 percent.
Price Trend-Following Model: Weak Downtrend
Our weekly trend-following model classifies the current market price position as: Weak Downtrend.
| COTTON Futures Statistics | SPECULATORS | COMMERCIALS | SMALL TRADERS |
| – Percent of Open Interest Longs: | 25.3 | 49.4 | 5.7 |
| – Percent of Open Interest Shorts: | 30.1 | 45.1 | 5.2 |
| – Net Position: | -11,641 | 10,404 | 1,237 |
| – Gross Longs: | 61,941 | 120,801 | 14,048 |
| – Gross Shorts: | 73,582 | 110,397 | 12,811 |
| – Long to Short Ratio: | 0.8 to 1 | 1.1 to 1 | 1.1 to 1 |
| NET POSITION TREND: | | | |
| – Strength Index Score (3 Year Range Pct): | 22.3 | 77.4 | 23.9 |
| – Strength Index Reading (3 Year Range): | Bearish | Bullish | Bearish |
| NET POSITION MOVEMENT INDEX: | | | |
| – 6-Week Change in Strength Index: | 16.5 | -16.1 | 11.7 |
COCOA Futures:
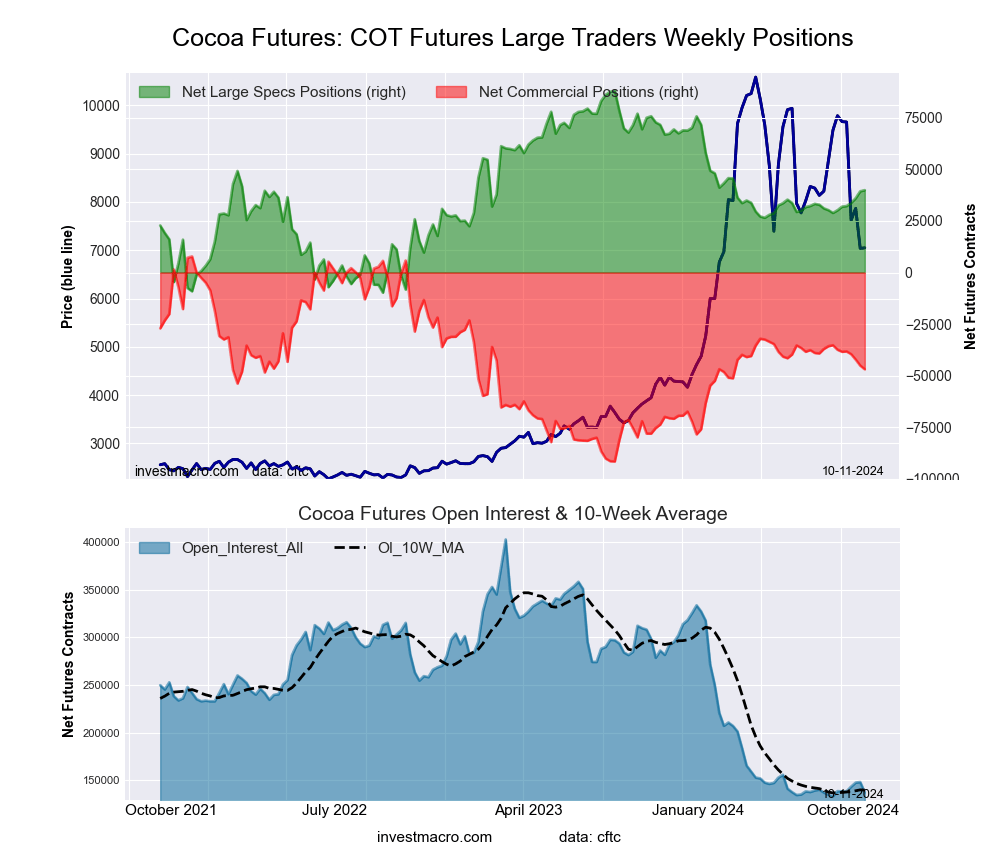 The COCOA large speculator standing this week recorded a net position of 39,936 contracts in the data reported through Tuesday. This was a weekly rise of 558 contracts from the previous week which had a total of 39,378 net contracts.
This week’s current strength score (the trader positioning range over the past three years, measured from 0 to 100) shows the speculators are currently Bullish with a score of 50.7 percent. The commercials are Bearish with a score of 45.0 percent and the small traders (not shown in chart) are Bullish with a score of 71.6 percent.
Price Trend-Following Model: Strong Downtrend
Our weekly trend-following model classifies the current market price position as: Strong Downtrend.
| COCOA Futures Statistics | SPECULATORS | COMMERCIALS | SMALL TRADERS |
| – Percent of Open Interest Longs: | 39.6 | 31.8 | 8.0 |
| – Percent of Open Interest Shorts: | 10.5 | 65.9 | 3.0 |
| – Net Position: | 39,936 | -46,917 | 6,981 |
| – Gross Longs: | 54,387 | 43,661 | 11,054 |
| – Gross Shorts: | 14,451 | 90,578 | 4,073 |
| – Long to Short Ratio: | 3.8 to 1 | 0.5 to 1 | 2.7 to 1 |
| NET POSITION TREND: | | | |
| – Strength Index Score (3 Year Range Pct): | 50.7 | 45.0 | 71.6 |
| – Strength Index Reading (3 Year Range): | Bullish | Bearish | Bullish |
| NET POSITION MOVEMENT INDEX: | | | |
| – 6-Week Change in Strength Index: | 9.9 | -9.5 | -2.4 |
WHEAT Futures:
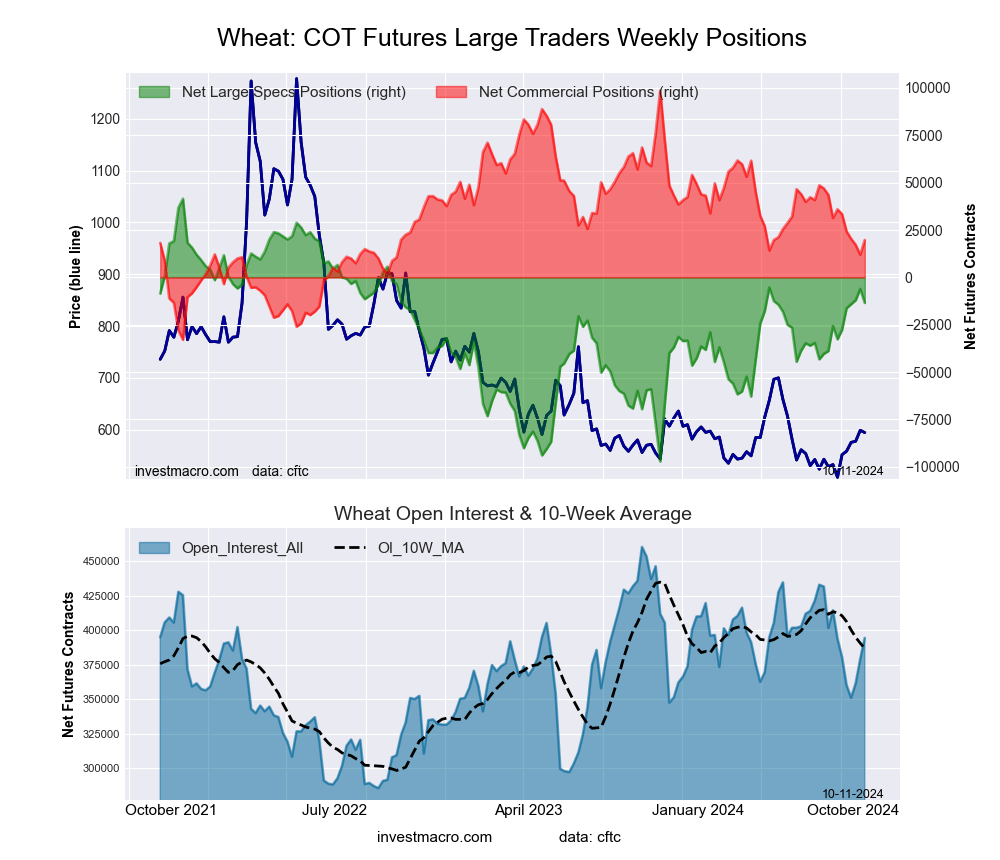 The WHEAT large speculator standing this week recorded a net position of -13,498 contracts in the data reported through Tuesday. This was a weekly decline of -7,366 contracts from the previous week which had a total of -6,132 net contracts.
This week’s current strength score (the trader positioning range over the past three years, measured from 0 to 100) shows the speculators are currently Bullish with a score of 60.4 percent. The commercials are Bearish with a score of 40.0 percent and the small traders (not shown in chart) are Bearish with a score of 23.8 percent.
Price Trend-Following Model: Weak Downtrend
Our weekly trend-following model classifies the current market price position as: Weak Downtrend.
| WHEAT Futures Statistics | SPECULATORS | COMMERCIALS | SMALL TRADERS |
| – Percent of Open Interest Longs: | 28.3 | 35.4 | 7.8 |
| – Percent of Open Interest Shorts: | 31.8 | 30.4 | 9.4 |
| – Net Position: | -13,498 | 19,744 | -6,246 |
| – Gross Longs: | 111,760 | 139,482 | 30,672 |
| – Gross Shorts: | 125,258 | 119,738 | 36,918 |
| – Long to Short Ratio: | 0.9 to 1 | 1.2 to 1 | 0.8 to 1 |
| NET POSITION TREND: | | | |
| – Strength Index Score (3 Year Range Pct): | 60.4 | 40.0 | 23.8 |
| – Strength Index Reading (3 Year Range): | Bullish | Bearish | Bearish |
| NET POSITION MOVEMENT INDEX: | | | |
| – 6-Week Change in Strength Index: | 13.8 | -12.3 | -16.3 |
Article By InvestMacro – Receive our weekly COT Newsletter
*COT Report: The COT data, released weekly to the public each Friday, is updated through the most recent Tuesday (data is 3 days old) and shows a quick view of how large speculators or non-commercials (for-profit traders) were positioned in the futures markets.
The CFTC categorizes trader positions according to commercial hedgers (traders who use futures contracts for hedging as part of the business), non-commercials (large traders who speculate to realize trading profits) and nonreportable traders (usually small traders/speculators) as well as their open interest (contracts open in the market at time of reporting). See CFTC criteria here.