
By RoboForex Analytical Department
Gold prices surged to 2,570 USD per troy ounce on Friday. New record highs became possible amid the weakening position of the US dollar and declining yields on US government bonds.
Gold prices began to rise after the release of another package of US macroeconomic statistics. The weekly initial jobless claims increased compared to the previous week and remained above average values. This signals a weakening employment market, which is confirmed by weak wage figures for August. Meanwhile, US producer prices increased slightly more than expected in August due to high maintenance costs. The overall trend still confirms easing inflationary pressures, which will allow the Federal Reserve to lower interest rates next week.
According to the CME FedWatch tool, the odds of a 25-basis-point interest rate cut is 59% now, while the likelihood of a 50-basis-point rate cut is estimated at 41%. Yesterday, the ECB lowered its interest rate by 60 basis points to 3.65% per annum, which is a good signal for gold prices.
XAU/USD technical analysis
Free Reports:
 Sign Up for Our Stock Market Newsletter – Get updated on News, Charts & Rankings of Public Companies when you join our Stocks Newsletter
 Get our Weekly Commitment of Traders Reports - See where the biggest traders (Hedge Funds and Commercial Hedgers) are positioned in the futures markets on a weekly basis.
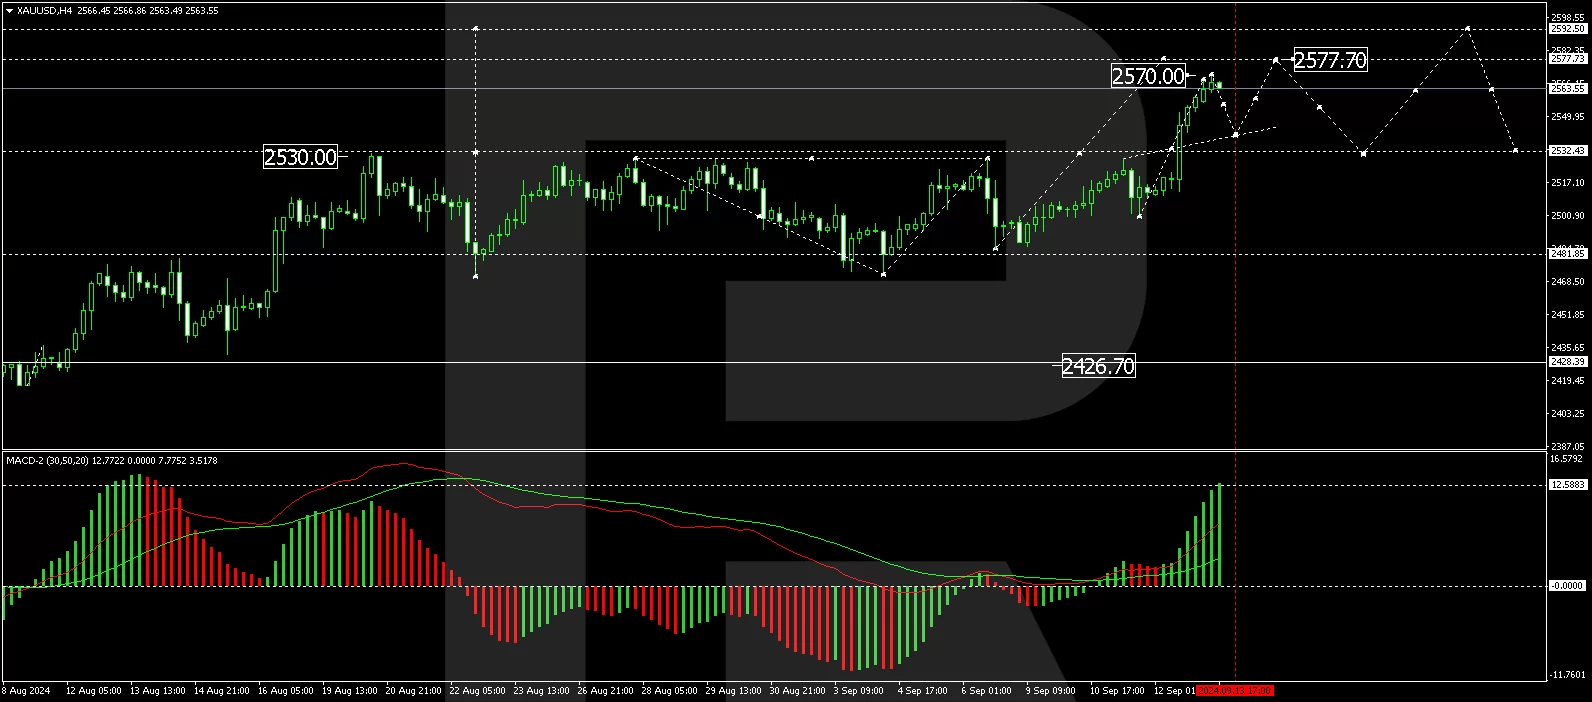
On the XAU/USD H4 chart, the market has broken above the consolidation range. A breakout of the 2,535.35 level can be considered as a market proposal to extend the growth wave to 2,570.00 and potentially further to 2,585.85. Today, the market has completed a wave, reaching 2,570.00. Subsequently, a technical decline to at least 2,541.55 (testing from above) could follow. Once the price hits this level, a growth structure might develop, aiming for the local target of 2,585.85. It is worth noting that breaking through the 2,535.35 level may result in a continuous growth structure to the 2,595.95 level, without a significant correction. This is the main target. This scenario is technically supported by the MACD indicator, whose signal line is above zero and pointing strictly upwards.
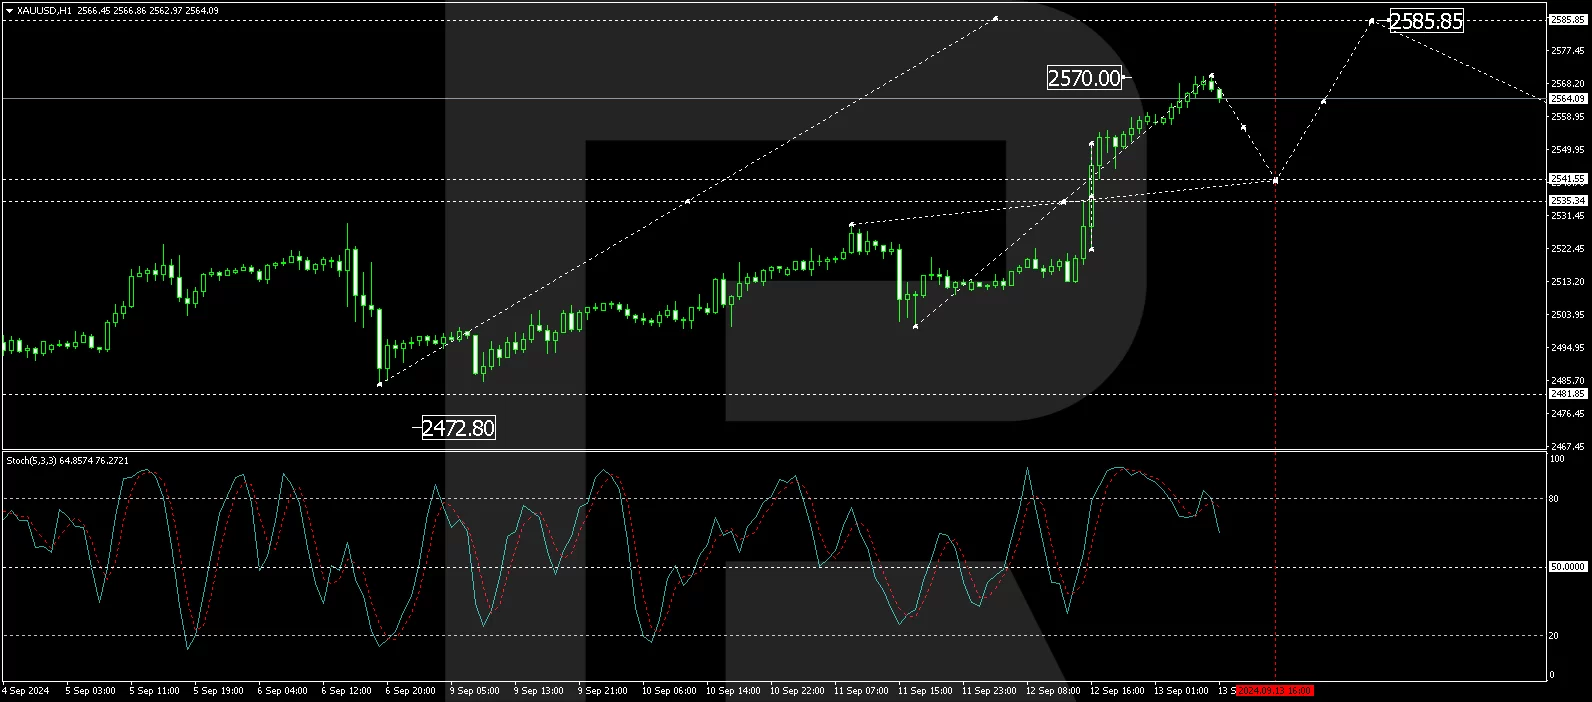
On the XAU/USD H1 chart, the market has completed a growth wave, reaching 2,570.00. A consolidation range is currently forming below this level. With a downward breakout, the price could decline to 2,541.55. An upward breakout will open the potential for a continuation of the trend to 2,585.85. This scenario is also technically supported by the Stochastic oscillator, whose signal line is around 80 and poised for a decline to 20.
Disclaimer
Any forecasts contained herein are based on the author’s particular opinion. This analysis may not be treated as trading advice. RoboForex bears no responsibility for trading results based on trading recommendations and reviews contained herein.

- This week will be one of the most crowded for central‑bank meetings Jul 27, 2026
- EUR/USD Ahead of a Key Week: Holding Near Lows Jul 27, 2026
- COT Metals Charts: Weekly Speculator Changes led by Copper Jul 26, 2026
- COT Bonds Charts: Speculator Bets led by SOFR 3-Months & 5-Year Bonds Jul 26, 2026
- COT Energy Charts: Weekly Speculator Bets led by WTI Crude & Natural Gas Jul 26, 2026
- COT Soft Commodities Charts: Weekly Speculator Bets led by Corn & Soybeans Jul 26, 2026
- The US introduces new import tariffs for 60 countries. Brent crude surpasses $100 per barrel Jul 24, 2026
- USD/JPY Breaks Records: Nothing Slows the Yen’s Decline Jul 24, 2026
- Oil prices reached a 6‑week high. The AUD strengthened on the back of a strong labor‑market report Jul 23, 2026
- EUR/USD Recovers as Dollar Weakens Jul 23, 2026
