Fed slashes rates by a half-point – what that means for the economy and the presidential election

By Michael Walden, North Carolina State University 

In a widely anticipated move, the Federal Reserve announced on Sept. 18, 2024, that it was cutting its benchmark interest rate by half a percentage point to a range of 4.75% to 5% – the first time the cost of borrowing has been lowered in four years.

The move marks an important pivot point, signaling that central bankers believe they have finally won their battle against inflation. It is also significant in timing, coming just months before the U.S. heads to the polls in a tight election that could turn on how Americans feel the economy is going.

The Conversation U.S. spoke with Mike Walden, distinguished professor emeritus at North Carolina State University, about what the rate cut means for the U.S. economy – and possibly the presidential campaign.

What does the Fed rate cut suggest about the state of the economy?

The Federal Reserve has two mandates: to pin inflation to around its target of 2% and to keep unemployment low. And the central bank balances that twin mandate when looking at whether to raise or lower base rates, or keep them the same.

For some time now, policymakers have concentrated on trying to get inflation under control through a series of interest rate hikes that took the Fed’s benchmark or base rate from a range of 0% to 0.25% in early 2022 to 5.25% to 5.5% in September 2024.

I believe what motivated them to drop the rate by a half-point now – rather than the quarter-point that some were expecting – is the labor market. The labor market is not exactly shaky – unemployment is currently at 4.2% – but it isn’t as robust as it was.

The latest job numbers were a little below expectations. And some economists are saying that there is a recession ahead. Indeed, there are some that are saying the U.S. is already in a recession.

So my guess is the majority of the Fed’s rate-setting board were convinced more by the latest unemployment data than inflation. In terms of the dual mandate, the Fed clearly feels it’s got the inflation fight in the bag, so it has turned to its second concern of keeping unemployment low.

So is this the soft landing the Fed was hoping for?

I would say so, yes. We are now in a soft landing – and I forecast the U.S. economy to slow but avoid a recession.

If I am right, then that is an achievement of Fed policy. A soft landing is very unusual – I can think of only one other occasion when it has occurred since the end of World War II. That was in mid-1995. And the story goes that then-Fed chair Alan Greenspan, during his daily soak in a tub for a bad back, became worried about the prospect of significantly higher prices. He proceeded to convince the Fed board to raise rates, which it did – a move that headed off a potential recession.

What impact will the rate cut have?

The first thing to note is that this will not mean we are returning back to 2019 prices – that would take wage cuts and deflation. This will merely slow inflation, or the rate at which prices rise.

But it will have an impact. In the first hour after the decision was made, stock markets jumped on the news – so investors were clearly happy – though the major indices ended the day lower.

Investment markets tend to anticipate any expected change, so we have already seen some lowering of mortgage rates – which have been trending down in the run-up to the Fed decision. Credit card interest rates have been trending down, too.

So the markets were clearly expecting a Fed rate cut. But we should see further drops in mortgage rates because the Fed has hinted at more interest rate cuts to come.

Is there a danger that some observers will see this as a political move?

I’m sure a lot of people will read this as Fed Chair Jay Powell helping the Democrats by cutting rates before the election.

But this is an economic-driven decision. There is no evidence that this has anything to do with the election.

What does history tell us about rate cuts and elections?

I think most serious observers know that the Fed is independent and makes decisions based purely on what is best for the economy. In fact, over the past 50 years, you will only find one period when eyebrows were raised. That was during the Nixon administration.

Under Fed Chair Arthur Burns, the central bank was accused of pumping money in the the system and cutting rates to make things look prosperous in advance of the 1972 election. But it later all blew up when the U.S. headed into a period of double-digit inflation.

Aside from that, you will be hard-pressed to find real evidence of interference. In fact, since then, presidential candidates from both parties have complained about the Fed.

Nonetheless, could the rate cut play into the election campaign?

In terms of how Americans feel about the economy? Not really. I don’t think mortgage rates will drop much more. And although the news is encouraging for borrowers, there is another side of rate cuts: They are negative for some types of investors. Money market investors, for example, will not look upon the Fed move so fondly.

But that doesn’t mean the two presidential tickets won’t try to turn the news to their benefit.

Democrats will happily take any credit for getting inflation back down on their watch and will point out how it will help Americans with home loans – avoiding the fact that they don’t actually have any role in the rate decisions themselves.

Meanwhile, Republicans might well say: “Hey, the Fed dropped rates because the economy is worse than we thought. And a half-point cut means they are desperate, the economy is horrible and we are heading for recession because of the Biden administrations’s policies.”The Conversation

About the Author:

Michael Walden, Professor and Extension Economist, North Carolina State University

This article is republished from The Conversation under a Creative Commons license. Read the original article.

The US Federal Reserve will begin its rate-cutting cycle today. In the UK, inflation figures were unchanged

By JustMarkets

At Tuesday’s close, the Dow Jones Index (US30) was down 0.04%, while the S&P 500 Index (US500) added 0.03%. The NASDAQ Technology Index (US100) closed positive 0.20%. Yesterday afternoon, equities came under pressure from long liquidations after bond yields rose ahead of the release of the results of the 2-day FOMC meeting on Wednesday.

Retail Sales for August unexpectedly rose by 0.1% m/m, stronger than expectations of a 0.2% m/m decline. US manufacturing production in August added 0.9% m/m, which was stronger than expectations of 0.2% m/m and was the largest increase in the last 6 months. Such data, along with the GDP growth estimates for Q3, allows the US Fed to start the easing cycle with a 0.25% rate hike. Fed Chair Powell’s comments after Wednesday’s meeting will also be scrutinized for further Fed policy intentions. Markets rate the odds of a 25bp rate cut at Tuesday/Wednesday’s FOMC meeting at 100% and a 50bp rate cut at this meeting at 52%.

Equity markets in Europe traded flat yesterday. The German DAX (DE40) rose by 0.50%, the French CAC 40 (FR40) closed higher by 0.51%, the Spanish IBEX 35 (ES35) Index gained 1.06%, the British FTSE 100 (UK100) closed up 0.38%.

The UK’s annual inflation rate for August 2024 remained at 2.2%, in line with July expectations. CPI rose 0.3% from the previous month, after falling 0.2% in July and matched expectations. The latest data had little impact on expectations that the Bank of England will keep policy steady on Thursday.

WTI crude oil prices fell to around $71 a barrel on Wednesday, breaking a two-day streak of gains, amid an unexpected increase in US crude inventories. API data showed US crude inventories rose by 1.96 million barrels last week, breaking a three-week streak of declines and beating market expectations for a 0.1 million barrel decline.

Silver fell below $30.5 an ounce, retreating from two-month highs, as traders grew cautious ahead of the US Federal Reserve’s expected monetary policy decision. In addition, disappointing economic data from China added to concerns about demand in the country, the world’s top metals consumer. Data released over the weekend showed that China’s industrial production, retail sales, and fixed asset investment in August fell short of prognoses.

Asian markets traded mixed yesterday. Japan’s Nikkei 225 (JP225) was down 1.03%, China’s FTSE China A50 (CHA50) did not trade due to a holiday, Hong Kong’s Hang Seng (HK50) was up 1.37%, and Australia’s ASX 200 (AU200) was positive 0.24%.

In Australia, investors await the country’s employment report on Thursday to gauge the state of the labor market and its potential impact on domestic monetary policy. Markets see a 4.35% cut in the money rate at next week’s Reserve Bank meeting as unlikely, given that policymakers have consistently maintained a hawkish stance.

S&P 500 (US500) 5,634.58 +1.49 (+0.03%)

Dow Jones (US30) 41,606.18 −15.90 (−0.04%)

DAX (DE40) 18,726.08 −15.90 (−0.04%)

FTSE 100 (UK100) 8,309.86 +31.42 (+0.38%)

USD Index 101.03 +0.26 (+0.26%)

News feed for: 2024.09.18

  • Japan Trade Balance (m/m) at 02:50 (GMT+3);
  • UK Consumer Price Index (m/m) at 09:00 (GMT+3);
  • UK Producer Price Index (m/m) at 09:00 (GMT+3);
  • Eurozone Consumer Price Index (m/m) at 12:00 (GMT+3);
  • US Building Permits (m/m) at 15:30 (GMT+3);
  • US Crude Oil Reserves (w/w) at 17:30 (GMT+3);
  • US Fed Interest Rate Decision at 21:00 (GMT+3);
  • US FOMC Statement at 21:00 (GMT+3);
  • US FOMC Economic Projections at 21:00 (GMT+3);
  • US FOMC Press Conference at 21:30 (GMT+3).

By JustMarkets


This article reflects a personal opinion and should not be interpreted as an investment advice, and/or offer, and/or a persistent request for carrying out financial transactions, and/or a guarantee, and/or a forecast of future events.

USDJPY Experiences Renewed Decline as Market Adjusts Expectations

By RoboForex Analytical Department

The USDJPY pair is currently stabilising around 141.44 on Wednesday, following a brief strengthening of the US dollar which impacted the yen negatively the previous day. Despite this, the overarching downward trend for the pair persists.

Tuesday witnessed strong US retail sales data, bolstering the dollar’s strength temporarily and leading to a correction in the JPY. However, as the week progresses, attention is also turning towards the Bank of Japan (BoJ), which is holding its policy meeting alongside the Federal Reserve’s gathering.

The baseline expectation is that the BoJ will maintain its interest rate unchanged. Nevertheless, signals might emerge from the meeting indicating a readiness to tighten monetary policy later in the year. With two more meetings scheduled before year-end, in October and December, investor anticipation is growing for a potential rate hike in December, although expectations for October remain very low.

Today’s focus is heavily on the Fed, which is widely anticipated to cut rates by 50 basis points, marking the first rate reduction in four years. This significant move could impact global currency dynamics, including the USDJPY pair.

Recent statistics from Japan showed only a minimal rise in imports over the past five months and subdued growth in exports for August, adding to the complex economic landscape.

Overall sentiment towards the yen remains positive, bolstered by the BoJ’s cautious approach to gradually tightening monetary conditions.

Technical analysis of USDJPY

The USDJPY market has previously formed a consolidation range just below the level of 141.26, and with an upward breach of this range, the target at 142.42 was achieved. A corrective move to 141.22 has been established, and a further rise to 143.20 is anticipated. Upon reaching this peak, the potential for a new decline towards 137.77 will be considered. The MACD indicator supports this view, with the signal line below zero but pointing upwards, suggesting upward momentum in the short term.

On the H1 chart, following the completion of the corrective wave to 141.22, the market is expected to continue its upward trajectory towards 143.20. After achieving this level, a new decline to 141.20 is anticipated, with a breach below this level potentially signalling a continuation of the downward trend towards 137.77. The Stochastic oscillator, with its signal line above 20 and directed upwards, corroborates the likelihood of further upward movement before a potential reversal.


Disclaimer

Any forecasts contained herein are based on the author’s particular opinion. This analysis may not be treated as trading advice. RoboForex bears no responsibility for trading results based on trading recommendations and reviews contained herein.

Countdown to Fed decision enters final hours

By ForexTime

  • Markets remain divided about size of Fed cut
  • USDInd on breakout watch ahead of Fed decision
  • Watch out for BoE and BoJ rate decisions this week
  • GBPUSD & USDJPY could see significant price swings

With just hours until the Federal Reserve prepares for its first rate cut since 2020, markets remain split on the size!

An unexpected jump in U.S. retail sales yesterday initially cooled bets around a 50-basis point move. However, the odds are back to roughly 66% this morning according to Fed Funds Futures.

Fed futures

Looking beyond the rate decision, much focus will be on Powell’s press conference and economic projections – especially the dot plot which may provide fresh clues into future policy moves.

This brings our attention to the USDInd which could experience a significant breakout. Support can be found at 100.52 and resistance at 101.94 as mentioned two weeks ago.

USDInd

Golden nugget: Over the past 12 months, the Fed decision has triggered upside moves of as much as 0.4% or declines of 0.7% in a 6-hour window post-release.

Whatever the outcome of the Fed decision, it has the potential to trigger fresh volatility across global markets.

But it does not end here…

On Thursday, it’s all about the Bank of England rate decision with the Bank of Japan under the spotlight on Friday.

As extensively covered in our week ahead, the BoE is widely expected to leave rates unchanged in September with the first cut expected by November.

However, what was not mentioned was how this could impact the GBPUSD.

This major currency pair is trading near a 2-week high, supported by a weaker dollar ahead of the Fed’s rate decision this evening.

With the BoE expected to leave interest rates unchanged and the Fed seen cutting rates, this combination could empower GBPUSD bulls. Still, how markets react to the policy statement and MPC member votes could affect how the currency pair concludes the week.

Golden nugget: Over the past 12 months, the BoE decision has triggered upside moves of as much as 0.6% or declines of 0.4% in a 6-hour window post-release.

Talking technicals…

The GBPUSD is trading roughly 0.5% away from it’s 2024 high with bulls in the driving seat.

  • A strong breakout above 1.3230 could open a path back toward 1.3265 and 1.3300.
  • Should 1.3230 prove reliable resistance, this could trigger a decline to the 21-day SMA at 1.3145.

gbpusd


Regarding the BoJ rate decision on Friday…

Investors will be on the lookout for fresh clues on future policy moves. As of writing, traders are only pricing in a 33% probability of a BoJ hike by the end of 2024 with the odds jumping to 70% by May 2025.

Still, the Yen is the best performing G10 currency against the USD this month with the USDJPY respecting a bearish trend.

Golden nugget: Over the past 12 months, the BoJ decision has triggered upside moves of as much as 1.1% or declines of 0.5% in a 6-hour window post-release.

Prices are trading below the 21, 50, 100 and 200-day SMA while the Relative Strength Index (RSI) is flirting near oversold territory.

  • A breakout above 143.00 may open a path towards the 21-day SMA at 143.80.
  • Should prices secure a daily close below 140.00, bears may target 138.30.

usdjpy


Forex-Time-LogoArticle by ForexTime

ForexTime Ltd (FXTM) is an award winning international online forex broker regulated by CySEC 185/12 www.forextime.com

Gold (XAUUSD) Holds Near Record Highs Amid Anticipation of Fed Rate Cut

By RoboForex Analytical Department

Gold prices remained stable at around $2580 per troy ounce on Tuesday, hovering close to their record highs. This resilience in the gold market is largely driven by the weakening US dollar and heightened expectations for a substantial interest rate cut by the Federal Reserve.

Current projections from the CME FedWatch tool indicate a 67% likelihood of a 50 basis point cut in today’s Fed meeting, a significant increase from the 40% chance noted yesterday. Additionally, there’s a 33% probability of a more modest 25 basis point reduction. These expectations have significantly influenced market sentiment, prompting investors to flock to gold as a protective asset.

Recent geopolitical events, such as the attempted assassination of US presidential candidate Donald Trump, have also underscored the metal’s appeal as a safe haven, leading to a spike in demand during times of perceived instability.

The potential easing of US monetary policy, expected to be confirmed in Wednesday’s Fed announcement, further bolsters gold’s attractiveness. With its lack of coupon income, gold becomes more appealing during periods when yields on US government bonds are falling, and the Dollar Index (DXY) is weakening.

Technical analysis of Gold (XAU/USD)

Gold broke through the consolidation range at 2530.00 and executed a growth wave up to 2586.00. The market has now reached the expansion potential of this range and is forming a new consolidation zone at these highs. The primary expectation is for a downward move to 2555.50, potentially extending into a corrective phase towards 2530.00. The MACD indicator supports this scenario, showing signal lines above zero but starting a downward trajectory, indicating the potential for a forthcoming decline.

On the H1 chart, gold reached up to 2588.88 and is currently consolidating just below this peak. A break below this consolidation could lead to a move down to 2555.50. Conversely, a break above could briefly push prices towards 2600.00 before a potential reversal to 2530.00. The Stochastic oscillator, with its signal line below 50 and pointing sharply downward towards 20, corroborates this expected downward movement.


Disclaimer

Any forecasts contained herein are based on the author’s particular opinion. This analysis may not be treated as trading advice. RoboForex bears no responsibility for trading results based on trading recommendations and reviews contained herein.

America’s dairy farms are disappearing, down 95% since the 1970s − milk price rules are one reason why

By Elizabeth Eckelkamp, University of Tennessee 

Milton Orr looked across the rolling hills in northeast Tennessee. “I remember when we had over 1,000 dairy farms in this county. Now we have less than 40,” Orr, an agriculture adviser for Greene County, Tennessee, told me with a tinge of sadness.

That was six years ago. Today, only 14 dairy farms remain in Greene County, and there are only 125 dairy farms in all of Tennessee. Across the country, the dairy industry is seeing the same trend: In 1970, over 648,000 U.S. dairy farms milked cattle. By 2022, only 24,470 dairy farms were in operation.

While the number of dairy farms has fallen, the average herd size – the number of cows per farm – has been rising. Today, more than 60% of all milk production occurs on farms with more than 2,500 cows.

A chart shows number of farms falling since 1970s and cows per farm rising in an inverse fashion.
Dairy farm numbers have fallen over the past few decades, but larger farms have kept the overall number of cows fairly steady.
USDA

This massive consolidation in dairy farming has an impact on rural communities. It also makes it more difficult for consumers to know where their food comes from and how it’s produced.

As a dairy specialist at the University of Tennessee, I’m constantly asked: Why are dairies going out of business? Well, like our friends’ Facebook relationship status, it’s complicated.

The problem with pricing

The biggest complication is how dairy farmers are paid for the products they produce.

In 1937, the Federal Milk Marketing Orders, or FMMO, were established under the Agricultural Marketing Agreement Act. The purpose of these orders was to set a monthly, uniform minimum price for milk based on its end use and to ensure that farmers were paid accurately and in a timely manner.

Farmers were paid based on how the milk they harvested was used, and that’s still how it works today.

Does it become bottled milk? That’s Class 1 price. Yogurt? Class 2 price. Cheddar cheese? Class 3 price. Butter or powdered dry milk? Class 4. Traditionally, Class 1 receives the highest price.

There are 11 FMMOs that divide up the country. The Florida, Southeast and Appalachian FMMOs focus heavily on Class 1, or bottled, milk. The other FMMOs, such as Upper Midwest and Pacific Northwest, have more manufactured products such as cheese and butter.

For the past several decades, farmers have generally received the minimum price. Improvements in milk quality, milk production, transportation, refrigeration and processing all led to greater quantities of milk, greater shelf life and greater access to products across the U.S. Growing supply reduced competition among processing plants and reduced overall prices.

Along with these improvements in production came increased costs of production, such as cattle feed, farm labor, veterinary care, fuel and equipment costs.

Researchers at the University of Tennessee in 2022 compared the price received for milk across regions against the primary costs of production: feed and labor. The results show why farms are struggling.

From 2005 to 2020, milk sales income per 100 pounds of milk produced ranged from $11.54 to $29.80, with an average price of $18.57. For that same period, the total costs to produce 100 pounds of milk ranged from $11.27 to $43.88, with an average cost of $25.80.

On average, that meant a single cow that produced 24,000 pounds of milk brought in about $4,457. Yet, it cost $6,192 to produce that milk, meaning a loss for the dairy farmer.

More efficient farms are able to reduce their costs of production by improving cow health, reproductive performance and feed-to-milk conversion ratios. Larger farms or groups of farmers – cooperatives such as Dairy Farmers of America – may also be able to take advantage of forward contracting on grain and future milk prices. Investments in precision technologies such as robotic milking systems, rotary parlors and wearable health and reproductive technologies can help reduce labor costs across farms.

Regardless of size, surviving in the dairy industry takes passion, dedication and careful business management.

Some regions have had greater losses than others, which largely ties back to how farmers are paid, meaning the classes of milk, and the rising costs of production in their area. There are some insurance and hedging programs that can help farmers offset high costs of production or unexpected drops in price. If farmers take advantage of them, data shows they can functions as a safety net, but they don’t fix the underlying problem of costs exceeding income.

Passing the torch to future farmers

Why do some dairy farmers still persist, despite low milk prices and high costs of production?

For many farmers, the answer is because it is a family business and a part of their heritage. Ninety-seven percent of U.S. dairy farms are family owned and operated.

Some have grown large to survive. For many others, transitioning to the next generation is a major hurdle.

The average age of all farmers in the 2022 Census of Agriculture was 58.1. Only 9% were considered “young farmers,” age 34 or younger. These trends are also reflected in the dairy world. Yet, only 53% of all producers said they were actively engaged in estate or succession planning, meaning they had at least identified a successor.

How to help family dairy farms thrive

In theory, buying more dairy would drive up the market value of those products and influence the price producers receive for their milk. Society has actually done that. Dairy consumption has never been higher. But the way people consume dairy has changed.

Americans eat a lot, and I mean a lot, of cheese. We also consume a good amount of ice cream, yogurt and butter, but not as much milk as we used to.

Does this mean the U.S. should change the way milk is priced? Maybe.

The FMMO is currently undergoing reform, which may help stem the tide of dairy farmers exiting. The reform focuses on being more reflective of modern cows’ ability to produce greater fat and protein amounts; updating the cost support processors receive for cheese, butter, nonfat dry milk and dried whey; and updating the way Class 1 is valued, among other changes. In theory, these changes would put milk pricing in line with the cost of production across the country.

The U.S. Department of Agriculture is also providing support for four Dairy Business Innovation Initiatives to help dairy farmers find ways to keep their operations going for future generations through grants, research support and technical assistance.

Another way to boost local dairies is to buy directly from a farmer. Value-added or farmstead dairy operations that make and sell milk and products such as cheese straight to customers have been growing. These operations come with financial risks for the farmer, however. Being responsible for milking, processing and marketing your milk takes the already big job of milk production and adds two more jobs on top of it. And customers have to be financially able to pay a higher price for the product and be willing to travel to get it.The Conversation

About the Author:

Elizabeth Eckelkamp, Associate Professor of Animal Science and Dairy Extension Specialist, University of Tennessee

This article is republished from The Conversation under a Creative Commons license. Read the original article.


EUR/USD Gains as Fed Meeting Approaches

By RoboForex Analytical Department 

EUR/USD is showing signs of strengthening, currently trading around 1.1088 on Monday. The pair saw significant gains at the end of last week, driven by mounting speculation over the Federal Reserve’s upcoming interest rate decision. The US dollar weakened in response to increasing expectations that the Fed might cut rates by 50 basis points in its forthcoming meeting.

The shift in market sentiment has been substantial, with the probability of a 50 basis point cut now at 45%, up from just 20% a week earlier. This anticipation has led to a decrease in US Treasury bond yields, further affecting the dollar’s strength. Additionally, US import prices fell more than expected in August, decreasing by 0.3%, and export prices dropped by 0.7%. A sentiment index from the University of Michigan also showed an improvement in annual inflation expectations in September.

Conversely, the European Central Bank (ECB), which reduced its rate last week, continues to assert its independence. ECB President Christine Lagarde reiterated that the ECB operates free of political influence, responding to Italian demands for further rate reductions.

The upcoming Federal Reserve meeting, scheduled to start on Tuesday and conclude on Wednesday with a rate decision and commentary, is the focal point for markets this week. Investors are closely monitoring these developments, which could significantly impact the EUR/USD dynamics.

Technical analysis of EUR/USD

The EUR/USD market has established a consolidation range around 1.1088, extending down to 1.1073 and up to 1.1104. The market may potentially move downward to 1.1055 before possibly climbing to 1.1106, with a further stretch to 1.1128. The formation of a ‘Triangle’ technical pattern is considered likely. This scenario is supported by the MACD indicator, which is below zero but trending upward.

A growth wave to 1.1100 has been completed on the H1 chart. The market is currently forming a consolidation range around 1.1088, with a corrective structure down to 1.1073 followed by an emerging growth structure towards 1.1106. After reaching this level, a decline to 1.1055 may be considered. The Stochastic oscillator, currently below 80 and heading towards 20, supports this potential downward movement.


Disclaimer

Any forecasts contained herein are based on the author’s particular opinion. This analysis may not be treated as trading advice. RoboForex bears no responsibility for trading results based on trading recommendations and reviews contained herein.

The US Federal Reserve may start the rate-cutting cycle with a 0.5% move. Silver reached a 2-month high

By JustMarkets

On Friday, the Dow Jones (US30) was up 0.72% (for the week +2.07%), while the S&P 500 (US500) added 0.54% (for the week +3.38%). The NASDAQ Technology Index (US100) closed positive 0.65% (for the week +5.04%). The S&P 500 and Nasdaq100 hit 2-week highs, and the Dow Jones Industrials hit a one-week high.

Former New York FRB President Bill Dudley said Thursday there is a strong case for a 50 basis point interest rate cut at the Fed’s September 17–18 meeting. But Goldman Sachs is still calling for a quarter percentage point rate easing at this week’s Federal Open Market Committee meeting. Markets rate the odds of a 25 bps rate cut at the Sept. 17–18 FOMC meeting at 41% and a 50 bps rate cut at that meeting at 59%.

The US University of Michigan Consumer Sentiment Index for September rose more than expected to a 4-month high, supporting the outlook for a soft landing for the economy, a favorable factor for indices.

Bank of Canada Governor Tiff Macklem opened the door for an increased pace of interest rate cuts: Macklem told the newspaper that regulators are concerned about Canada’s labor market and the possibility that lower oil prices will hit the economy.

Equity markets in Europe rallied on Friday. Germany’s DAX (DE40) rose by 0.98% (up +1.74% for the week), France’s CAC 40 (FR40) closed up 0.41% (up +1.20% for the week), Spain’s IBEX 35 (ES35) increased by 1.23% (up +2.86% for the week), and the UK’s FTSE 100 (UK100) closed positive 0.39% (up +1.12% for the week).

ECB President Lagarde said she is willing to consider an interest rate cut in October if the Eurozone economy suffers a major setback, but a rate cut at the December ECB meeting is more likely as the ECB will have better information on the economy by then. ECB Governing Council spokesman Kazakhs said the ECB would need a downturn in the Eurozone economy for it to cut interest rates at its next meeting in October.

Silver rose to $31, hitting a two-month high, amid growing expectations that the US Federal Reserve will opt for a more aggressive interest rate cut at this week’s meeting. Markets now estimate the probability of the Fed going for a larger 50 basis point rate cut on Wednesday at 59%, up from 25% a month ago, while the probability of a modest 25 basis point rate cut is 41%, according to CME’s FedWatch tool. Those expectations came as signs of a slowing labor market outweighed a better-than-expected reading on key inflation indicators last week.

WTI crude oil prices fell slightly to $68.65 a barrel on Friday, breaking a two-day winning streak. As of Thursday, official data showed that nearly 42% of oil production, which is more than 730,000 barrels per day, remained shut in due to the hurricane. Despite these supply disruptions, oil prices are under downward pressure amid ongoing concerns about sluggish demand in major markets. The IEA has warned of a slowdown in global oil demand growth, particularly due to China’s weakening economy, and predicted a potential supply glut in 2024, even as OPEC+ production cuts continue. Last week, data was released showing a 3.1% year-on-year decline in China’s crude oil imports from January through August 2024.

Asian markets were mostly up last week. Japan’s Nikkei 225 (JP225) rose by 2.17%, China’s FTSE China A50 (CHA50) lost 1.26%, Hong Kong’s Hang Seng (HK50) gained 0.62%, and Australia’s ASX 200 (AU200) posted a positive 1.08%.

China’s economic recovery continues to face major challenges amid persistent weak domestic demand and mounting external pressures, the National Statistics Agency said in a statement. The remarks followed weak activity data in August, marked by the slowest growth in industrial production in five months, and updated retail sales data that missed market estimates. Meanwhile, the urban unemployment rate hit a six-month high of 5.3% in August.

S&P 500 (US500) 5,626.02 +30.26 (+0.54%)

Dow Jones (US30) 41,393.78 +297.01 (+0.72%)

DAX (DE40) 18,699.40 +181.01 (+0.98%)

FTSE 100 (UK100) 8,273.09 +32.12 (+0.39%)

USD Index 101.11 –0.25 (–0.25%)

News feed for: 2024.09.16

  • Switzerland Producer Price Index (m/m) at 09:30 (GMT+3);
  • Eurozone Trade Balance (m/m) at 12:00 (GMT+3).

By JustMarkets


This article reflects a personal opinion and should not be interpreted as an investment advice, and/or offer, and/or a persistent request for carrying out financial transactions, and/or a guarantee, and/or a forecast of future events.

Taiwan Semiconductor’s 10% Dip: Is It Time to Buy?

By The Ino.com Team

With a $897.58 billion market cap, Taiwan Semiconductor Manufacturing Company Limited (TSM) plays a crucial role in the global semiconductor ecosystem by leading in the production of advanced chips used across several industries, including consumer electronics, automotive, telecom, and artificial intelligence (AI).

As one of the world’s largest independent semiconductor foundries, TSM’s expertise in advanced process technologies, such as 3nm and 5nm nodes, has made it a critical supplier for major tech companies, such as NVIDIA Corporation (NVDA), Advanced Micro Devices, Inc. (AMD), and Apple Inc. (AAPL).

Recently, the stock has dipped by around 10% from its all-time highs, making many investors wonder whether this pullback offers a prime buying opportunity. Let’s assess whether long-term investors should capitalize on TSMC’s discounted price.

TSMC’s Technological Leadership

Taiwan-based TSMC’s role in advancing manufacturing chip technology has solidified its position as a critical player in the high-tech ecosystem, particularly in industries such as AI, 5G, automotive, and data centers. One of the company’s greatest strengths is its leadership in advanced node technology.

As a global chip leader, TSM provides the most advanced and comprehensive portfolio of dedicated foundry process technologies, including A16, 2nm, 3nm, 5nm, 7nm, and more. The company’s 3nm process is the industry’s leading semiconductor technology, providing the best power, performance, and area (PPA) and represents a full node advance from the 5nm generation.

TSMC continuously expands its 3nm technology portfolio to cater to diverse customer needs. Last year, the chip giant added new members to its industry-leading 3nm technology family, including the N3X process, designed specifically for high-performance computing (HPC) applications, and N3AE, facilitating an early start for automotive applications on the most advanced silicon technology.

Moreover, TSMC’s 2nm technology employing nanosheet transistors continues to make significant progress in terms of yield and device performance and is expected to commence production in 2025.

Earlier this year, at its 2024 North America Technology Symposium, TSMC introduced its latest semiconductor process, advanced packaging, and 3D IC technologies, showcasing its silicon leadership in driving the next generation of AI innovations.

With TSMC’s cutting-edge N3E technology now in production and N2 slated for production in the second half of 2025, the company unveiled A16, the next technology in its roadmap. A16, set for production in 2026, integrates TSMC’s Super Power Rail architecture with nanosheet transistors. It enhances logic density and performance by allocating front-side routing resources to signals, making it well-suited for HPC products.

Also, the chip company introduced its System-on-Wafer (TSMC-SoW™) technology, a groundbreaking solution designed to deliver exceptional performance to the wafer level in addressing the future AI needs of hyperscaler data centers.

TSMC Surpasses Second-Quarter Earnings Expectations Amid AI Chip Boom

TSMC’s revenue and earnings beat analyst expectations in the second quarter of 2024 as demand for advanced chips used in AI applications continues to surge. In the quarter that ended June 30, 2024, the company’s net revenue rose 40.1% year-over-year to $20.82 billion. That surpassed analysts’ revenue estimate of $20.09 billion.

CEO C.C. Wei, in an earnings call, said business during the quarter was supported by robust demand for its industry-leading 3nm and 5nm technologies. TSMC’s shipments of 3-nanometer accounted for 15% of total wafer revenue, 5-nanometer constituted 35%, and 7-nanometer made up 17%. Advanced technologies, defined as 7-nanometer and more advanced technologies, accounted for 67% of total wafer revenue.

TSMC’s non-GAAP income from operations rose 41.9% year-over-year to $8.86 billion. Its net income and earnings per ADR were $7.66 billion and $1.48, increases of 36.3% year-over-year, respectively. Its earnings per ADR compared to the consensus estimate of $1.42.

“Moving into third quarter 2024, we expect our business to be supported by strong smartphone and AI-related demand for our leading-edge process technologies,” said Wendell Huang, Chief Financial Officer of TSMC.

Based on the company’s current business outlook, TSMC’s management expects revenue between $22.40 billion and $23.20 billion for the third quarter of 2024. The company’s gross profit margin is projected to be between 53.5% and 55.5%, and its operating profit margin is anticipated to be between 42.5% and 44.5%.

Why TSMC’s Stock Dip May Be a Buying Opportunity

TSMC’s leadership in advanced chip manufacturing, coupled with the growing demand for advanced chips across AI, 5G, and high-performance computing sectors, positions the company for long-term growth. Management has projected third-quarter revenue to be $22.40-$23.20 billion, compared to $17.30 billion reported in the previous year’s quarter.

Meanwhile, analysts appear highly bullish about the company’s earnings growth. Street expects TSMC’s revenue and EPS for the current quarter (ending September 2024) to grow 38.8% and 37.9% year-over-year to $23.44 billion and $1.78, respectively.

For long-term investors, TSMC’s recent 10% decline may present an opportunity to buy into a company at the forefront of technological innovation. While short-term market fluctuations and geopolitical concerns may persist, the company’s technological leadership and strong growth outlook make it a compelling choice for those looking to benefit from the continued evolution of AI and semiconductor technology.

Bottom Line

TSMC’s recent stock dip presents a potential buying opportunity for long-term investors seeking exposure to a global leader in semiconductor innovation. With its industry-leading 3nm and 5nm process technologies, TSMC is well-positioned to capitalize on the growing demand for advanced chips, particularly in AI, 5G, and high-performance computing (HPC) industries.

While geopolitical risks and market volatility may pose challenges in the near term, TSMC’s strong earnings outlook and continuous innovation in semiconductor manufacturing suggest that this dip could be a strategic entry point.

By Ino.com – See our Trader Blog, INO TV Free & Market Analysis Alerts

Source: Taiwan Semiconductor’s 10% Dip: Is It Time to Buy?
https://www.ino.com/blog/2024/09/taiwan-semiconductors-10-dip-is-it-time-to-buy//?a_aid=CD3344&a_bid=e69e6702

Forex Speculators push Japanese Yen bets higher for record 10-week gain

By InvestMacro

Here are the latest charts and statistics for the Commitment of Traders (COT) data published by the Commodities Futures Trading Commission (CFTC).

The latest COT data is updated through Tuesday September 10th and shows a quick view of how large market participants (for-profit speculators and commercial traders) were positioned in the futures markets. All currency positions are in direct relation to the US dollar where, for example, a bet for the euro is a bet that the euro will rise versus the dollar while a bet against the euro will be a bet that the euro will decline versus the dollar.

Weekly Speculator Changes led by Brazilian Real & Japanese Yen

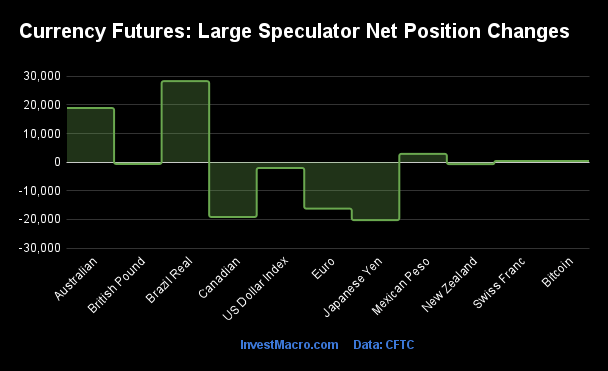
The COT currency market speculator bets were overall lower this week as four out of the eleven currency markets we cover had higher positioning while the other seven markets had lower speculator contracts.

Leading the gains for the currency markets was the Brazilian Real (20,447 contracts) with the Japanese Yen (14,654 contracts), the US Dollar Index (781 contracts) and the Swiss Franc (578 contracts) also showing positive weeks.

The currencies seeing declines in speculator bets on the week were the EuroFX (-18,585 contracts), the British Pound (-17,790 contracts), the Australian Dollar (-6,178 contracts), the Mexican Peso (-3,453 contracts), the New Zealand Dollar (-3,077 contracts), Bitcoin (-461 contracts) and with the Canadian Dollar (-409 contracts) also registering lower bets on the week.

Forex Speculators push Japanese Yen bets higher for record 10-week gain

Highlighting the COT currency’s data this week is the boost in bullish bets for the Japanese yen speculators. Japanese yen bets have continued their remarkable turnaround over the past couple of months with this week marking a tenth consecutive weekly gain.

This week’s increase in the speculator positioning was the second straight weekly rise by over +14,000 contracts and brings the total increase in speculator bets over the past ten weeks to a total of +239,993 contracts — the highest 10-week cumulative change on record. The yen speculator standing has now gone from a total of -184,223 contracts on July 2nd to a total standing this week at +55,770 contracts. This week’s standing also marks the most bullish level since October 4th of 2016.

The yen sentiment has been boosted by the Bank of Japan (BOJ) who is changing their interest rate policy from negative rates previously to a cautious increase of rates beginning with their recent July hike. According to Reuters, analysts are expecting the BOJ to increase their rates again by the end of the year.

The yen exchange rate versus the US dollar has benefited from a change in BOJ policy and has improved by approximately 15 percent from the low-point reached in July, according to this week’s closing prices. The yen rose this week by over 1 percent for a second consecutive weekly gain.


Currencies Net Speculators Leaderboard

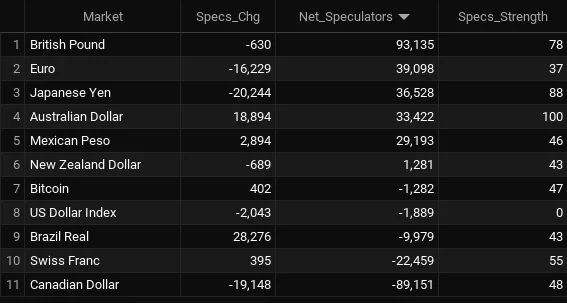
Legend: Weekly Speculators Change | Speculators Current Net Position | Speculators Strength Score compared to last 3-Years (0-100 range)


Strength Scores led by Japanese Yen & Australian Dollar

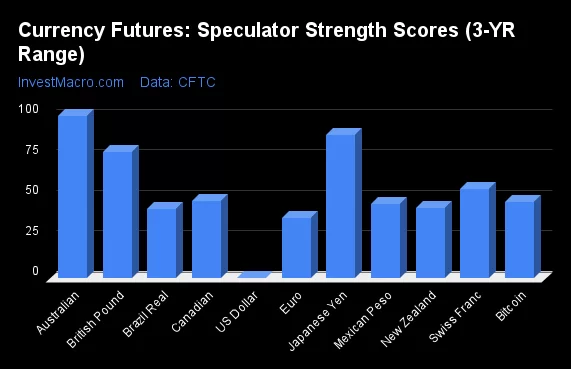
COT Strength Scores (a normalized measure of Speculator positions over a 3-Year range, from 0 to 100 where above 80 is Extreme-Bullish and below 20 is Extreme-Bearish) showed that the Japanese Yen (100 percent) and the Australian Dollar (79 percent) lead the currency markets this week. The British Pound (77 percent), Bitcoin (61 percent) and the Swiss Franc (58 percent) come in as the next highest in the weekly strength scores.

On the downside, the Brazilian Real (23 percent) and the New Zealand Dollar (35 percent) come in at the lowest strength levels currently. The next lowest strength score is the Mexican Peso (45 percent).

Strength Statistics:
US Dollar Index (47.1 percent) vs US Dollar Index previous week (45.5 percent)
EuroFX (55.0 percent) vs EuroFX previous week (62.9 percent)
British Pound Sterling (76.7 percent) vs British Pound Sterling previous week (84.7 percent)
Japanese Yen (100.0 percent) vs Japanese Yen previous week (93.9 percent)
Swiss Franc (57.7 percent) vs Swiss Franc previous week (56.5 percent)
Canadian Dollar (57.1 percent) vs Canadian Dollar previous week (57.2 percent)
Australian Dollar (78.8 percent) vs Australian Dollar previous week (84.0 percent)
New Zealand Dollar (34.5 percent) vs New Zealand Dollar previous week (40.4 percent)
Mexican Peso (44.7 percent) vs Mexican Peso previous week (46.4 percent)
Brazilian Real (23.3 percent) vs Brazilian Real previous week (3.9 percent)
Bitcoin (61.1 percent) vs Bitcoin previous week (68.0 percent)


Canadian Dollar & Japanese Yen top the 6-Week Strength Trends

COT Strength Score Trends (or move index, calculates the 6-week changes in strength scores) showed that the Canadian Dollar (57 percent) and the Japanese Yen (54 percent) lead the past six weeks trends for the currencies. The EuroFX (27 percent), the Swiss Franc (27 percent) and the New Zealand Dollar (16 percent) are the next highest positive movers in the latest trends data.

The Mexican Peso (-20 percent) leads the downside trend scores currently with the British Pound (-10 percent) following next with lower trend scores.

Strength Trend Statistics:
US Dollar Index (6.9 percent) vs US Dollar Index previous week (2.6 percent)
EuroFX (27.1 percent) vs EuroFX previous week (27.3 percent)
British Pound Sterling (-9.5 percent) vs British Pound Sterling previous week (-15.3 percent)
Japanese Yen (53.8 percent) vs Japanese Yen previous week (61.8 percent)
Swiss Franc (26.8 percent) vs Swiss Franc previous week (41.2 percent)
Canadian Dollar (57.1 percent) vs Canadian Dollar previous week (41.7 percent)
Australian Dollar (14.6 percent) vs Australian Dollar previous week (0.8 percent)
New Zealand Dollar (15.6 percent) vs New Zealand Dollar previous week (-9.1 percent)
Mexican Peso (-19.9 percent) vs Mexican Peso previous week (-19.1 percent)
Brazilian Real (10.2 percent) vs Brazilian Real previous week (-8.4 percent)
Bitcoin (9.8 percent) vs Bitcoin previous week (11.6 percent)


Individual COT Forex Markets:

US Dollar Index Futures:

US Dollar Index Forex Futures COT Chart
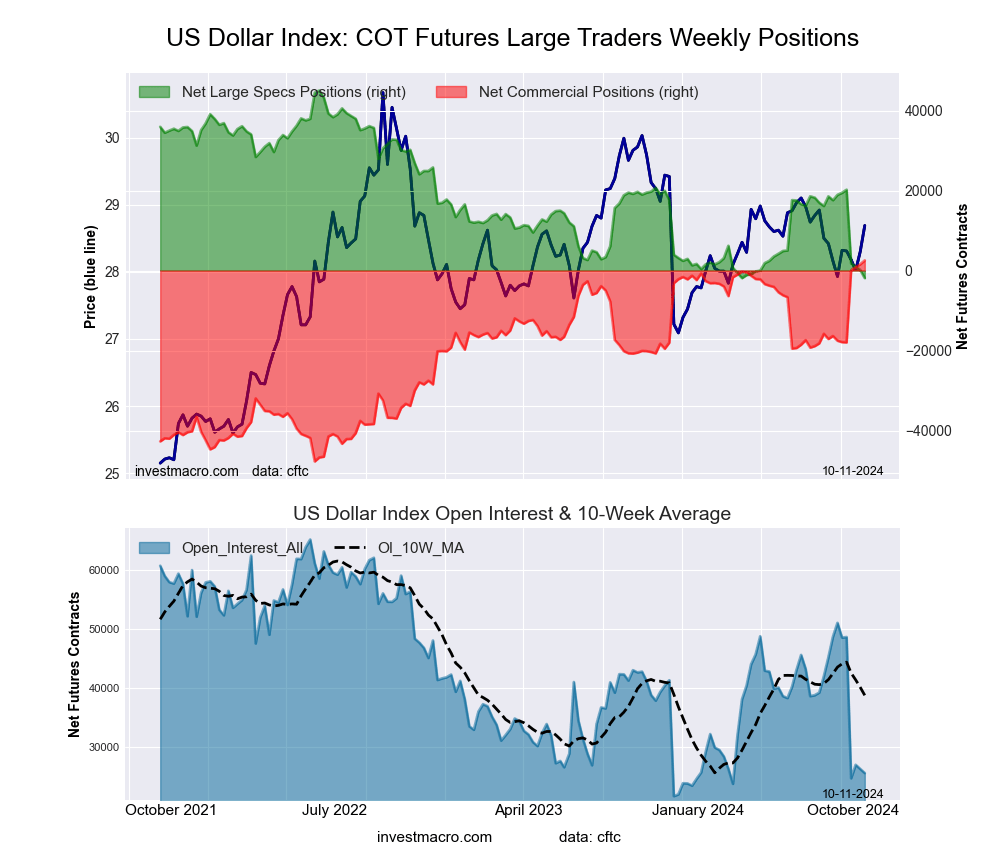
The US Dollar Index large speculator standing this week came in at a net position of 20,210 contracts in the data reported through Tuesday. This was a weekly advance of 781 contracts from the previous week which had a total of 19,429 net contracts.

This week’s current strength score (the trader positioning range over the past three years, measured from 0 to 100) shows the speculators are currently Bearish with a score of 47.1 percent. The commercials are Bullish with a score of 62.7 percent and the small traders (not shown in chart) are Bearish-Extreme with a score of 0.0 percent.

Price Trend-Following Model: Strong Downtrend

Our weekly trend-following model classifies the current market price position as: Strong Downtrend. The current action for the model is considered to be: Hold – Maintain Short Position.

US DOLLAR INDEX StatisticsSPECULATORSCOMMERCIALSSMALL TRADERS
– Percent of Open Interest Longs:66.024.63.9
– Percent of Open Interest Shorts:24.561.58.5
– Net Position:20,210-17,979-2,231
– Gross Longs:32,11611,9491,916
– Gross Shorts:11,90629,9284,147
– Long to Short Ratio:2.7 to 10.4 to 10.5 to 1
NET POSITION TREND:
– Strength Index Score (3 Year Range Pct):47.162.70.0
– Strength Index Reading (3 Year Range):BearishBullishBearish-Extreme
NET POSITION MOVEMENT INDEX:
– 6-Week Change in Strength Index:6.90.5-35.3


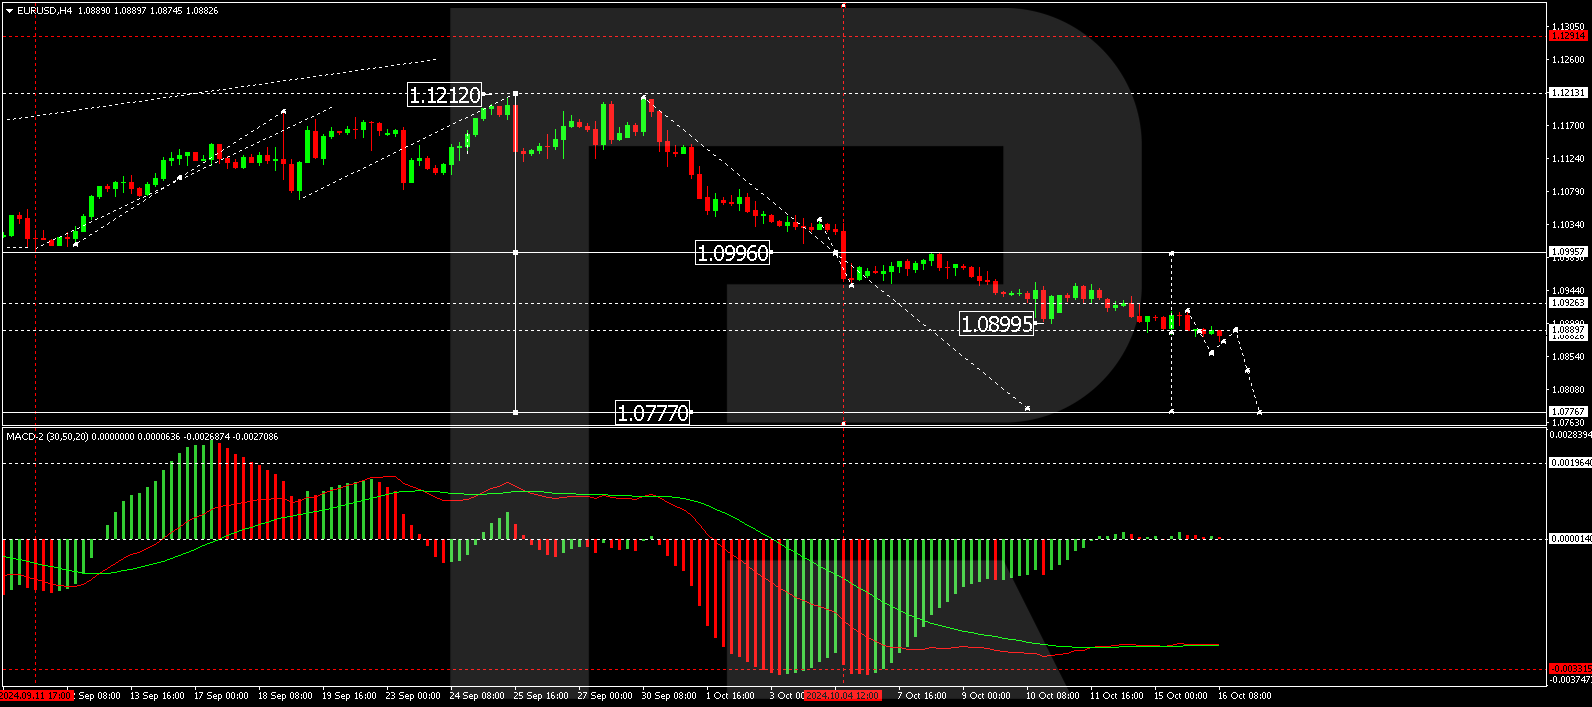
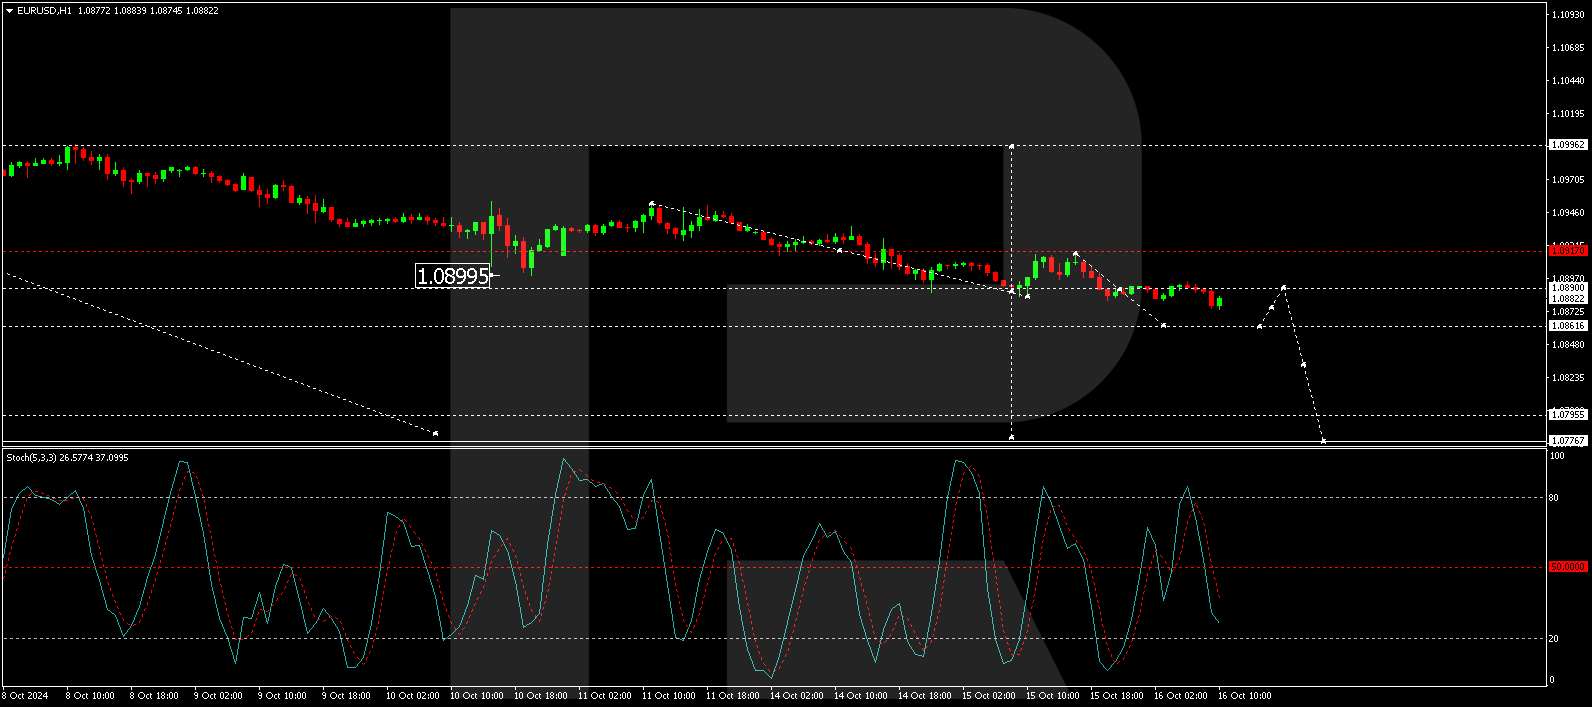
Euro Currency Futures:

Euro Currency Futures COT Chart
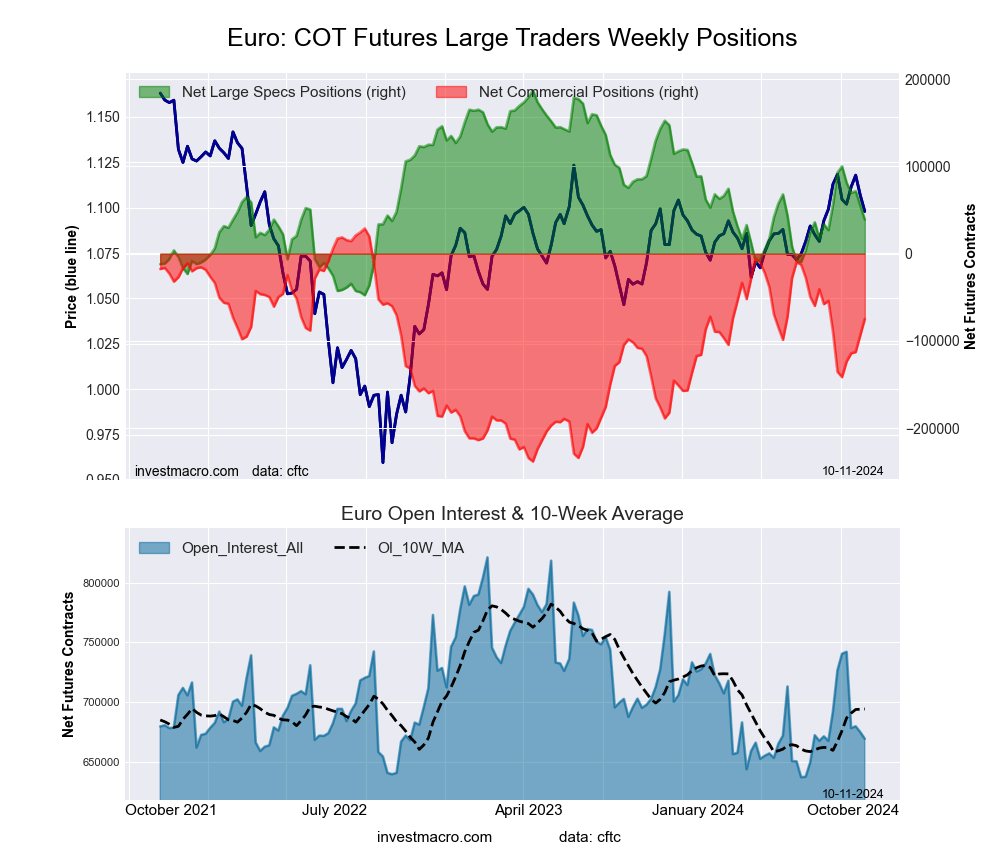
The Euro Currency large speculator standing this week came in at a net position of 81,433 contracts in the data reported through Tuesday. This was a weekly decrease of -18,585 contracts from the previous week which had a total of 100,018 net contracts.

This week’s current strength score (the trader positioning range over the past three years, measured from 0 to 100) shows the speculators are currently Bullish with a score of 55.0 percent. The commercials are Bearish with a score of 42.9 percent and the small traders (not shown in chart) are Bullish with a score of 66.6 percent.

Price Trend-Following Model: Uptrend

Our weekly trend-following model classifies the current market price position as: Uptrend. The current action for the model is considered to be: Hold – Maintain Long Position.

EURO Currency StatisticsSPECULATORSCOMMERCIALSSMALL TRADERS
– Percent of Open Interest Longs:26.055.412.5
– Percent of Open Interest Shorts:15.072.16.8
– Net Position:81,433-123,80742,374
– Gross Longs:192,821411,08292,555
– Gross Shorts:111,388534,88950,181
– Long to Short Ratio:1.7 to 10.8 to 11.8 to 1
NET POSITION TREND:
– Strength Index Score (3 Year Range Pct):55.042.966.6
– Strength Index Reading (3 Year Range):BullishBearishBullish
NET POSITION MOVEMENT INDEX:
– 6-Week Change in Strength Index:27.1-31.144.1


British Pound Sterling Futures:

British Pound Sterling Futures COT Chart
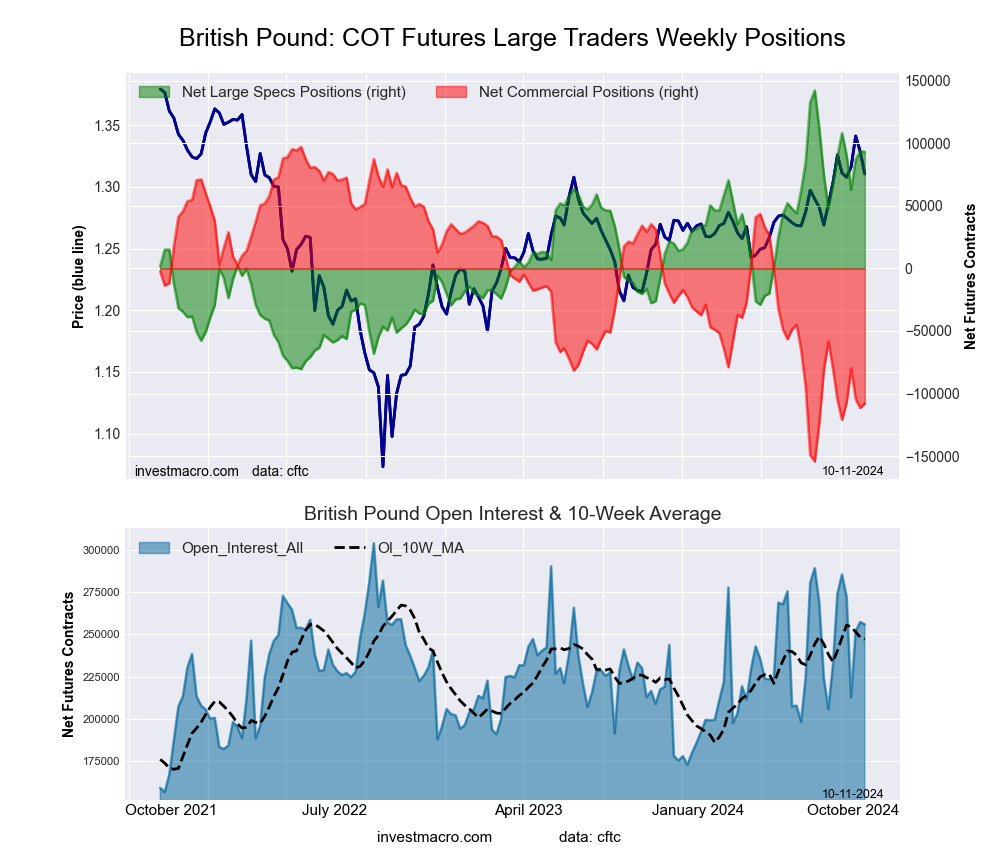
The British Pound Sterling large speculator standing this week came in at a net position of 90,288 contracts in the data reported through Tuesday. This was a weekly decrease of -17,790 contracts from the previous week which had a total of 108,078 net contracts.

This week’s current strength score (the trader positioning range over the past three years, measured from 0 to 100) shows the speculators are currently Bullish with a score of 76.7 percent. The commercials are Bearish-Extreme with a score of 18.7 percent and the small traders (not shown in chart) are Bullish-Extreme with a score of 97.9 percent.

Price Trend-Following Model: Strong Uptrend

Our weekly trend-following model classifies the current market price position as: Strong Uptrend. The current action for the model is considered to be: Hold – Maintain Long Position.

BRITISH POUND StatisticsSPECULATORSCOMMERCIALSSMALL TRADERS
– Percent of Open Interest Longs:52.225.715.5
– Percent of Open Interest Shorts:19.065.19.3
– Net Position:90,288-107,27816,990
– Gross Longs:142,07269,94442,246
– Gross Shorts:51,784177,22225,256
– Long to Short Ratio:2.7 to 10.4 to 11.7 to 1
NET POSITION TREND:
– Strength Index Score (3 Year Range Pct):76.718.797.9
– Strength Index Reading (3 Year Range):BullishBearish-ExtremeBullish-Extreme
NET POSITION MOVEMENT INDEX:
– 6-Week Change in Strength Index:-9.56.311.1


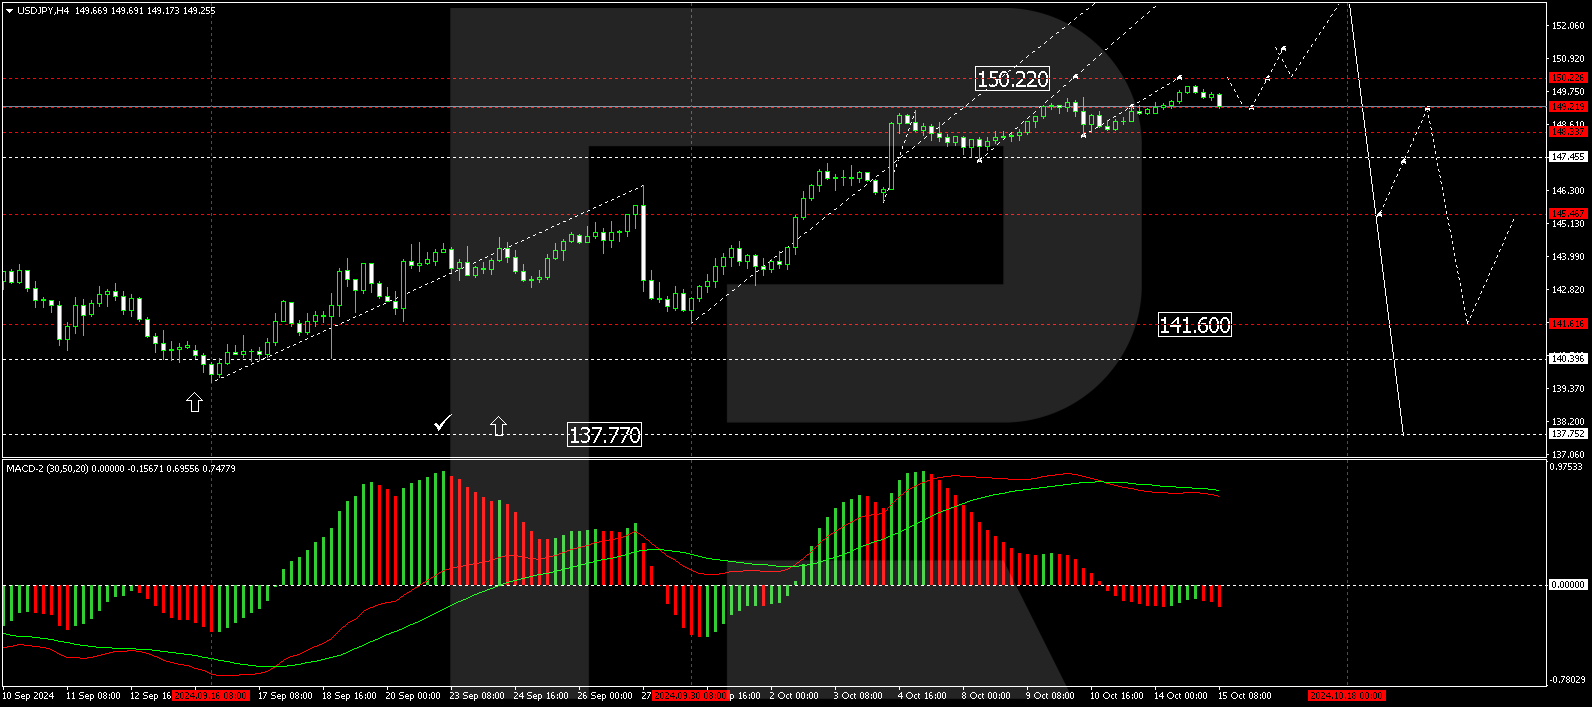
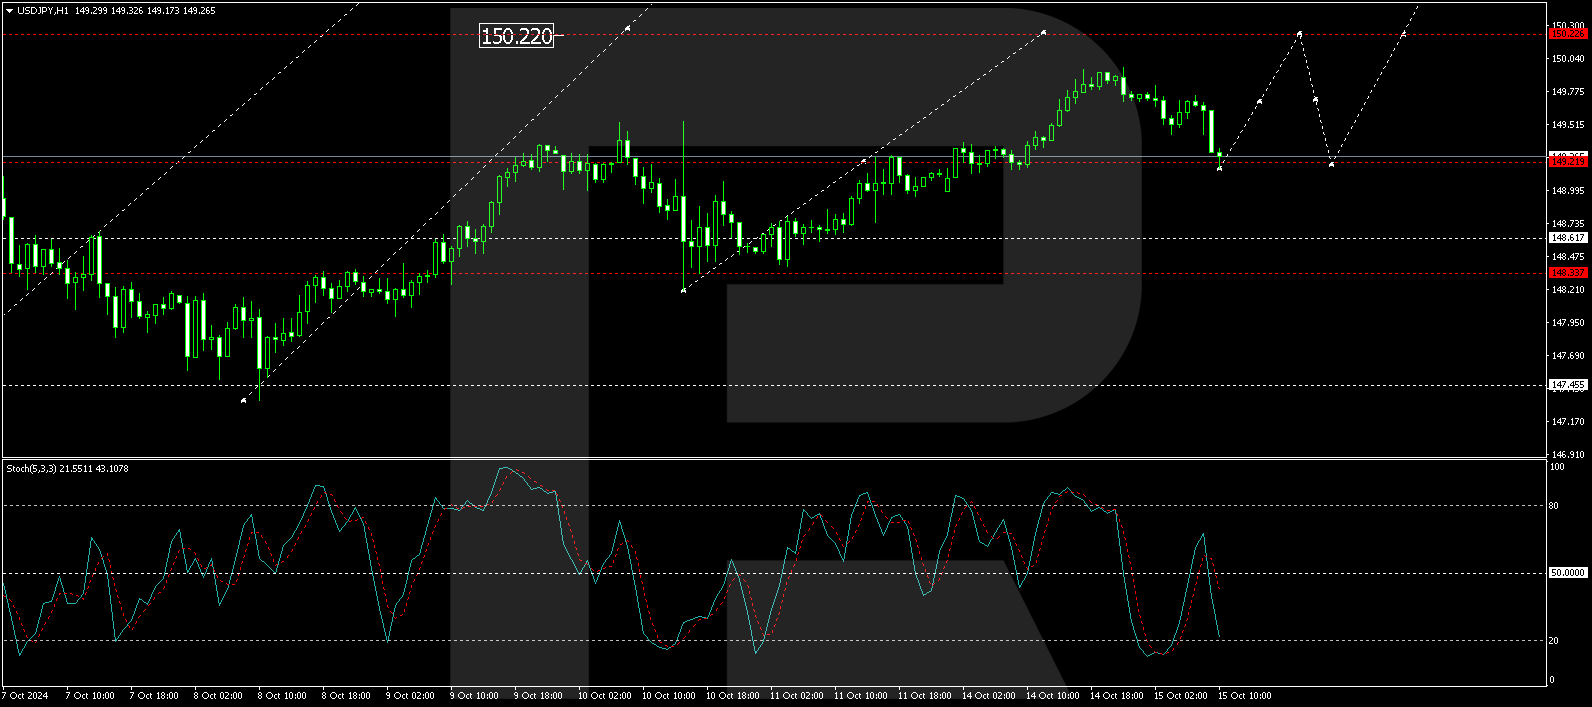
Japanese Yen Futures:

Japanese Yen Forex Futures COT Chart
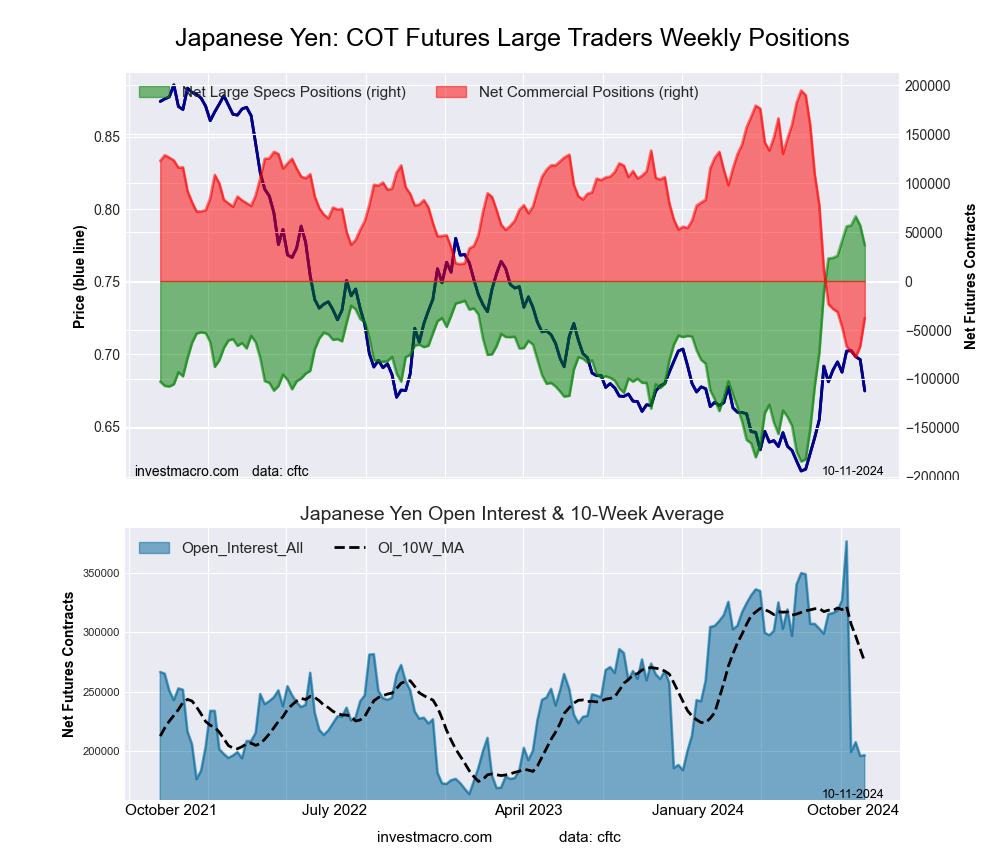
The Japanese Yen large speculator standing this week came in at a net position of 55,770 contracts in the data reported through Tuesday. This was a weekly gain of 14,654 contracts from the previous week which had a total of 41,116 net contracts.

This week’s current strength score (the trader positioning range over the past three years, measured from 0 to 100) shows the speculators are currently Bullish-Extreme with a score of 100.0 percent. The commercials are Bearish-Extreme with a score of 0.0 percent and the small traders (not shown in chart) are Bullish-Extreme with a score of 100.0 percent.

Price Trend-Following Model: Strong Uptrend

Our weekly trend-following model classifies the current market price position as: Strong Uptrend. The current action for the model is considered to be: Hold – Maintain Long Position.

JAPANESE YEN StatisticsSPECULATORSCOMMERCIALSSMALL TRADERS
– Percent of Open Interest Longs:26.359.411.3
– Percent of Open Interest Shorts:11.577.18.4
– Net Position:55,770-66,71910,949
– Gross Longs:98,894223,69842,728
– Gross Shorts:43,124290,41731,779
– Long to Short Ratio:2.3 to 10.8 to 11.3 to 1
NET POSITION TREND:
– Strength Index Score (3 Year Range Pct):100.00.0100.0
– Strength Index Reading (3 Year Range):Bullish-ExtremeBearish-ExtremeBullish-Extreme
NET POSITION MOVEMENT INDEX:
– 6-Week Change in Strength Index:53.8-55.240.4


Swiss Franc Futures:

Swiss Franc Forex Futures COT Chart
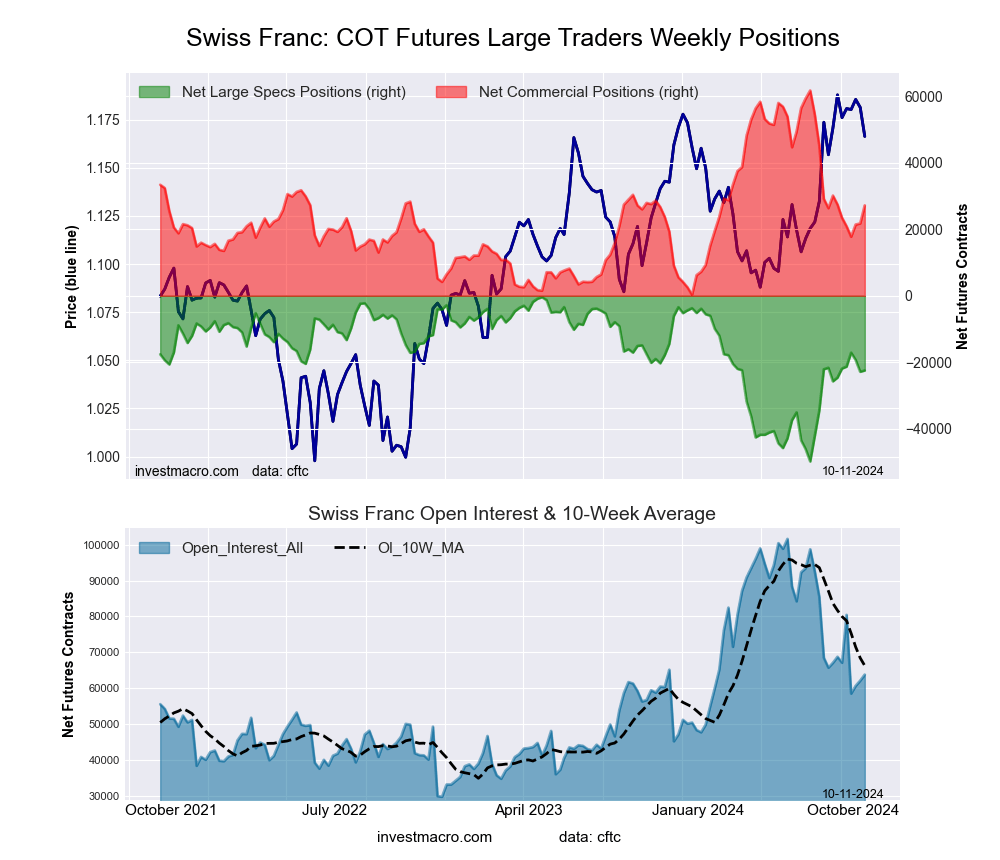
The Swiss Franc large speculator standing this week came in at a net position of -21,304 contracts in the data reported through Tuesday. This was a weekly advance of 578 contracts from the previous week which had a total of -21,882 net contracts.

This week’s current strength score (the trader positioning range over the past three years, measured from 0 to 100) shows the speculators are currently Bullish with a score of 57.7 percent. The commercials are Bearish with a score of 33.6 percent and the small traders (not shown in chart) are Bullish with a score of 79.1 percent.

Price Trend-Following Model: Strong Uptrend

Our weekly trend-following model classifies the current market price position as: Strong Uptrend. The current action for the model is considered to be: Hold – Maintain Long Position.

SWISS FRANC StatisticsSPECULATORSCOMMERCIALSSMALL TRADERS
– Percent of Open Interest Longs:10.066.719.5
– Percent of Open Interest Shorts:36.540.719.0
– Net Position:-21,30420,885419
– Gross Longs:8,08253,64215,706
– Gross Shorts:29,38632,75715,287
– Long to Short Ratio:0.3 to 11.6 to 11.0 to 1
NET POSITION TREND:
– Strength Index Score (3 Year Range Pct):57.733.679.1
– Strength Index Reading (3 Year Range):BullishBearishBullish
NET POSITION MOVEMENT INDEX:
– 6-Week Change in Strength Index:26.8-39.550.2


Canadian Dollar Futures:

Canadian Dollar Forex Futures COT Chart
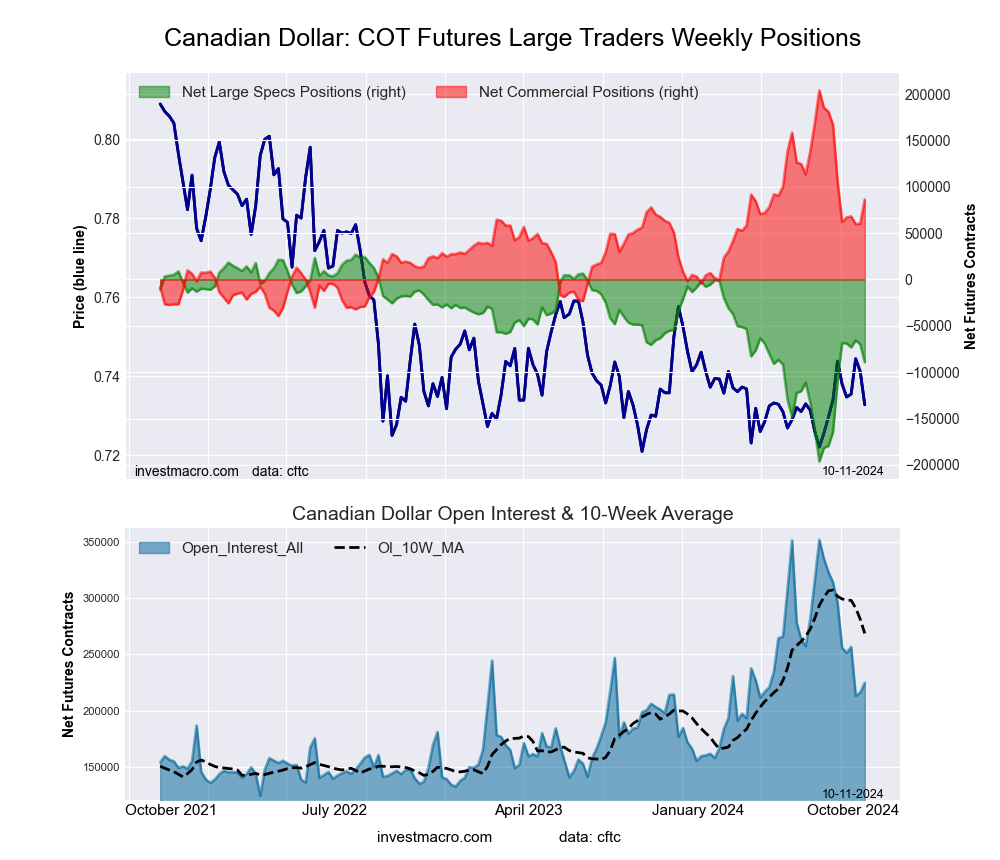
The Canadian Dollar large speculator standing this week came in at a net position of -68,953 contracts in the data reported through Tuesday. This was a weekly decline of -409 contracts from the previous week which had a total of -68,544 net contracts.

This week’s current strength score (the trader positioning range over the past three years, measured from 0 to 100) shows the speculators are currently Bullish with a score of 57.1 percent. The commercials are Bearish with a score of 43.7 percent and the small traders (not shown in chart) are Bearish with a score of 36.8 percent.

Price Trend-Following Model: Strong Uptrend

Our weekly trend-following model classifies the current market price position as: Strong Uptrend. The current action for the model is considered to be: Hold – Maintain Long Position.

CANADIAN DOLLAR StatisticsSPECULATORSCOMMERCIALSSMALL TRADERS
– Percent of Open Interest Longs:9.570.412.3
– Percent of Open Interest Shorts:36.943.711.5
– Net Position:-68,95366,9182,035
– Gross Longs:23,773176,81430,986
– Gross Shorts:92,726109,89628,951
– Long to Short Ratio:0.3 to 11.6 to 11.1 to 1
NET POSITION TREND:
– Strength Index Score (3 Year Range Pct):57.143.736.8
– Strength Index Reading (3 Year Range):BullishBearishBearish
NET POSITION MOVEMENT INDEX:
– 6-Week Change in Strength Index:57.1-56.328.2


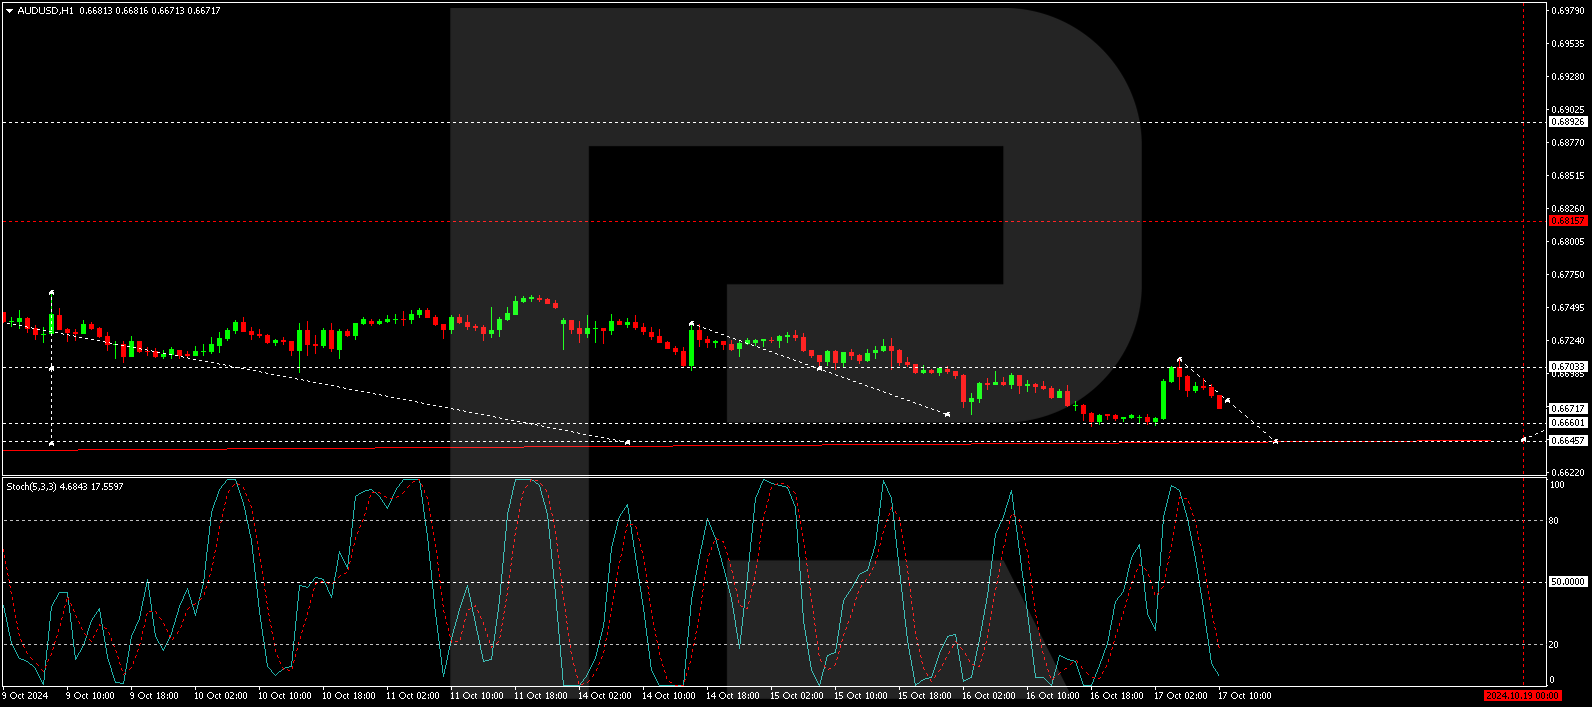
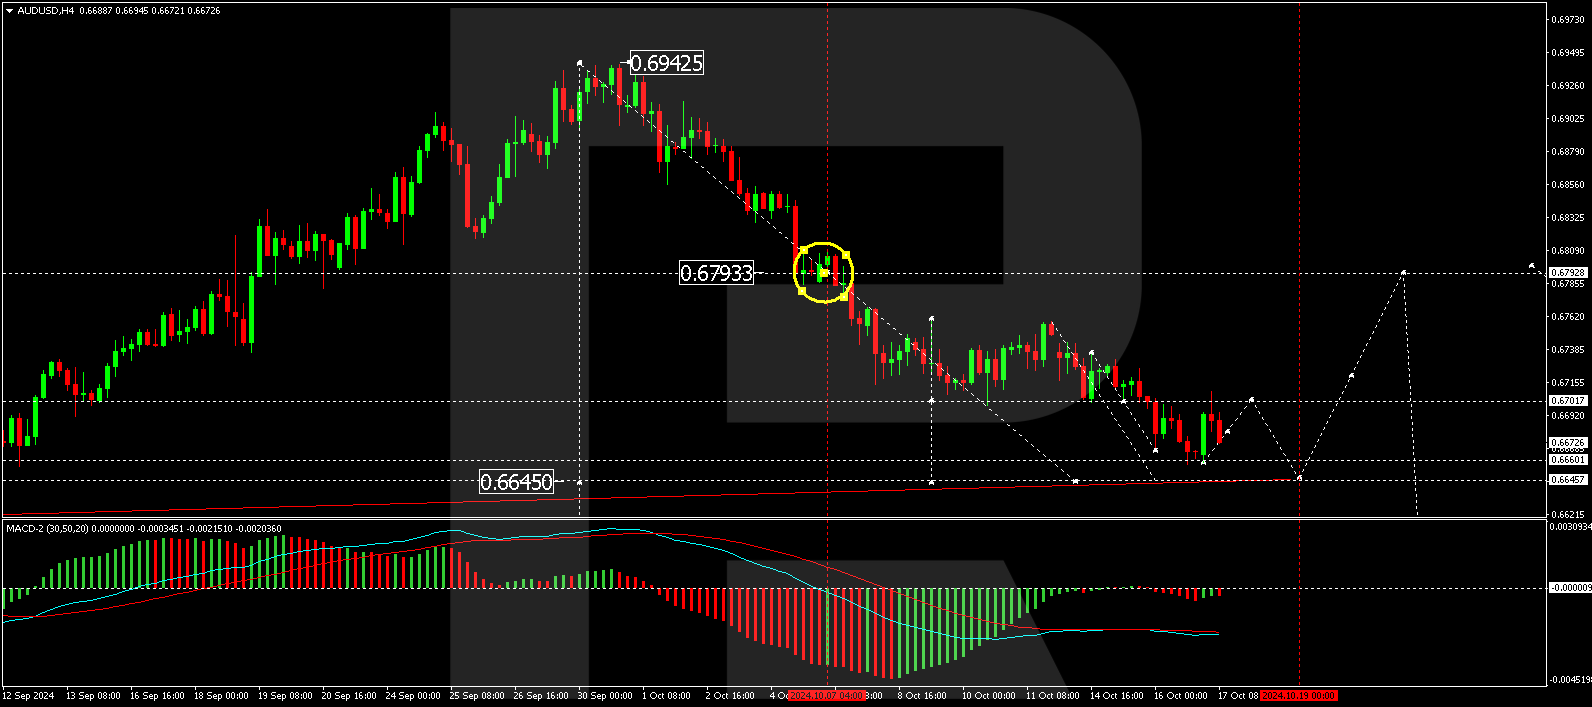
Australian Dollar Futures:

Australian Dollar Forex Futures COT Chart
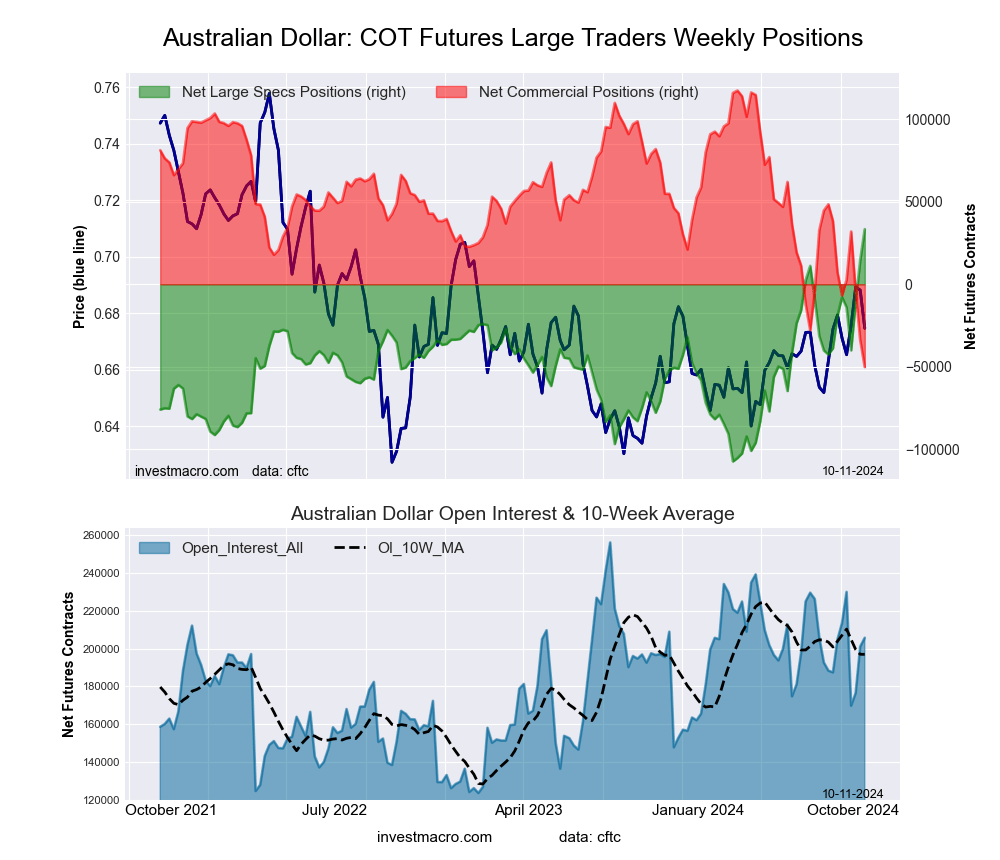
The Australian Dollar large speculator standing this week came in at a net position of -14,042 contracts in the data reported through Tuesday. This was a weekly fall of -6,178 contracts from the previous week which had a total of -7,864 net contracts.

This week’s current strength score (the trader positioning range over the past three years, measured from 0 to 100) shows the speculators are currently Bullish with a score of 78.8 percent. The commercials are Bearish with a score of 21.0 percent and the small traders (not shown in chart) are Bullish-Extreme with a score of 85.3 percent.

Price Trend-Following Model: Uptrend

Our weekly trend-following model classifies the current market price position as: Uptrend. The current action for the model is considered to be: Hold – Maintain Long Position.

AUSTRALIAN DOLLAR StatisticsSPECULATORSCOMMERCIALSSMALL TRADERS
– Percent of Open Interest Longs:32.349.713.1
– Percent of Open Interest Shorts:38.448.68.1
– Net Position:-14,0422,62011,422
– Gross Longs:74,259114,42630,094
– Gross Shorts:88,301111,80618,672
– Long to Short Ratio:0.8 to 11.0 to 11.6 to 1
NET POSITION TREND:
– Strength Index Score (3 Year Range Pct):78.821.085.3
– Strength Index Reading (3 Year Range):BullishBearishBullish-Extreme
NET POSITION MOVEMENT INDEX:
– 6-Week Change in Strength Index:14.6-20.835.5


New Zealand Dollar Futures:

New Zealand Dollar Forex Futures COT Chart
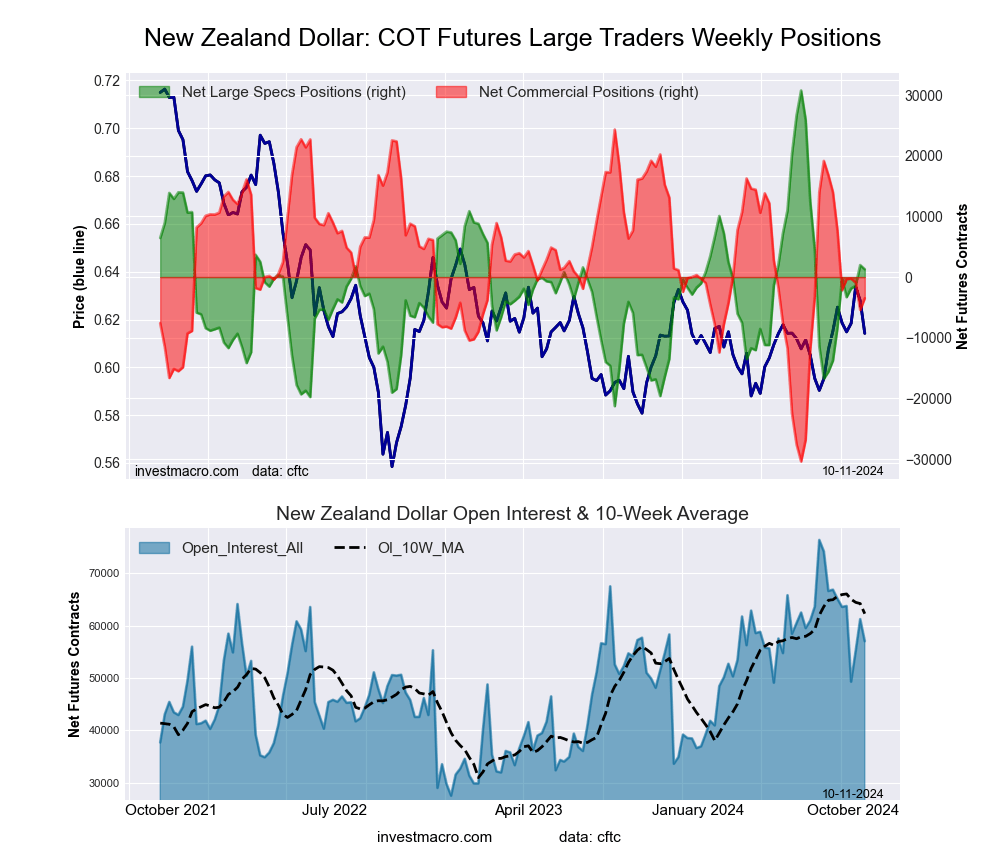
The New Zealand Dollar large speculator standing this week came in at a net position of -3,315 contracts in the data reported through Tuesday. This was a weekly fall of -3,077 contracts from the previous week which had a total of -238 net contracts.

This week’s current strength score (the trader positioning range over the past three years, measured from 0 to 100) shows the speculators are currently Bearish with a score of 34.5 percent. The commercials are Bullish with a score of 54.9 percent and the small traders (not shown in chart) are Bullish-Extreme with a score of 100.0 percent.

Price Trend-Following Model: Uptrend

Our weekly trend-following model classifies the current market price position as: Uptrend. The current action for the model is considered to be: Hold – Maintain Long Position.

NEW ZEALAND DOLLAR StatisticsSPECULATORSCOMMERCIALSSMALL TRADERS
– Percent of Open Interest Longs:33.649.510.9
– Percent of Open Interest Shorts:38.850.05.1
– Net Position:-3,315-3473,662
– Gross Longs:21,39431,5116,929
– Gross Shorts:24,70931,8583,267
– Long to Short Ratio:0.9 to 11.0 to 12.1 to 1
NET POSITION TREND:
– Strength Index Score (3 Year Range Pct):34.554.9100.0
– Strength Index Reading (3 Year Range):BearishBullishBullish-Extreme
NET POSITION MOVEMENT INDEX:
– 6-Week Change in Strength Index:15.6-26.279.1


Mexican Peso Futures:

Mexican Peso Futures COT Chart
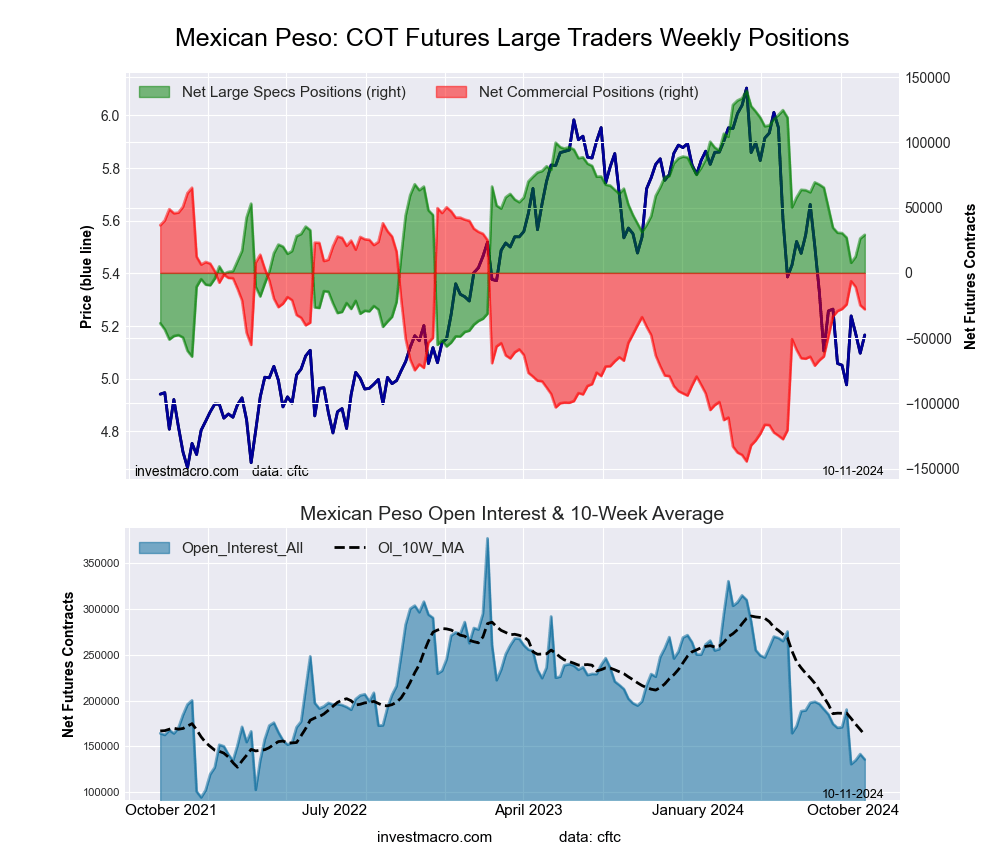
The Mexican Peso large speculator standing this week came in at a net position of 27,026 contracts in the data reported through Tuesday. This was a weekly fall of -3,453 contracts from the previous week which had a total of 30,479 net contracts.

This week’s current strength score (the trader positioning range over the past three years, measured from 0 to 100) shows the speculators are currently Bearish with a score of 44.7 percent. The commercials are Bullish with a score of 57.3 percent and the small traders (not shown in chart) are Bearish-Extreme with a score of 0.0 percent.

Price Trend-Following Model: Downtrend

Our weekly trend-following model classifies the current market price position as: Downtrend. The current action for the model is considered to be: Hold – Maintain Short Position.

MEXICAN PESO StatisticsSPECULATORSCOMMERCIALSSMALL TRADERS
– Percent of Open Interest Longs:32.958.22.0
– Percent of Open Interest Shorts:18.770.93.5
– Net Position:27,026-24,212-2,814
– Gross Longs:62,614110,6663,879
– Gross Shorts:35,588134,8786,693
– Long to Short Ratio:1.8 to 10.8 to 10.6 to 1
NET POSITION TREND:
– Strength Index Score (3 Year Range Pct):44.757.30.0
– Strength Index Reading (3 Year Range):BearishBullishBearish-Extreme
NET POSITION MOVEMENT INDEX:
– 6-Week Change in Strength Index:-19.920.4-13.2


Brazilian Real Futures:

Brazil Real Futures COT Chart
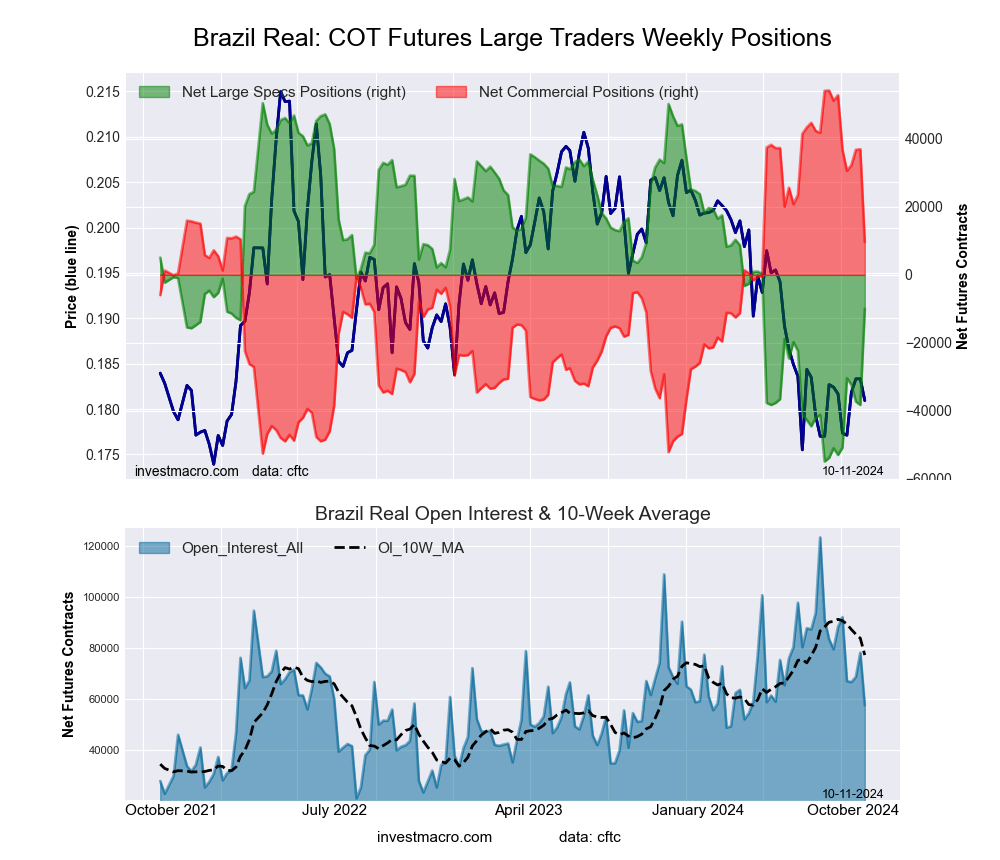
The Brazilian Real large speculator standing this week came in at a net position of -30,364 contracts in the data reported through Tuesday. This was a weekly rise of 20,447 contracts from the previous week which had a total of -50,811 net contracts.

This week’s current strength score (the trader positioning range over the past three years, measured from 0 to 100) shows the speculators are currently Bearish with a score of 23.3 percent. The commercials are Bullish with a score of 77.9 percent and the small traders (not shown in chart) are Bearish-Extreme with a score of 19.5 percent.

Price Trend-Following Model: Downtrend

Our weekly trend-following model classifies the current market price position as: Downtrend. The current action for the model is considered to be: Hold – Maintain Short Position.

BRAZIL REAL StatisticsSPECULATORSCOMMERCIALSSMALL TRADERS
– Percent of Open Interest Longs:27.068.63.9
– Percent of Open Interest Shorts:72.323.04.3
– Net Position:-30,36430,599-235
– Gross Longs:18,11546,0112,631
– Gross Shorts:48,47915,4122,866
– Long to Short Ratio:0.4 to 13.0 to 10.9 to 1
NET POSITION TREND:
– Strength Index Score (3 Year Range Pct):23.377.919.5
– Strength Index Reading (3 Year Range):BearishBullishBearish-Extreme
NET POSITION MOVEMENT INDEX:
– 6-Week Change in Strength Index:10.2-10.52.2


Bitcoin Futures:

Bitcoin Crypto Futures COT Chart
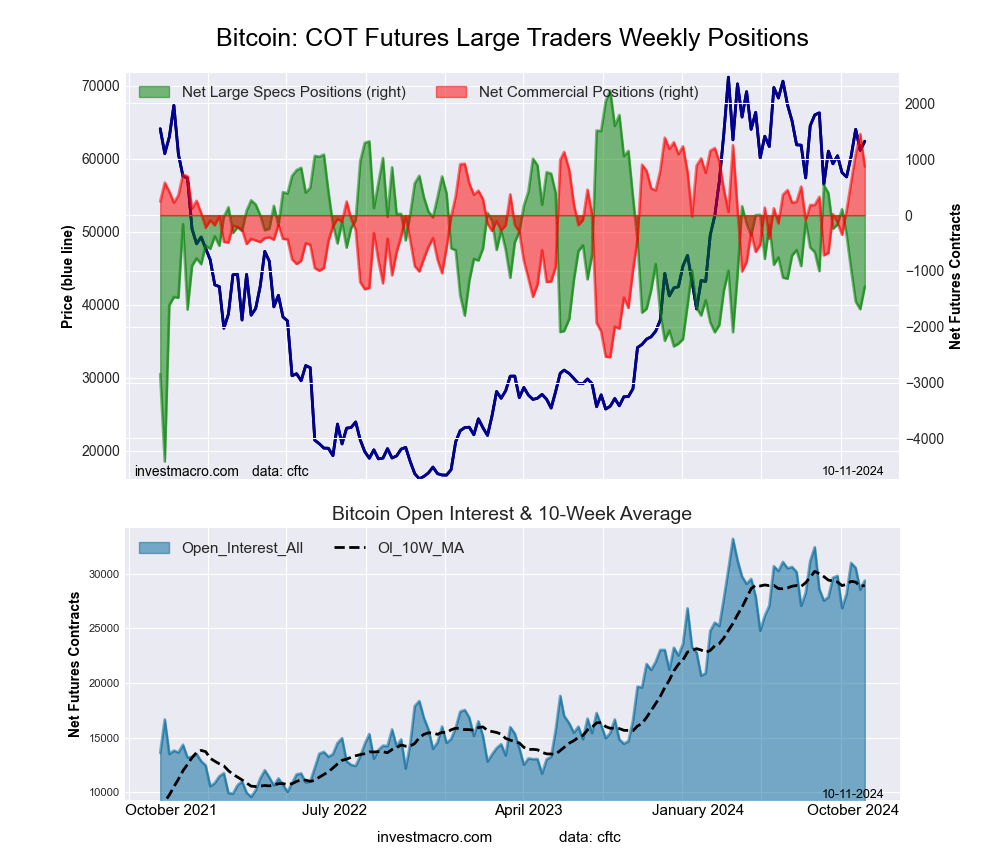
The Bitcoin large speculator standing this week came in at a net position of -353 contracts in the data reported through Tuesday. This was a weekly decline of -461 contracts from the previous week which had a total of 108 net contracts.

This week’s current strength score (the trader positioning range over the past three years, measured from 0 to 100) shows the speculators are currently Bullish with a score of 61.1 percent. The commercials are Bullish with a score of 66.9 percent and the small traders (not shown in chart) are Bearish-Extreme with a score of 19.0 percent.

Price Trend-Following Model: Downtrend

Our weekly trend-following model classifies the current market price position as: Downtrend. The current action for the model is considered to be: Hold – Maintain Short Position.

BITCOIN StatisticsSPECULATORSCOMMERCIALSSMALL TRADERS
– Percent of Open Interest Longs:81.63.94.4
– Percent of Open Interest Shorts:82.83.63.4
– Net Position:-35385268
– Gross Longs:22,9691,0971,225
– Gross Shorts:23,3221,012957
– Long to Short Ratio:1.0 to 11.1 to 11.3 to 1
NET POSITION TREND:
– Strength Index Score (3 Year Range Pct):61.166.919.0
– Strength Index Reading (3 Year Range):BullishBullishBearish-Extreme
NET POSITION MOVEMENT INDEX:
– 6-Week Change in Strength Index:9.8-6.2-9.3


Article By InvestMacroReceive our weekly COT Newsletter

*COT Report: The COT data, released weekly to the public each Friday, is updated through the most recent Tuesday (data is 3 days old) and shows a quick view of how large speculators or non-commercials (for-profit traders) were positioned in the futures markets.

The CFTC categorizes trader positions according to commercial hedgers (traders who use futures contracts for hedging as part of the business), non-commercials (large traders who speculate to realize trading profits) and nonreportable traders (usually small traders/speculators) as well as their open interest (contracts open in the market at time of reporting). See CFTC criteria here.