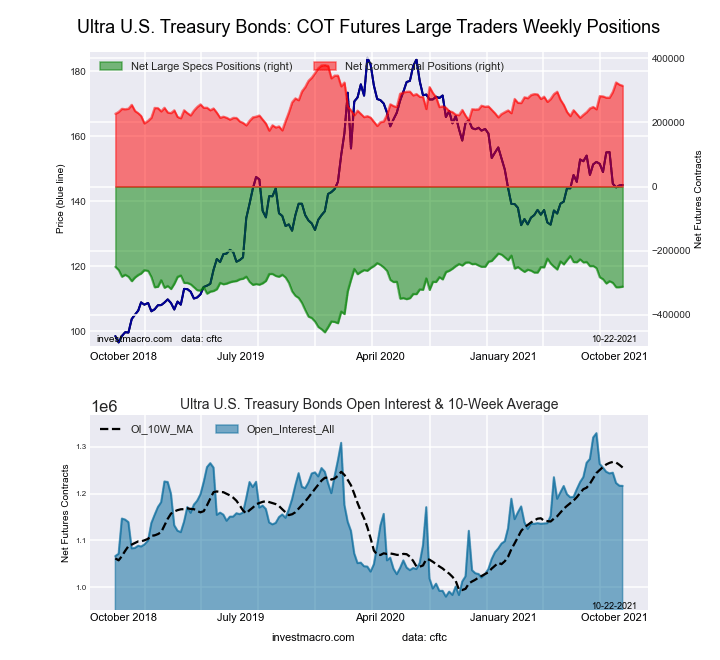
Archive for CountingPips Forex Blog – Page 24

COT Stock Market Charts: VIX Volatility, Nasdaq-Mini Futures, SP500, & Russell-2000

By InvestMacro.com COT Home | Data Tables | Data Downloads | Newsletter

Here are the latest charts and statistics for the Commitment of Traders (COT) data published by the Commodities Futures Trading Commission (CFTC).

The latest COT data is updated through Tuesday October 26th 2021 and shows a quick view of how large traders (for-profit speculators and commercial entities) were positioned in the futures markets.


Data Snapshot of Stock Market Traders | Columns Legend
Oct-26-2021OIOI-IndexSpec-NetSpec-IndexCom-NetCOM-IndexSmalls-NetSmalls-Index
S&P500-Mini2,404,805196,48876-126,5384330,05033
Nikkei 22517,64910-26257-1,956462,21855
Nasdaq-Mini245,51040-3,255736,41330-3,15837
DowJones-Mini109,296831,73738-5,178563,44157
VIX337,25238-101,59644109,53057-7,93426
Nikkei 225 Yen49,618282,1772821,31585-23,49233


VIX Volatility Futures:

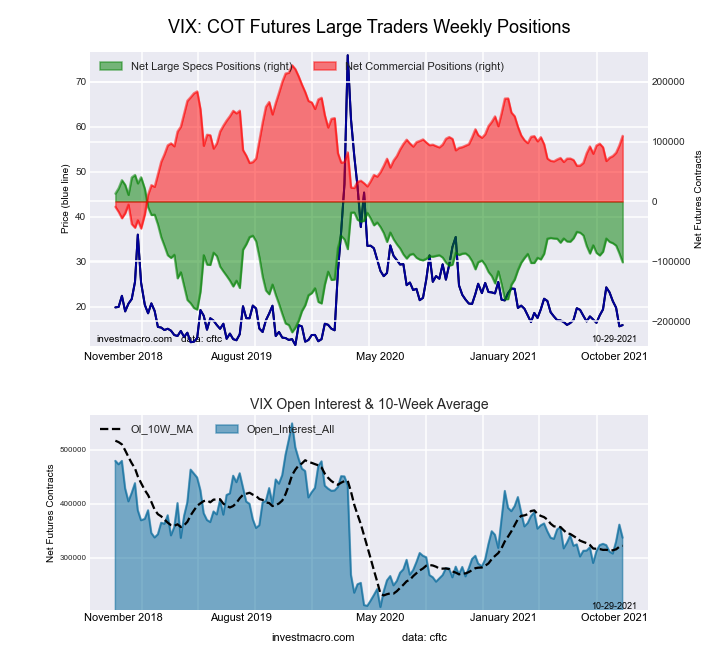
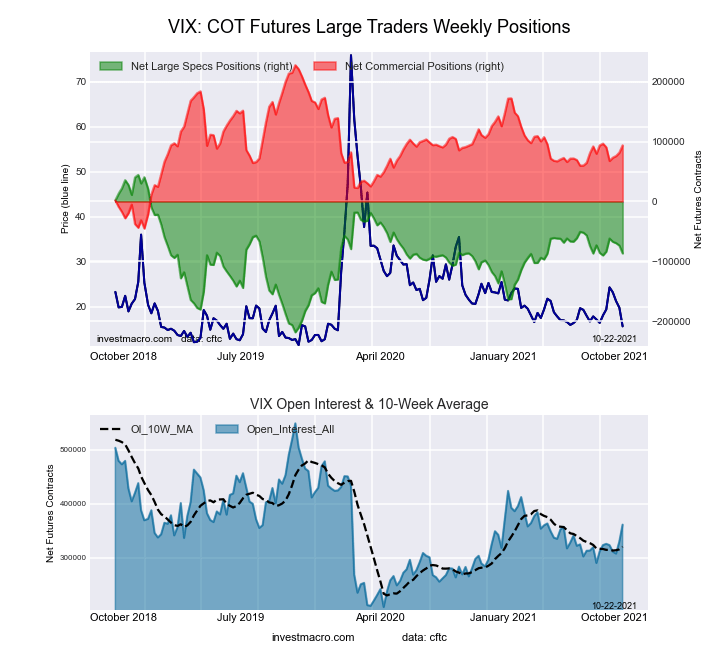
Federal Funds 30-Day Bonds Futures COT ChartThe VIX Volatility large speculator standing this week came in at a net position of -101,596 contracts in the data reported through Tuesday. This was a weekly fall of -14,828 contracts from the previous week which had a total of -86,768 net contracts.

This week’s current strength score (the trader positioning range over the past three years, measured from 0 to 100) shows the speculators are currently Bearish with a score of 44.5 percent. The commercials are Bullish with a score of 56.7 percent and the small traders (not shown in chart) are Bearish with a score of 26.3 percent.

VIX Volatility Futures StatisticsSPECULATORSCOMMERCIALSSMALL TRADERS
– Percent of Open Interest Longs:18.557.35.8
– Percent of Open Interest Shorts:48.624.88.2
– Net Position:-101,596109,530-7,934
– Gross Longs:62,466193,12419,666
– Gross Shorts:164,06283,59427,600
– Long to Short Ratio:0.4 to 12.3 to 10.7 to 1
NET POSITION TREND:
– COT Index Score (3 Year Range Pct):44.556.726.3
– COT Index Reading (3 Year Range):BearishBullishBearish
NET POSITION MOVEMENT INDEX:
– 6-Week Change in Strength Index:-6.87.0-4.5


S&P500 Mini Futures:

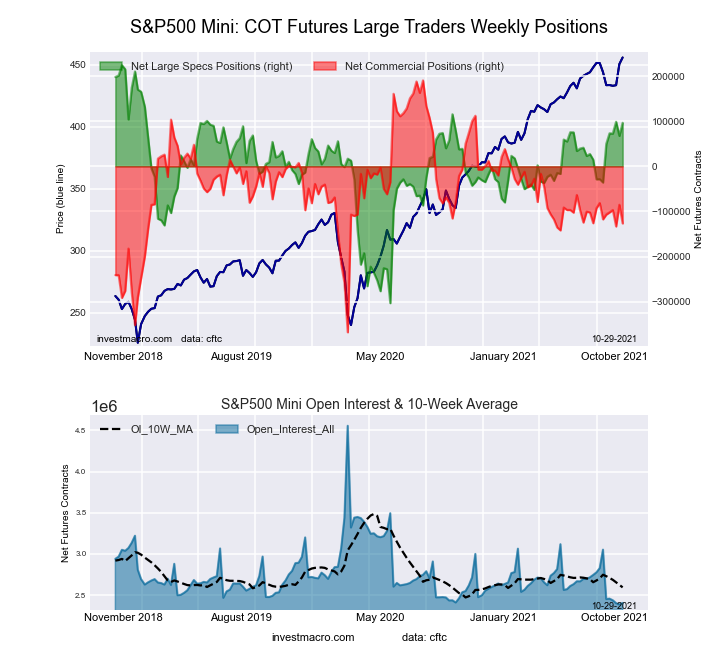
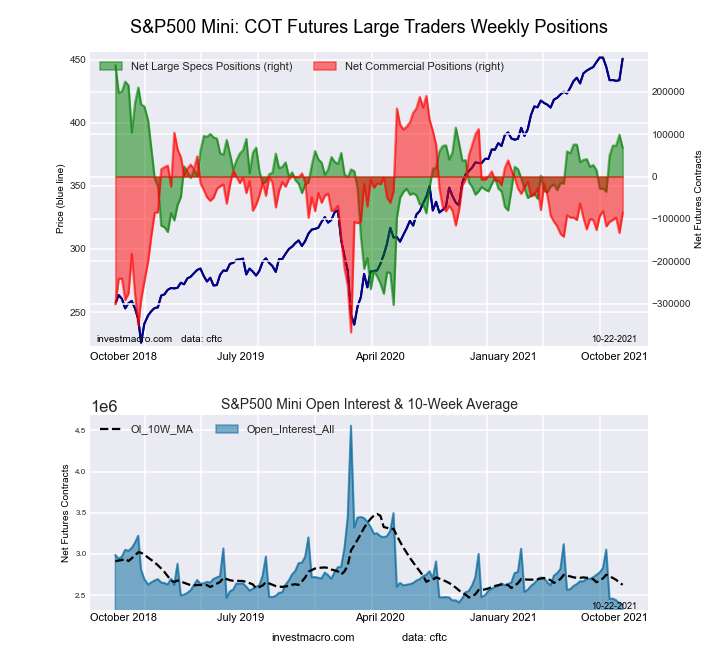
2-Year Treasury Bonds Futures COT ChartThe S&P500 Mini large speculator standing this week came in at a net position of 96,488 contracts in the data reported through Tuesday. This was a weekly gain of 28,869 contracts from the previous week which had a total of 67,619 net contracts.

This week’s current strength score (the trader positioning range over the past three years, measured from 0 to 100) shows the speculators are currently Bullish with a score of 75.8 percent. The commercials are Bearish with a score of 43.2 percent and the small traders (not shown in chart) are Bearish with a score of 32.7 percent.

S&P500 Mini Futures StatisticsSPECULATORSCOMMERCIALSSMALL TRADERS
– Percent of Open Interest Longs:14.771.211.4
– Percent of Open Interest Shorts:10.776.410.2
– Net Position:96,488-126,53830,050
– Gross Longs:352,6721,711,912274,773
– Gross Shorts:256,1841,838,450244,723
– Long to Short Ratio:1.4 to 10.9 to 11.1 to 1
NET POSITION TREND:
– COT Index Score (3 Year Range Pct):75.843.232.7
– COT Index Reading (3 Year Range):BullishBearishBearish
NET POSITION MOVEMENT INDEX:
– 6-Week Change in Strength Index:25.1-1.6-25.9


Dow Jones Mini Futures:

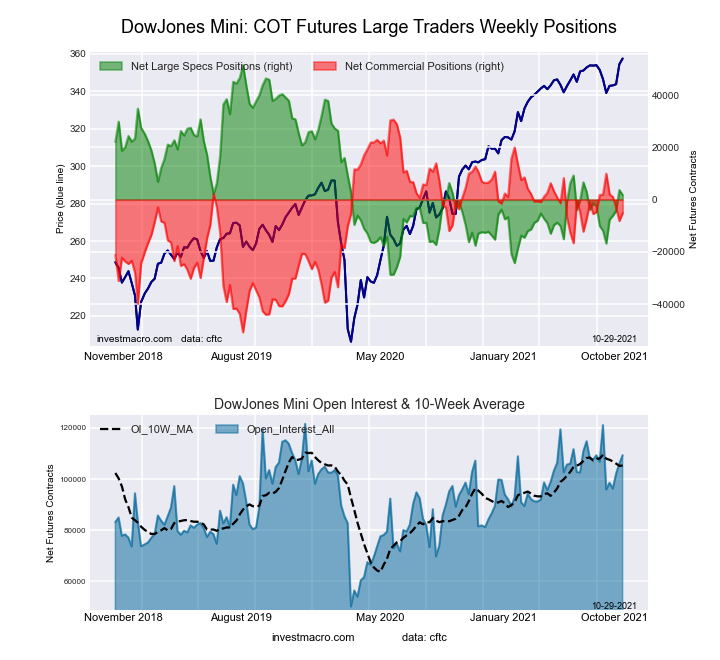
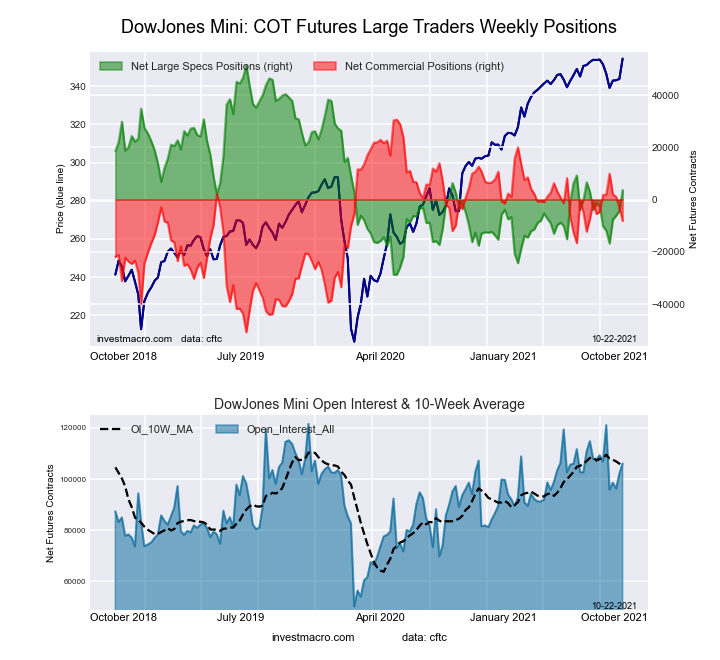
5-Year Treasury Bonds Futures COT ChartThe Dow Jones Mini large speculator standing this week came in at a net position of 1,737 contracts in the data reported through Tuesday. This was a weekly decrease of -1,894 contracts from the previous week which had a total of 3,631 net contracts.

This week’s current strength score (the trader positioning range over the past three years, measured from 0 to 100) shows the speculators are currently Bearish with a score of 38.0 percent. The commercials are Bullish with a score of 56.1 percent and the small traders (not shown in chart) are Bullish with a score of 56.9 percent.

Dow Jones Mini Futures StatisticsSPECULATORSCOMMERCIALSSMALL TRADERS
– Percent of Open Interest Longs:38.044.315.9
– Percent of Open Interest Shorts:36.449.012.8
– Net Position:1,737-5,1783,441
– Gross Longs:41,55148,39017,413
– Gross Shorts:39,81453,56813,972
– Long to Short Ratio:1.0 to 10.9 to 11.2 to 1
NET POSITION TREND:
– COT Index Score (3 Year Range Pct):38.056.156.9
– COT Index Reading (3 Year Range):BearishBullishBullish
NET POSITION MOVEMENT INDEX:
– 6-Week Change in Strength Index:17.0-8.7-35.1


Nasdaq Mini Futures:

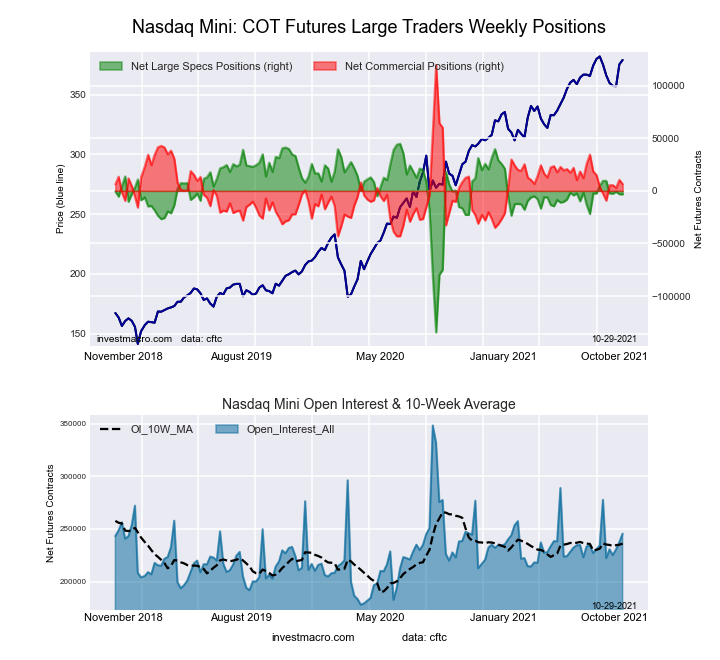
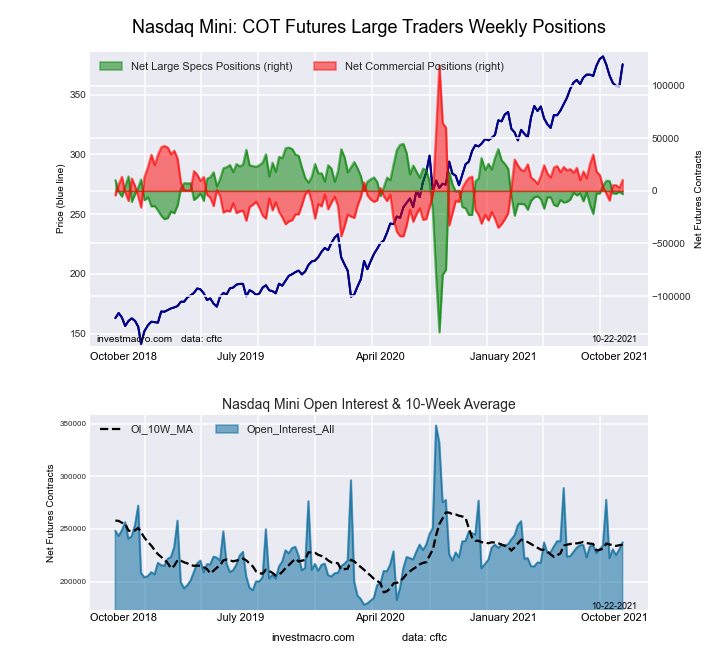
10-Year Treasury Notes Bonds Futures COT ChartThe Nasdaq Mini large speculator standing this week came in at a net position of -3,255 contracts in the data reported through Tuesday. This was a weekly reduction of -198 contracts from the previous week which had a total of -3,057 net contracts.

This week’s current strength score (the trader positioning range over the past three years, measured from 0 to 100) shows the speculators are currently Bullish with a score of 73.2 percent. The commercials are Bearish with a score of 30.5 percent and the small traders (not shown in chart) are Bearish with a score of 36.9 percent.

Nasdaq Mini Futures StatisticsSPECULATORSCOMMERCIALSSMALL TRADERS
– Percent of Open Interest Longs:26.856.015.6
– Percent of Open Interest Shorts:28.153.416.9
– Net Position:-3,2556,413-3,158
– Gross Longs:65,755137,55238,307
– Gross Shorts:69,010131,13941,465
– Long to Short Ratio:1.0 to 11.0 to 10.9 to 1
NET POSITION TREND:
– COT Index Score (3 Year Range Pct):73.230.536.9
– COT Index Reading (3 Year Range):BullishBearishBearish
NET POSITION MOVEMENT INDEX:
– 6-Week Change in Strength Index:-7.25.58.6


Russell 2000 Mini Futures:

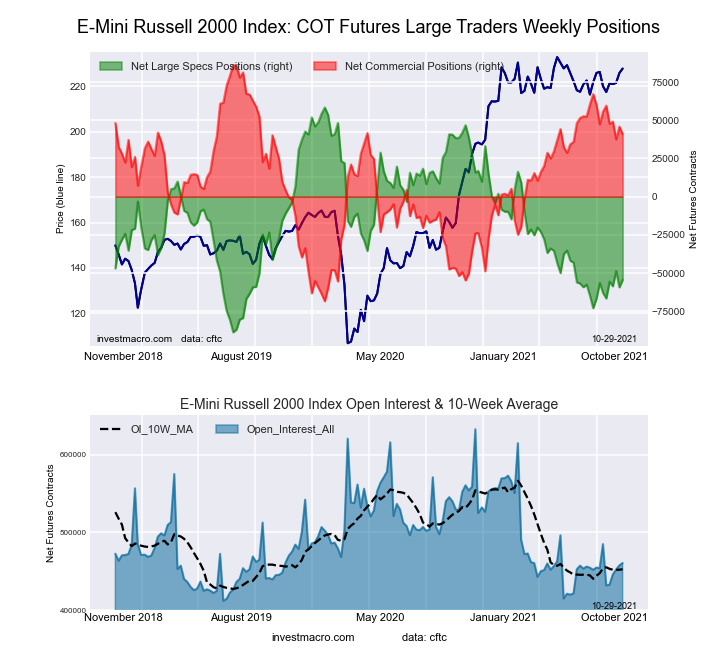
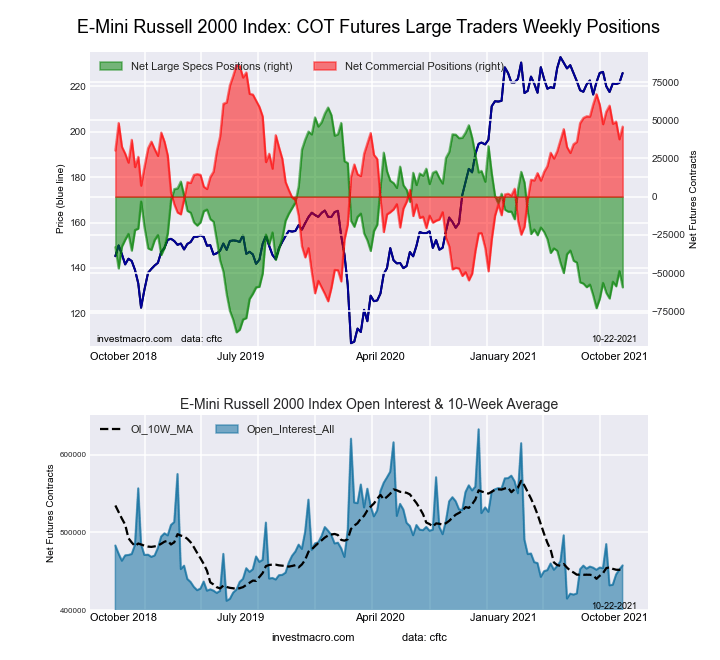
Ultra 10-Year Treasury Notes Bonds Futures COT ChartThe Russell 2000 Mini large speculator standing this week came in at a net position of -54,431 contracts in the data reported through Tuesday. This was a weekly gain of 4,890 contracts from the previous week which had a total of -59,321 net contracts.

This week’s current strength score (the trader positioning range over the past three years, measured from 0 to 100) shows the speculators are currently Bearish with a score of 23.3 percent. The commercials are Bullish with a score of 70.8 percent and the small traders (not shown in chart) are Bullish with a score of 71.3 percent.

Russell 2000 Mini Futures StatisticsSPECULATORSCOMMERCIALSSMALL TRADERS
– Percent of Open Interest Longs:13.079.17.0
– Percent of Open Interest Shorts:24.870.24.0
– Net Position:-54,43140,88713,544
– Gross Longs:59,793364,16332,009
– Gross Shorts:114,224323,27618,465
– Long to Short Ratio:0.5 to 11.1 to 11.7 to 1
NET POSITION TREND:
– COT Index Score (3 Year Range Pct):23.370.871.3
– COT Index Reading (3 Year Range):BearishBullishBullish
NET POSITION MOVEMENT INDEX:
– 6-Week Change in Strength Index:5.8-9.617.5


Nikkei Stock Average (USD) Futures:

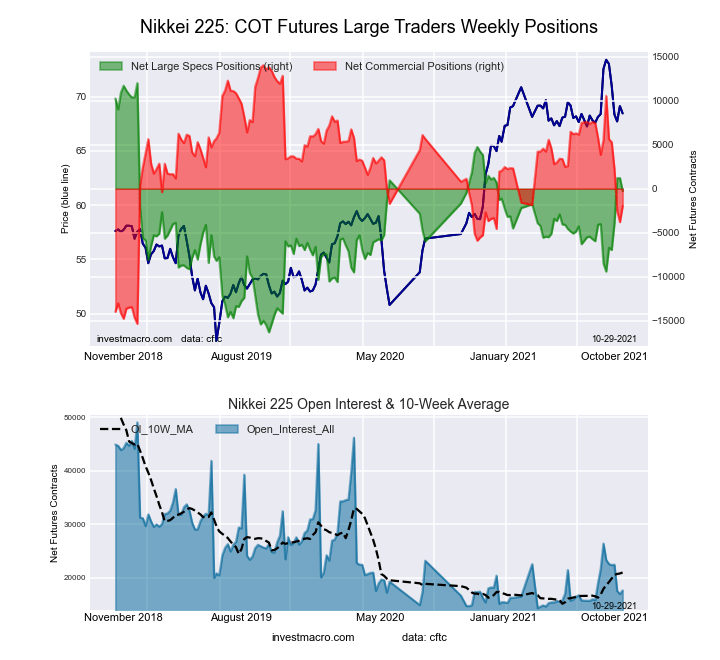
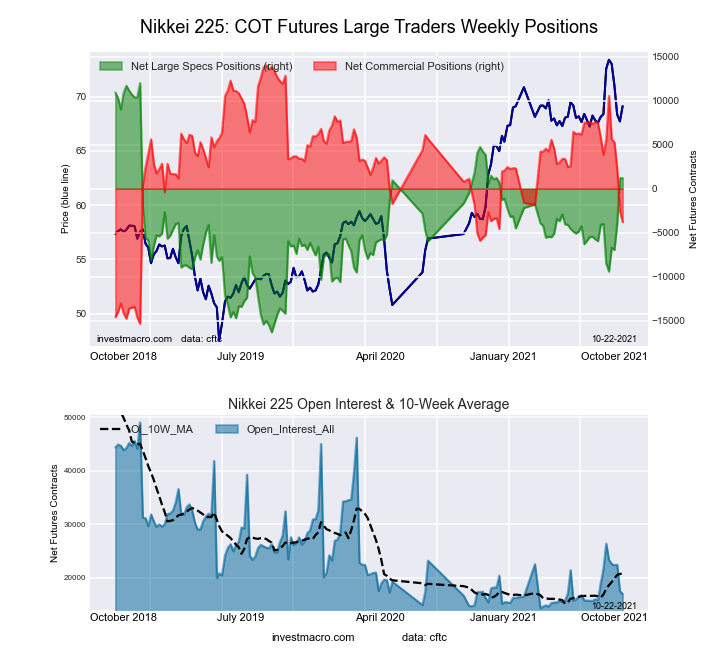
US Year Treasury Notes Long Bonds Futures COT ChartThe Nikkei Stock Average (USD) large speculator standing this week came in at a net position of -262 contracts in the data reported through Tuesday. This was a weekly reduction of -1,474 contracts from the previous week which had a total of 1,212 net contracts.

This week’s current strength score (the trader positioning range over the past three years, measured from 0 to 100) shows the speculators are currently Bullish with a score of 56.7 percent. The commercials are Bearish with a score of 45.6 percent and the small traders (not shown in chart) are Bullish with a score of 55.2 percent.

Nikkei Stock Average Futures StatisticsSPECULATORSCOMMERCIALSSMALL TRADERS
– Percent of Open Interest Longs:16.756.726.5
– Percent of Open Interest Shorts:18.267.713.9
– Net Position:-262-1,9562,218
– Gross Longs:2,9499,9994,674
– Gross Shorts:3,21111,9552,456
– Long to Short Ratio:0.9 to 10.8 to 11.9 to 1
NET POSITION TREND:
– COT Index Score (3 Year Range Pct):56.745.655.2
– COT Index Reading (3 Year Range):BullishBearishBullish
NET POSITION MOVEMENT INDEX:
– 6-Week Change in Strength Index:32.3-42.643.0


MSCI EAFE Mini Futures:

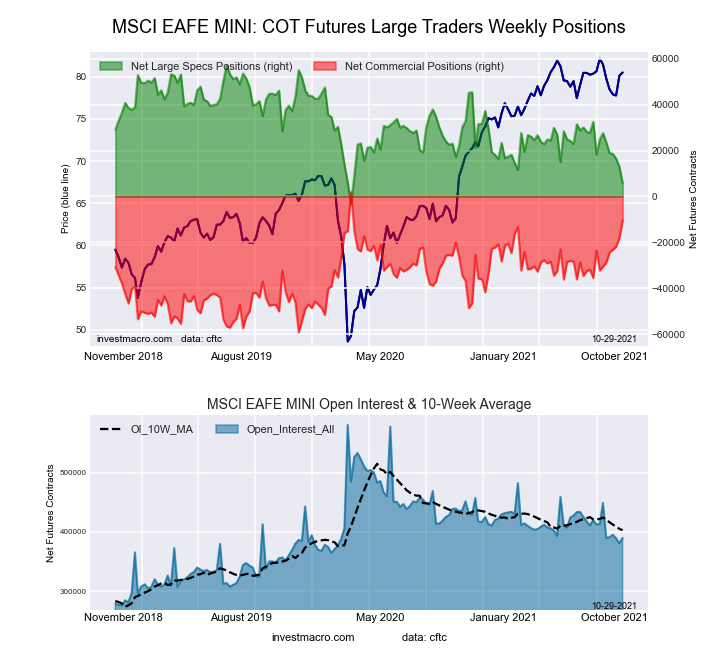
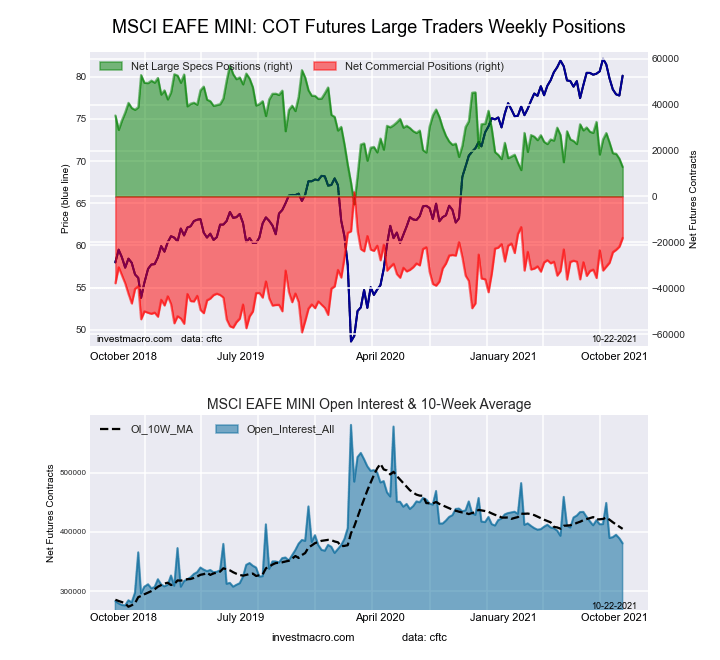
Ultra US Year Treasury Notes Long Bonds Futures COT ChartThe MSCI EAFE Mini large speculator standing this week came in at a net position of 5,775 contracts in the data reported through Tuesday. This was a weekly lowering of -7,064 contracts from the previous week which had a total of 12,839 net contracts.

This week’s current strength score (the trader positioning range over the past three years, measured from 0 to 100) shows the speculators are currently Bearish-Extreme with a score of 15.1 percent. The commercials are Bullish with a score of 80.0 percent and the small traders (not shown in chart) are Bullish with a score of 57.3 percent.

MSCI EAFE Mini Futures StatisticsSPECULATORSCOMMERCIALSSMALL TRADERS
– Percent of Open Interest Longs:6.790.32.8
– Percent of Open Interest Shorts:5.392.91.6
– Net Position:5,775-10,3444,569
– Gross Longs:26,318352,07610,989
– Gross Shorts:20,543362,4206,420
– Long to Short Ratio:1.3 to 11.0 to 11.7 to 1
NET POSITION TREND:
– COT Index Score (3 Year Range Pct):15.180.057.3
– COT Index Reading (3 Year Range):Bearish-ExtremeBullishBullish
NET POSITION MOVEMENT INDEX:
– 6-Week Change in Strength Index:-36.033.114.7


Article By InvestMacro.comReceive our weekly COT Reports by Email

*COT Report: The COT data, released weekly to the public each Friday, is updated through the most recent Tuesday (data is 3 days old) and shows a quick view of how large speculators or non-commercials (for-profit traders) were positioned in the futures markets.

The CFTC categorizes trader positions according to commercial hedgers (traders who use futures contracts for hedging as part of the business), non-commercials (large traders who speculate to realize trading profits) and nonreportable traders (usually small traders/speculators).

Find CFTC criteria here: (http://www.cftc.gov/MarketReports/CommitmentsofTraders/ExplanatoryNotes/index.htm).

COT Forex Charts: Speculator’s US Dollar Index bullish bets rise for 9th straight week

By InvestMacro.com COT Home | Data Tables | Data Downloads | Newsletter

Here are the latest charts and statistics for the Commitment of Traders (COT) data published by the Commodities Futures Trading Commission (CFTC).

The latest COT data is updated through Tuesday October 19th 2021 and shows a quick view of how large traders (for-profit speculators and commercial entities) were positioned in the futures markets. All currency positions are in direct relation to the US dollar where, for example, a bet for the euro is a bet that the euro will rise versus the dollar while a bet against the euro will be a bet that the euro will decline versus the dollar.

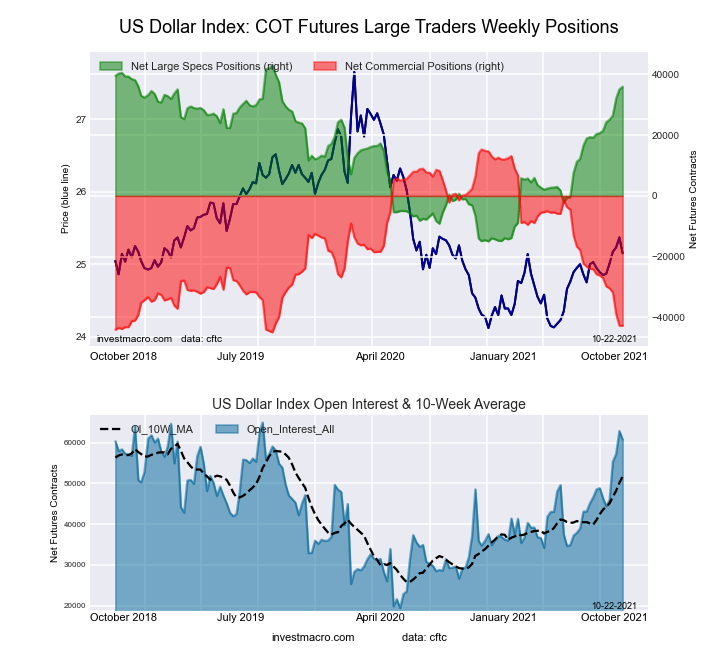
Highlighting this week’s COT Currency data is once again the speculator’s US Dollar Index bullish bets which have gained for nine consecutive weeks. Dollar Index speculative bullish positions have now risen for seventeen out of the past eighteen weeks to hit the highest level in the past one-hundred and five weeks, dating back to October 15th of 2019. The speculator strength index score (current levels compared to past three years) rose again this week and shows that spec sentiment is now in an extreme bullish position (88 percent score) for the third week in a row.


Data Snapshot of Forex Market Traders | Columns Legend
Oct-19-2021OIOI-IndexSpec-NetSpec-IndexCom-NetCOM-IndexSmalls-NetSmalls-Index
USD Index60,7319135,93488-42,72846,79491
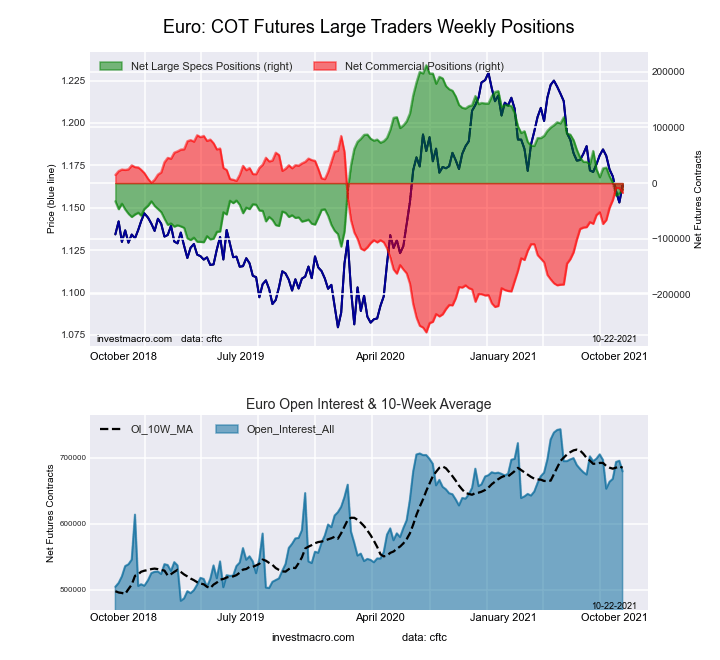
EUR679,41875-12,10731-17,5737129,68027
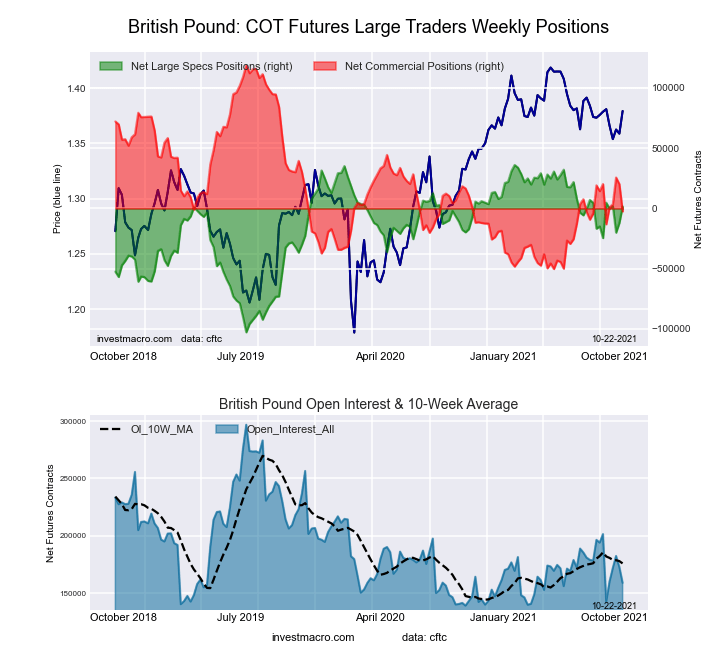
GBP158,961131,61575-2,3812876657
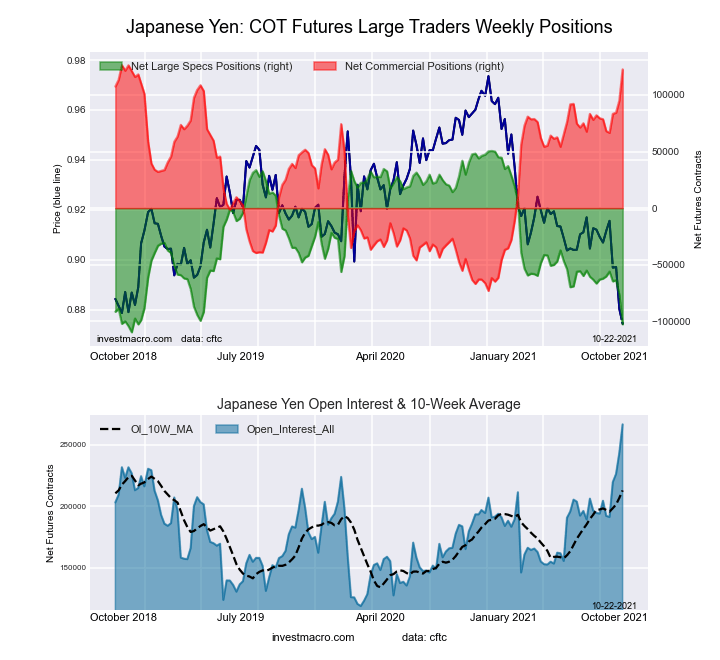
JPY266,750100-102,7344122,64098-19,9069
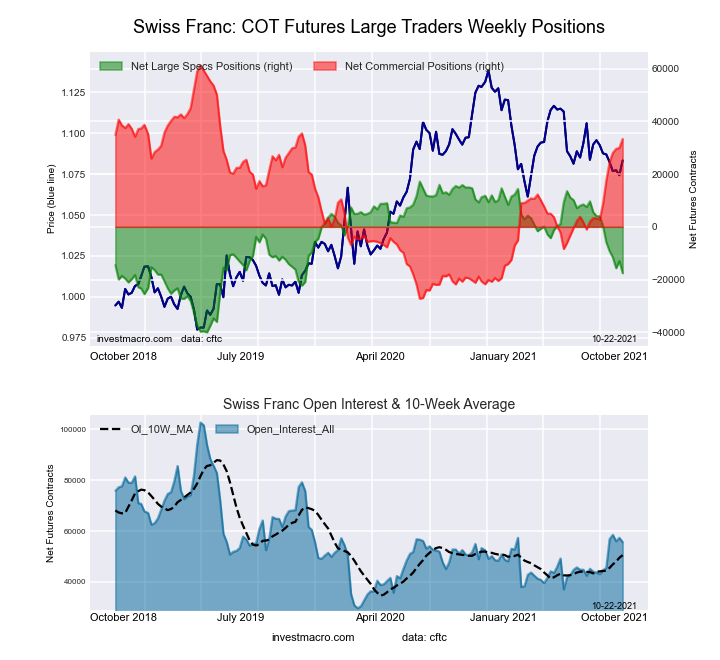
CHF55,60036-17,5843933,35368-15,76917
CAD153,91233-10,92446-7,8374718,76175
AUD158,53151-76,0581381,31180-5,25342
NZD37,730206,44082-7,598191,15865
MXN164,26831-38,571136,459992,11252
RUB53,5895922,17166-24,341302,17093
BRL29,98330-65868-1153377376
Bitcoin13,60593-2,8462424602,60075


US Dollar Index Futures:

Federal Funds 30-Day Bonds Futures COT ChartThe US Dollar Index large speculator standing this week equaled a net position of 35,934 contracts in the data reported through Tuesday. This was a weekly rise of 872 contracts from the previous week which had a total of 35,062 net contracts.

This week’s current strength score (the trader positioning range over the past three years, measured from 0 to 100) shows the speculators are currently Bullish-Extreme with a score of 87.8 percent. The commercials are Bearish-Extreme with a score of 3.6 percent and the small traders (not shown in chart) are Bullish-Extreme with a score of 90.9 percent.

US DOLLAR INDEX StatisticsSPECULATORSCOMMERCIALSSMALL TRADERS
– Percent of Open Interest Longs:78.33.514.2
– Percent of Open Interest Shorts:19.273.83.0
– Net Position:35,934-42,7286,794
– Gross Longs:47,5682,1048,642
– Gross Shorts:11,63444,8321,848
– Long to Short Ratio:4.1 to 10.0 to 14.7 to 1
NET POSITION TREND:
– COT Index Score (3 Year Range Pct):87.83.690.9
– COT Index Reading (3 Year Range):Bullish-ExtremeBearish-ExtremeBullish-Extreme
NET POSITION MOVEMENT INDEX:
– 6-Week Change in Strength Index:25.0-26.013.1


Euro Currency Futures:

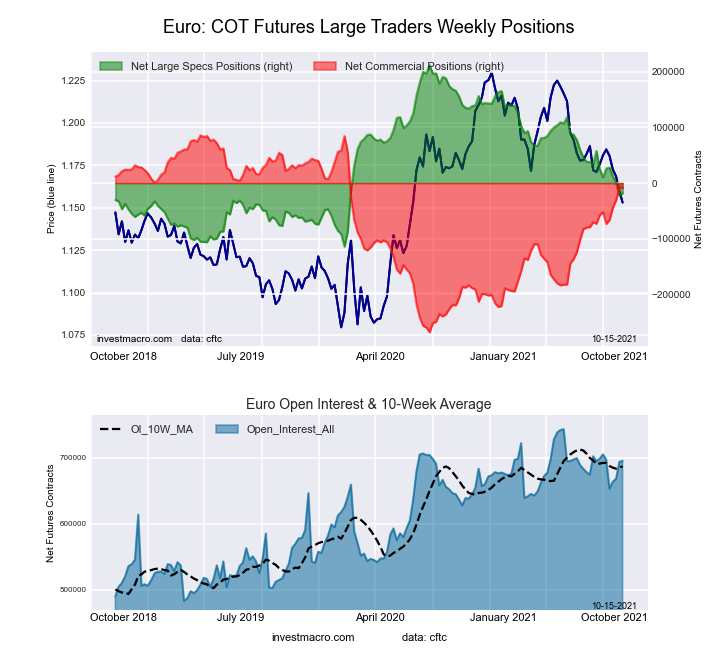
2-Year Treasury Bonds Futures COT ChartThe Euro Currency large speculator standing this week equaled a net position of -12,107 contracts in the data reported through Tuesday. This was a weekly increase of 6,291 contracts from the previous week which had a total of -18,398 net contracts.

This week’s current strength score (the trader positioning range over the past three years, measured from 0 to 100) shows the speculators are currently Bearish with a score of 31.3 percent. The commercials are Bullish with a score of 70.8 percent and the small traders (not shown in chart) are Bearish with a score of 27.0 percent.

EURO Currency StatisticsSPECULATORSCOMMERCIALSSMALL TRADERS
– Percent of Open Interest Longs:28.557.412.9
– Percent of Open Interest Shorts:30.259.98.5
– Net Position:-12,107-17,57329,680
– Gross Longs:193,320389,68287,763
– Gross Shorts:205,427407,25558,083
– Long to Short Ratio:0.9 to 11.0 to 11.5 to 1
NET POSITION TREND:
– COT Index Score (3 Year Range Pct):31.370.827.0
– COT Index Reading (3 Year Range):BearishBullishBearish
NET POSITION MOVEMENT INDEX:
– 6-Week Change in Strength Index:-11.815.7-27.4


British Pound Sterling Futures:

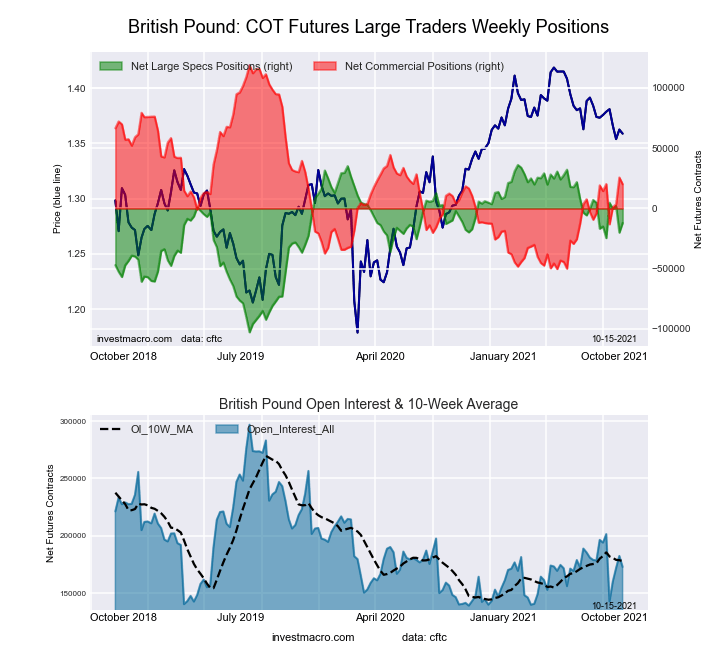
5-Year Treasury Bonds Futures COT ChartThe British Pound Sterling large speculator standing this week equaled a net position of 1,615 contracts in the data reported through Tuesday. This was a weekly gain of 13,594 contracts from the previous week which had a total of -11,979 net contracts.

This week’s current strength score (the trader positioning range over the past three years, measured from 0 to 100) shows the speculators are currently Bullish with a score of 75.2 percent. The commercials are Bearish with a score of 28.3 percent and the small traders (not shown in chart) are Bullish with a score of 57.2 percent.

BRITISH POUND StatisticsSPECULATORSCOMMERCIALSSMALL TRADERS
– Percent of Open Interest Longs:30.950.017.6
– Percent of Open Interest Shorts:29.951.517.1
– Net Position:1,615-2,381766
– Gross Longs:49,11279,45927,920
– Gross Shorts:47,49781,84027,154
– Long to Short Ratio:1.0 to 11.0 to 11.0 to 1
NET POSITION TREND:
– COT Index Score (3 Year Range Pct):75.228.357.2
– COT Index Reading (3 Year Range):BullishBearishBullish
NET POSITION MOVEMENT INDEX:
– 6-Week Change in Strength Index:18.8-13.4-7.2


Japanese Yen Futures:

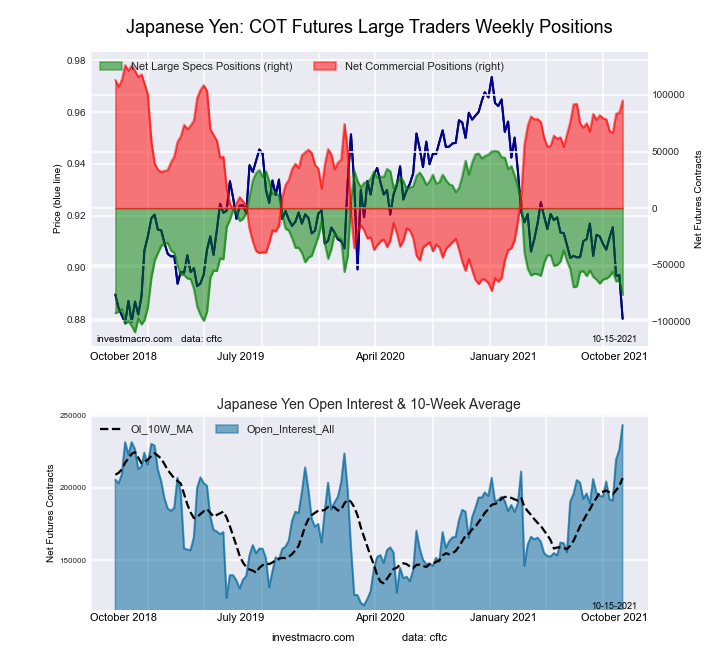
10-Year Treasury Notes Bonds Futures COT ChartThe Japanese Yen large speculator standing this week equaled a net position of -102,734 contracts in the data reported through Tuesday. This was a weekly lowering of -26,100 contracts from the previous week which had a total of -76,634 net contracts.

This week’s current strength score (the trader positioning range over the past three years, measured from 0 to 100) shows the speculators are currently Bearish-Extreme with a score of 4.4 percent. The commercials are Bullish-Extreme with a score of 98.1 percent and the small traders (not shown in chart) are Bearish-Extreme with a score of 9.3 percent.

JAPANESE YEN StatisticsSPECULATORSCOMMERCIALSSMALL TRADERS
– Percent of Open Interest Longs:13.477.97.9
– Percent of Open Interest Shorts:51.931.915.4
– Net Position:-102,734122,640-19,906
– Gross Longs:35,713207,73521,090
– Gross Shorts:138,44785,09540,996
– Long to Short Ratio:0.3 to 12.4 to 10.5 to 1
NET POSITION TREND:
– COT Index Score (3 Year Range Pct):4.498.19.3
– COT Index Reading (3 Year Range):Bearish-ExtremeBullish-ExtremeBearish-Extreme
NET POSITION MOVEMENT INDEX:
– 6-Week Change in Strength Index:-25.222.1-7.7


Swiss Franc Futures:

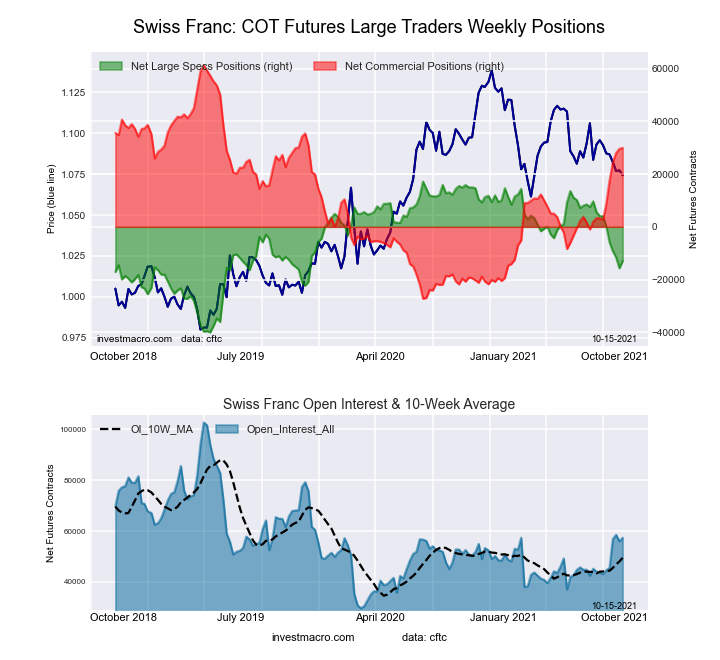
Ultra 10-Year Treasury Notes Bonds Futures COT ChartThe Swiss Franc large speculator standing this week equaled a net position of -17,584 contracts in the data reported through Tuesday. This was a weekly reduction of -4,612 contracts from the previous week which had a total of -12,972 net contracts.

This week’s current strength score (the trader positioning range over the past three years, measured from 0 to 100) shows the speculators are currently Bearish with a score of 39.2 percent. The commercials are Bullish with a score of 68.4 percent and the small traders (not shown in chart) are Bearish-Extreme with a score of 17.0 percent.

SWISS FRANC StatisticsSPECULATORSCOMMERCIALSSMALL TRADERS
– Percent of Open Interest Longs:4.380.315.4
– Percent of Open Interest Shorts:35.920.343.7
– Net Position:-17,58433,353-15,769
– Gross Longs:2,36544,6628,549
– Gross Shorts:19,94911,30924,318
– Long to Short Ratio:0.1 to 13.9 to 10.4 to 1
NET POSITION TREND:
– COT Index Score (3 Year Range Pct):39.268.417.0
– COT Index Reading (3 Year Range):BearishBullishBearish-Extreme
NET POSITION MOVEMENT INDEX:
– 6-Week Change in Strength Index:-31.127.7-19.8


Canadian Dollar Futures:

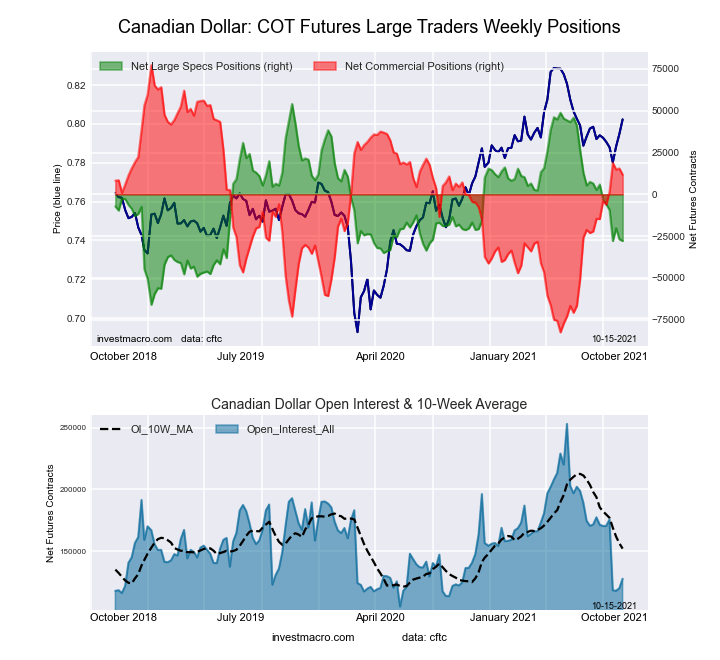
US Year Treasury Notes Long Bonds Futures COT ChartThe Canadian Dollar large speculator standing this week equaled a net position of -10,924 contracts in the data reported through Tuesday. This was a weekly rise of 16,936 contracts from the previous week which had a total of -27,860 net contracts.

This week’s current strength score (the trader positioning range over the past three years, measured from 0 to 100) shows the speculators are currently Bearish with a score of 45.9 percent. The commercials are Bearish with a score of 46.7 percent and the small traders (not shown in chart) are Bullish with a score of 75.1 percent.

CANADIAN DOLLAR StatisticsSPECULATORSCOMMERCIALSSMALL TRADERS
– Percent of Open Interest Longs:26.247.225.3
– Percent of Open Interest Shorts:33.352.313.1
– Net Position:-10,924-7,83718,761
– Gross Longs:40,38072,67538,947
– Gross Shorts:51,30480,51220,186
– Long to Short Ratio:0.8 to 10.9 to 11.9 to 1
NET POSITION TREND:
– COT Index Score (3 Year Range Pct):45.946.775.1
– COT Index Reading (3 Year Range):BearishBearishBullish
NET POSITION MOVEMENT INDEX:
– 6-Week Change in Strength Index:-4.1-1.110.1


Australian Dollar Futures:

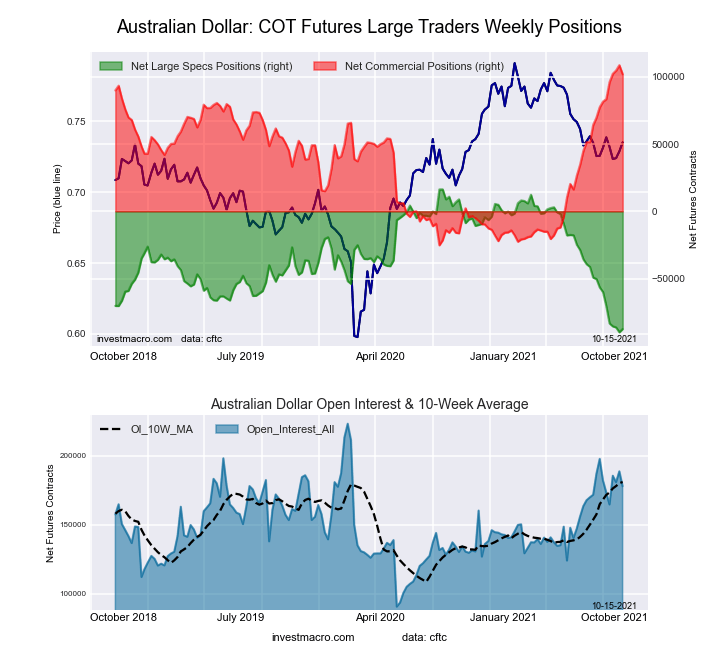
Ultra US Year Treasury Notes Long Bonds Futures COT ChartThe Australian Dollar large speculator standing this week equaled a net position of -76,058 contracts in the data reported through Tuesday. This was a weekly increase of 11,550 contracts from the previous week which had a total of -87,608 net contracts.

This week’s current strength score (the trader positioning range over the past three years, measured from 0 to 100) shows the speculators are currently Bearish-Extreme with a score of 13.1 percent. The commercials are Bullish with a score of 79.6 percent and the small traders (not shown in chart) are Bearish with a score of 41.7 percent.

AUSTRALIAN DOLLAR StatisticsSPECULATORSCOMMERCIALSSMALL TRADERS
– Percent of Open Interest Longs:7.376.613.7
– Percent of Open Interest Shorts:55.325.417.0
– Net Position:-76,05881,311-5,253
– Gross Longs:11,632121,50221,748
– Gross Shorts:87,69040,19127,001
– Long to Short Ratio:0.1 to 13.0 to 10.8 to 1
NET POSITION TREND:
– COT Index Score (3 Year Range Pct):13.179.641.7
– COT Index Reading (3 Year Range):Bearish-ExtremeBullishBearish
NET POSITION MOVEMENT INDEX:
– 6-Week Change in Strength Index:-5.2-1.618.2


New Zealand Dollar Futures:

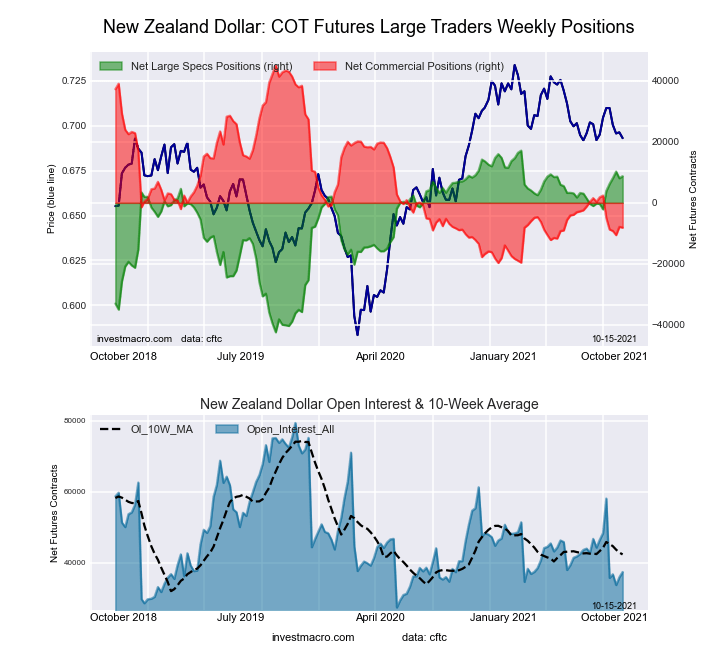
Eurodollar Bonds Futures COT ChartThe New Zealand Dollar large speculator standing this week equaled a net position of 6,440 contracts in the data reported through Tuesday. This was a weekly lowering of -2,308 contracts from the previous week which had a total of 8,748 net contracts.

This week’s current strength score (the trader positioning range over the past three years, measured from 0 to 100) shows the speculators are currently Bullish-Extreme with a score of 82.1 percent. The commercials are Bearish-Extreme with a score of 18.7 percent and the small traders (not shown in chart) are Bullish with a score of 65.1 percent.

NEW ZEALAND DOLLAR StatisticsSPECULATORSCOMMERCIALSSMALL TRADERS
– Percent of Open Interest Longs:55.729.712.3
– Percent of Open Interest Shorts:38.649.89.2
– Net Position:6,440-7,5981,158
– Gross Longs:21,00411,1944,631
– Gross Shorts:14,56418,7923,473
– Long to Short Ratio:1.4 to 10.6 to 11.3 to 1
NET POSITION TREND:
– COT Index Score (3 Year Range Pct):82.118.765.1
– COT Index Reading (3 Year Range):Bullish-ExtremeBearish-ExtremeBullish
NET POSITION MOVEMENT INDEX:
– 6-Week Change in Strength Index:4.3-4.00.4


Mexican Peso Futures:

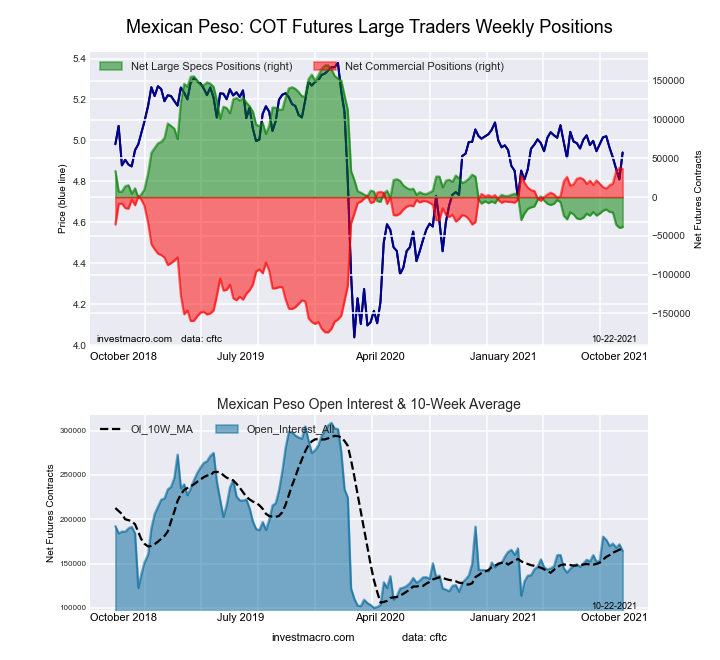
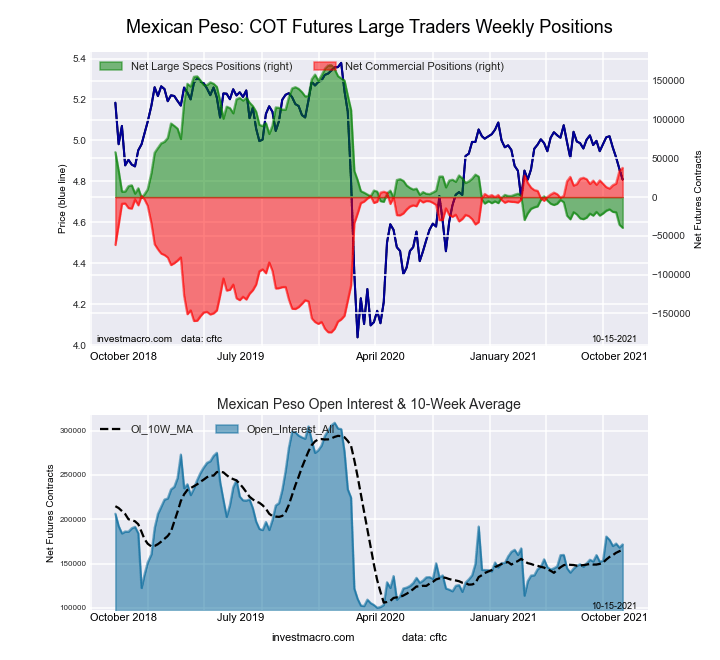
Ultra 10-Year Treasury Notes Bonds Futures COT ChartThe Mexican Peso large speculator standing this week equaled a net position of -38,571 contracts in the data reported through Tuesday. This was a weekly increase of 1,063 contracts from the previous week which had a total of -39,634 net contracts.

This week’s current strength score (the trader positioning range over the past three years, measured from 0 to 100) shows the speculators are currently Bearish-Extreme with a score of 0.5 percent. The commercials are Bullish-Extreme with a score of 99.4 percent and the small traders (not shown in chart) are Bullish with a score of 52.0 percent.

MEXICAN PESO StatisticsSPECULATORSCOMMERCIALSSMALL TRADERS
– Percent of Open Interest Longs:42.752.93.6
– Percent of Open Interest Shorts:66.230.72.3
– Net Position:-38,57136,4592,112
– Gross Longs:70,19286,8645,934
– Gross Shorts:108,76350,4053,822
– Long to Short Ratio:0.6 to 11.7 to 11.6 to 1
NET POSITION TREND:
– COT Index Score (3 Year Range Pct):0.599.452.0
– COT Index Reading (3 Year Range):Bearish-ExtremeBullish-ExtremeBullish
NET POSITION MOVEMENT INDEX:
– 6-Week Change in Strength Index:-10.011.1-10.8


Brazilian Real Futures:

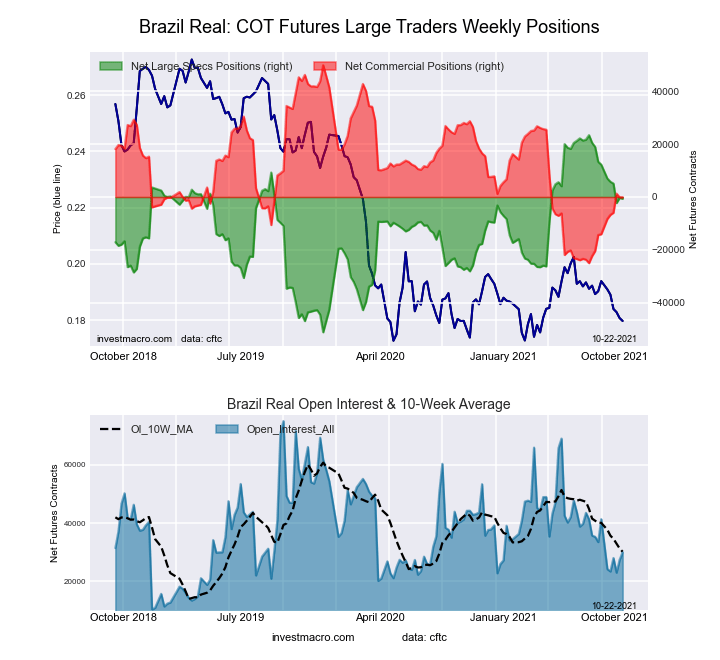
US Year Treasury Notes Long Bonds Futures COT ChartThe Brazilian Real large speculator standing this week equaled a net position of -658 contracts in the data reported through Tuesday. This was a weekly reduction of -285 contracts from the previous week which had a total of -373 net contracts.

This week’s current strength score (the trader positioning range over the past three years, measured from 0 to 100) shows the speculators are currently Bullish with a score of 67.7 percent. The commercials are Bearish with a score of 33.3 percent and the small traders (not shown in chart) are Bullish with a score of 76.2 percent.

BRAZIL REAL StatisticsSPECULATORSCOMMERCIALSSMALL TRADERS
– Percent of Open Interest Longs:54.733.011.8
– Percent of Open Interest Shorts:56.933.49.2
– Net Position:-658-115773
– Gross Longs:16,3999,9063,535
– Gross Shorts:17,05710,0212,762
– Long to Short Ratio:1.0 to 11.0 to 11.3 to 1
NET POSITION TREND:
– COT Index Score (3 Year Range Pct):67.733.376.2
– COT Index Reading (3 Year Range):BullishBearishBullish
NET POSITION MOVEMENT INDEX:
– 6-Week Change in Strength Index:-9.410.2-8.2


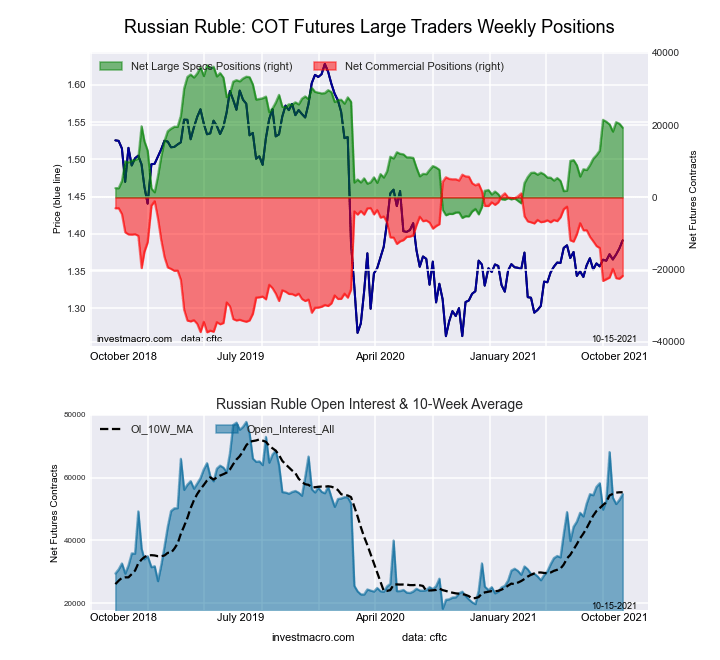
Russian Ruble Futures:

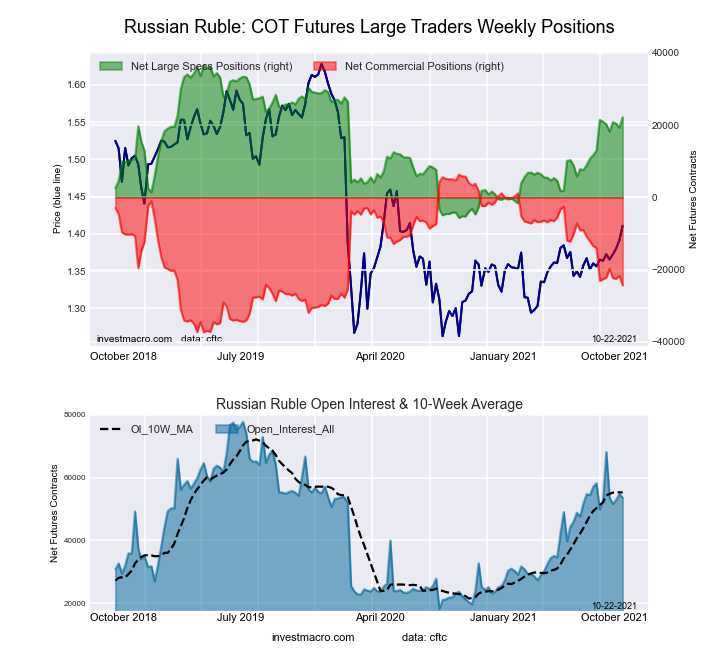
Ultra US Year Treasury Notes Long Bonds Futures COT ChartThe Russian Ruble large speculator standing this week equaled a net position of 22,171 contracts in the data reported through Tuesday. This was a weekly lift of 2,863 contracts from the previous week which had a total of 19,308 net contracts.

This week’s current strength score (the trader positioning range over the past three years, measured from 0 to 100) shows the speculators are currently Bullish with a score of 65.9 percent. The commercials are Bearish with a score of 29.7 percent and the small traders (not shown in chart) are Bullish-Extreme with a score of 93.5 percent.

RUSSIAN RUBLE StatisticsSPECULATORSCOMMERCIALSSMALL TRADERS
– Percent of Open Interest Longs:58.935.05.8
– Percent of Open Interest Shorts:17.580.51.8
– Net Position:22,171-24,3412,170
– Gross Longs:31,55118,7783,134
– Gross Shorts:9,38043,119964
– Long to Short Ratio:3.4 to 10.4 to 13.3 to 1
NET POSITION TREND:
– COT Index Score (3 Year Range Pct):65.929.793.5
– COT Index Reading (3 Year Range):BullishBearishBullish-Extreme
NET POSITION MOVEMENT INDEX:
– 6-Week Change in Strength Index:2.9-3.913.3


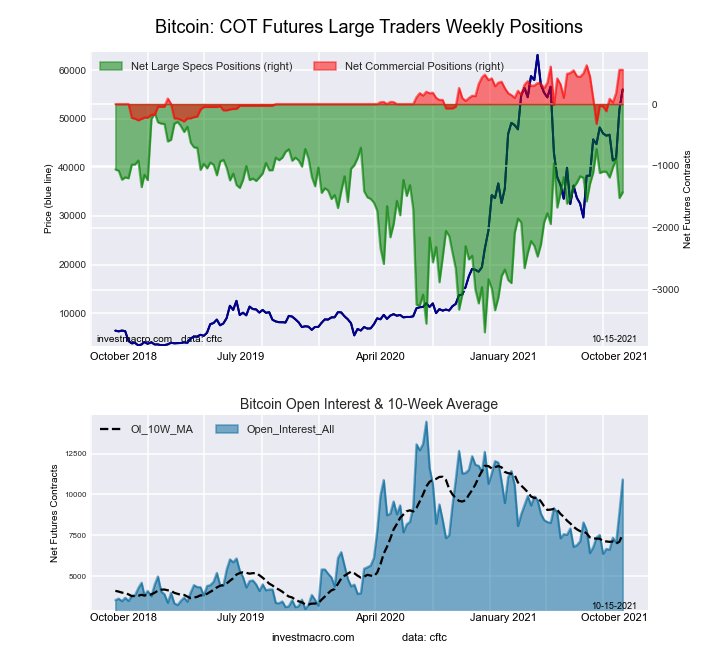
Bitcoin Futures:

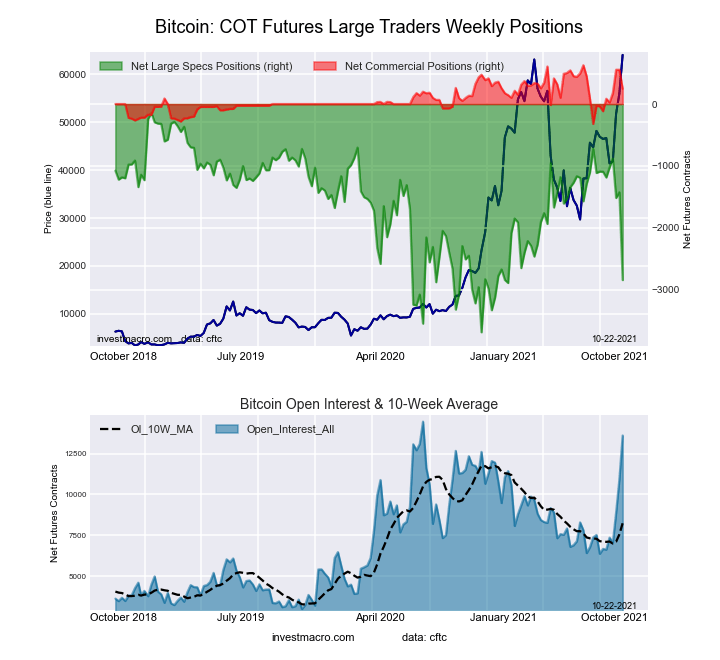
Eurodollar Bonds Futures COT ChartThe Bitcoin large speculator standing this week equaled a net position of -2,846 contracts in the data reported through Tuesday. This was a weekly decrease of -1,420 contracts from the previous week which had a total of -1,426 net contracts.

This week’s current strength score (the trader positioning range over the past three years, measured from 0 to 100) shows the speculators are currently Bearish with a score of 23.8 percent. The commercials are Bullish with a score of 59.7 percent and the small traders (not shown in chart) are Bullish with a score of 75.3 percent.

BITCOIN StatisticsSPECULATORSCOMMERCIALSSMALL TRADERS
– Percent of Open Interest Longs:52.03.628.4
– Percent of Open Interest Shorts:72.91.89.3
– Net Position:-2,8462462,600
– Gross Longs:7,0694863,868
– Gross Shorts:9,9152401,268
– Long to Short Ratio:0.7 to 12.0 to 13.1 to 1
NET POSITION TREND:
– COT Index Score (3 Year Range Pct):23.859.775.3
– COT Index Reading (3 Year Range):BearishBullishBullish
NET POSITION MOVEMENT INDEX:
– 6-Week Change in Strength Index:-49.438.045.8


Article By InvestMacro.comReceive our weekly COT Reports by Email

*COT Report: The COT data, released weekly to the public each Friday, is updated through the most recent Tuesday (data is 3 days old) and shows a quick view of how large speculators or non-commercials (for-profit traders) were positioned in the futures markets.

The CFTC categorizes trader positions according to commercial hedgers (traders who use futures contracts for hedging as part of the business), non-commercials (large traders who speculate to realize trading profits) and nonreportable traders (usually small traders/speculators).

Find CFTC criteria here: (http://www.cftc.gov/MarketReports/CommitmentsofTraders/ExplanatoryNotes/index.htm).
COT Soft Commodities Charts: Coffee bets remain in bullish extreme level for 26th week

By InvestMacro.com COT Home | Data Tables | Data Downloads | Newsletter

Here are the latest charts and statistics for the Commitment of Traders (COT) data published by the Commodities Futures Trading Commission (CFTC).

The latest COT data is updated through Tuesday October 19th 2021 and shows a quick view of how large traders (for-profit speculators and commercial entities) were positioned in the futures markets.

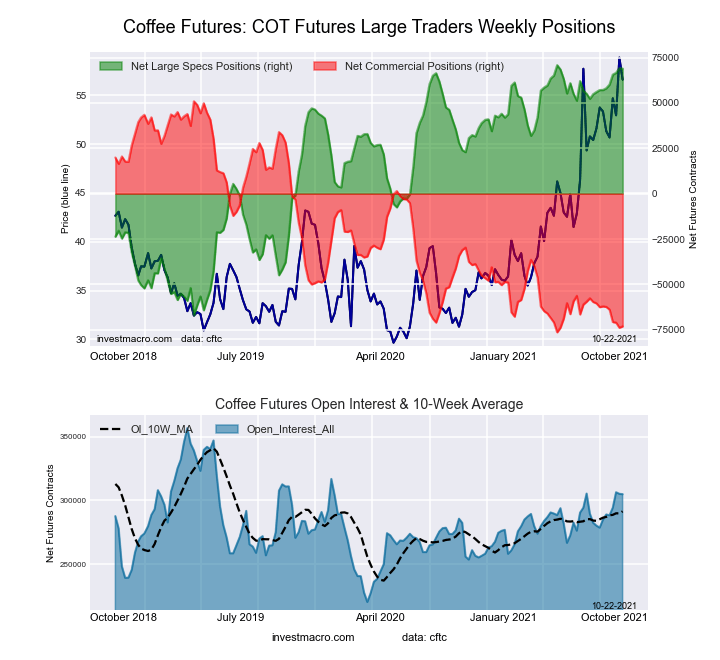
Highlighting this week’s COT Soft Commodities data is the speculator’s Coffee bullish bets which dipped by just -196 net contracts. Despite the small shortfall this week, Coffee speculative positions continue to be at an extreme bullish level and had risen for nine straight weeks from August 17th to October 12th to a 20-week high. The speculator strength index score (current levels compared to past three years) has continued to remain in an extreme bullish score (above 80 percent) for 26 weeks in a row and is currently at 98 percent. A potential coffee supply shortage as well as speculative effect on coffee prices can be seen in the rapidly appreciating coffee price (see chart below in coffee section).


Data Snapshot of Commodity Market Traders | Columns Legend
Oct-19-2021OIOI-IndexSpec-NetSpec-IndexCom-NetCOM-IndexSmalls-NetSmalls-Index
WTI Crude2,205,08944429,59449-473,1814143,58776
Gold485,97422193,34956-219,1904325,84143
Silver143,6641030,35653-44,5805514,22423
Copper225,2254440,58472-46,208285,62458
Palladium9,06112-2,41652,355936148
Platinum58,5701914,84424-21,176796,33250
Natural Gas1,318,49848-131,0703986,5745844,49692
Brent202,71441-28,0187323,413234,60576
Heating Oil415,5565626,44181-50,2501823,80981
Soybeans750,9393343,54141-9,57564-33,96615
Corn1,404,1265277,02965-218,17241-58,8579
Coffee304,8746268,88999-73,10034,21117
Sugar871,31621211,55080-243,5642232,01447
Wheat394,94927-8,5664018,18059-9,61456


CORN Futures:

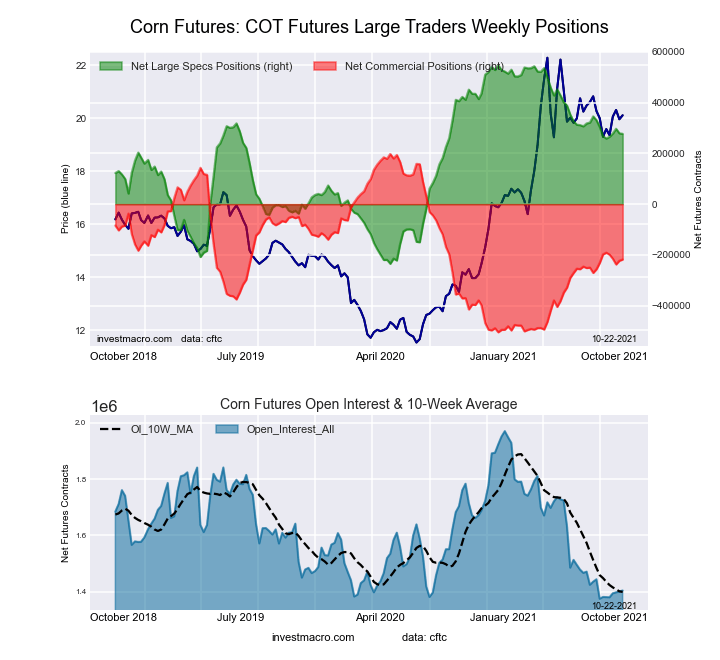
Federal Funds 30-Day Bonds Futures COT ChartThe CORN large speculator standing this week resulted in a net position of 277,029 contracts in the data reported through Tuesday. This was a weekly reduction of -2,259 contracts from the previous week which had a total of 279,288 net contracts.

This week’s current strength score (the trader positioning range over the past three years, measured from 0 to 100) shows the speculators are currently Bullish with a score of 65.4 percent. The commercials are Bearish with a score of 40.8 percent and the small traders (not shown in chart) are Bearish-Extreme with a score of 9.2 percent.

CORN Futures StatisticsSPECULATORSCOMMERCIALSSMALL TRADERS
– Percent of Open Interest Longs:27.849.49.1
– Percent of Open Interest Shorts:8.164.913.3
– Net Position:277,029-218,172-58,857
– Gross Longs:390,081693,006128,301
– Gross Shorts:113,052911,178187,158
– Long to Short Ratio:3.5 to 10.8 to 10.7 to 1
NET POSITION TREND:
– COT Index Score (3 Year Range Pct):65.440.89.2
– COT Index Reading (3 Year Range):BullishBearishBearish-Extreme
NET POSITION MOVEMENT INDEX:
– 6-Week Change in Strength Index:1.2-2.86.1


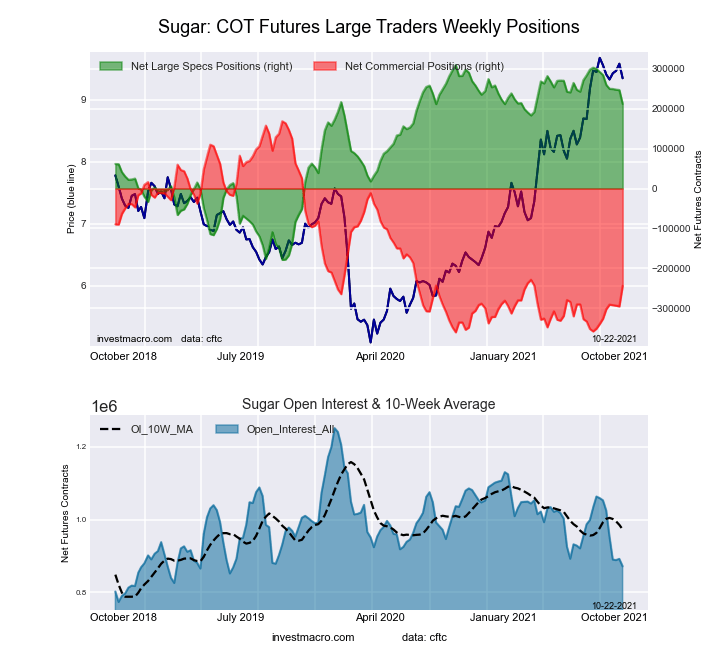
SUGAR Futures:

2-Year Treasury Bonds Futures COT ChartThe SUGAR large speculator standing this week resulted in a net position of 211,550 contracts in the data reported through Tuesday. This was a weekly lowering of -34,638 contracts from the previous week which had a total of 246,188 net contracts.

This week’s current strength score (the trader positioning range over the past three years, measured from 0 to 100) shows the speculators are currently Bullish-Extreme with a score of 80.1 percent. The commercials are Bearish with a score of 22.0 percent and the small traders (not shown in chart) are Bearish with a score of 47.4 percent.

SUGAR Futures StatisticsSPECULATORSCOMMERCIALSSMALL TRADERS
– Percent of Open Interest Longs:31.443.99.8
– Percent of Open Interest Shorts:7.171.86.2
– Net Position:211,550-243,56432,014
– Gross Longs:273,687382,38685,819
– Gross Shorts:62,137625,95053,805
– Long to Short Ratio:4.4 to 10.6 to 11.6 to 1
NET POSITION TREND:
– COT Index Score (3 Year Range Pct):80.122.047.4
– COT Index Reading (3 Year Range):Bullish-ExtremeBearishBearish
NET POSITION MOVEMENT INDEX:
– 6-Week Change in Strength Index:-14.915.6-12.1


COFFEE Futures:

5-Year Treasury Bonds Futures COT ChartThe COFFEE large speculator standing this week resulted in a net position of 68,889 contracts in the data reported through Tuesday. This was a weekly decrease of -196 contracts from the previous week which had a total of 69,085 net contracts.

This week’s current strength score (the trader positioning range over the past three years, measured from 0 to 100) shows the speculators are currently Bullish-Extreme with a score of 98.6 percent. The commercials are Bearish-Extreme with a score of 2.5 percent and the small traders (not shown in chart) are Bearish-Extreme with a score of 17.5 percent.

COFFEE Futures StatisticsSPECULATORSCOMMERCIALSSMALL TRADERS
– Percent of Open Interest Longs:27.940.53.8
– Percent of Open Interest Shorts:5.364.52.4
– Net Position:68,889-73,1004,211
– Gross Longs:85,100123,54011,611
– Gross Shorts:16,211196,6407,400
– Long to Short Ratio:5.2 to 10.6 to 11.6 to 1
NET POSITION TREND:
– COT Index Score (3 Year Range Pct):98.62.517.5
– COT Index Reading (3 Year Range):Bullish-ExtremeBearish-ExtremeBearish-Extreme
NET POSITION MOVEMENT INDEX:
– 6-Week Change in Strength Index:8.5-8.7-5.3


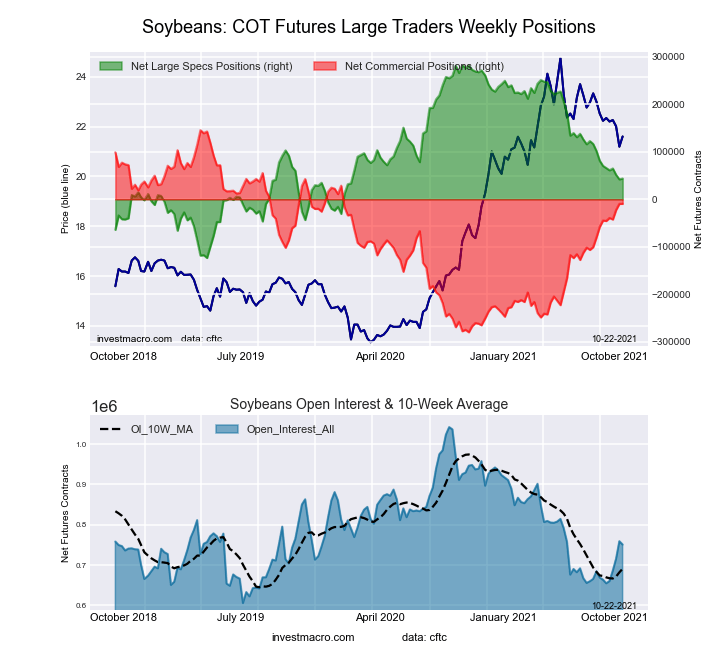
SOYBEANS Futures:

10-Year Treasury Notes Bonds Futures COT ChartThe SOYBEANS large speculator standing this week resulted in a net position of 43,541 contracts in the data reported through Tuesday. This was a weekly advance of 1,551 contracts from the previous week which had a total of 41,990 net contracts.

This week’s current strength score (the trader positioning range over the past three years, measured from 0 to 100) shows the speculators are currently Bearish with a score of 41.2 percent. The commercials are Bullish with a score of 63.6 percent and the small traders (not shown in chart) are Bearish-Extreme with a score of 15.3 percent.

SOYBEANS Futures StatisticsSPECULATORSCOMMERCIALSSMALL TRADERS
– Percent of Open Interest Longs:18.559.76.7
– Percent of Open Interest Shorts:12.761.011.2
– Net Position:43,541-9,575-33,966
– Gross Longs:138,576448,24350,125
– Gross Shorts:95,035457,81884,091
– Long to Short Ratio:1.5 to 11.0 to 10.6 to 1
NET POSITION TREND:
– COT Index Score (3 Year Range Pct):41.263.615.3
– COT Index Reading (3 Year Range):BearishBullishBearish-Extreme
NET POSITION MOVEMENT INDEX:
– 6-Week Change in Strength Index:-6.68.3-14.2


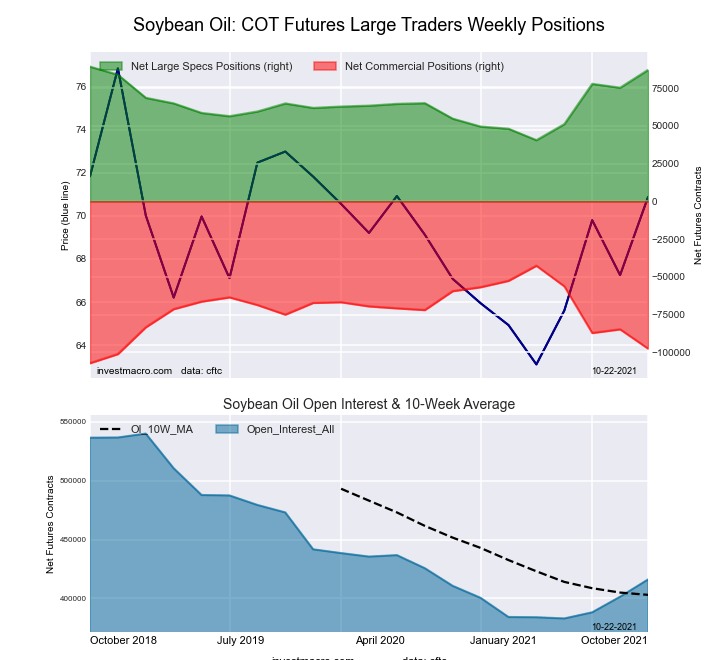
SOYBEAN OIL Futures:

Ultra 10-Year Treasury Notes Bonds Futures COT ChartThe SOYBEAN OIL large speculator standing this week resulted in a net position of 87,085 contracts in the data reported through Tuesday. This was a weekly rise of 11,787 contracts from the previous week which had a total of 75,298 net contracts.

This week’s current strength score (the trader positioning range over the past three years, measured from 0 to 100) shows the speculators are currently Bullish with a score of 70.8 percent. The commercials are Bearish with a score of 31.0 percent and the small traders (not shown in chart) are Bullish with a score of 52.5 percent.

SOYBEAN OIL Futures StatisticsSPECULATORSCOMMERCIALSSMALL TRADERS
– Percent of Open Interest Longs:27.548.37.4
– Percent of Open Interest Shorts:6.671.74.9
– Net Position:87,085-97,54710,462
– Gross Longs:114,434200,79330,908
– Gross Shorts:27,349298,34020,446
– Long to Short Ratio:4.2 to 10.7 to 11.5 to 1
NET POSITION TREND:
– COT Index Score (3 Year Range Pct):70.831.052.5
– COT Index Reading (3 Year Range):BullishBearishBullish
NET POSITION MOVEMENT INDEX:
– 6-Week Change in Strength Index:20.2-20.311.7


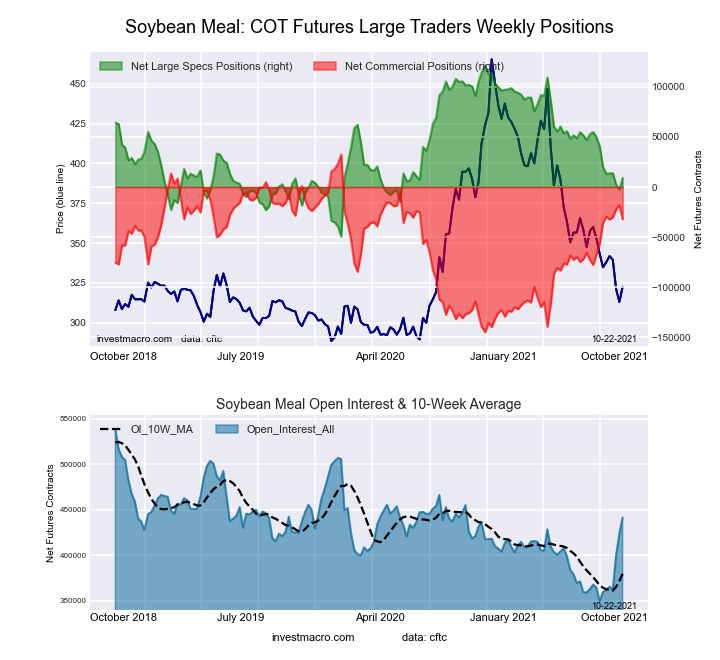
SOYBEAN MEAL Futures:

US Year Treasury Notes Long Bonds Futures COT ChartThe SOYBEAN MEAL large speculator standing this week resulted in a net position of 9,114 contracts in the data reported through Tuesday. This was a weekly boost of 11,701 contracts from the previous week which had a total of -2,587 net contracts.

This week’s current strength score (the trader positioning range over the past three years, measured from 0 to 100) shows the speculators are currently Bearish with a score of 34.2 percent. The commercials are Bullish with a score of 63.6 percent and the small traders (not shown in chart) are Bullish with a score of 63.1 percent.

SOYBEAN MEAL Futures StatisticsSPECULATORSCOMMERCIALSSMALL TRADERS
– Percent of Open Interest Longs:19.748.712.3
– Percent of Open Interest Shorts:17.756.07.1
– Net Position:9,114-32,18823,074
– Gross Longs:87,127214,80054,299
– Gross Shorts:78,013246,98831,225
– Long to Short Ratio:1.1 to 10.9 to 11.7 to 1
NET POSITION TREND:
– COT Index Score (3 Year Range Pct):34.263.663.1
– COT Index Reading (3 Year Range):BearishBullishBullish
NET POSITION MOVEMENT INDEX:
– 6-Week Change in Strength Index:-6.32.028.6


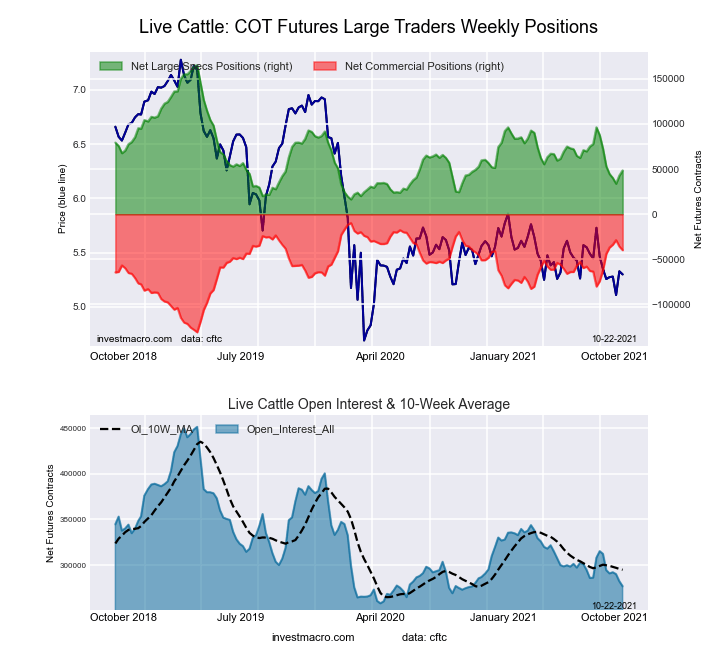
LIVE CATTLE Futures:

Ultra US Year Treasury Notes Long Bonds Futures COT ChartThe LIVE CATTLE large speculator standing this week resulted in a net position of 48,491 contracts in the data reported through Tuesday. This was a weekly gain of 5,702 contracts from the previous week which had a total of 42,789 net contracts.

This week’s current strength score (the trader positioning range over the past three years, measured from 0 to 100) shows the speculators are currently Bearish with a score of 21.6 percent. The commercials are Bullish with a score of 75.2 percent and the small traders (not shown in chart) are Bullish with a score of 66.0 percent.

LIVE CATTLE Futures StatisticsSPECULATORSCOMMERCIALSSMALL TRADERS
– Percent of Open Interest Longs:34.243.310.1
– Percent of Open Interest Shorts:16.757.713.3
– Net Position:48,491-39,825-8,666
– Gross Longs:94,585119,92828,083
– Gross Shorts:46,094159,75336,749
– Long to Short Ratio:2.1 to 10.8 to 10.8 to 1
NET POSITION TREND:
– COT Index Score (3 Year Range Pct):21.675.266.0
– COT Index Reading (3 Year Range):BearishBullishBullish
NET POSITION MOVEMENT INDEX:
– 6-Week Change in Strength Index:-16.118.44.3


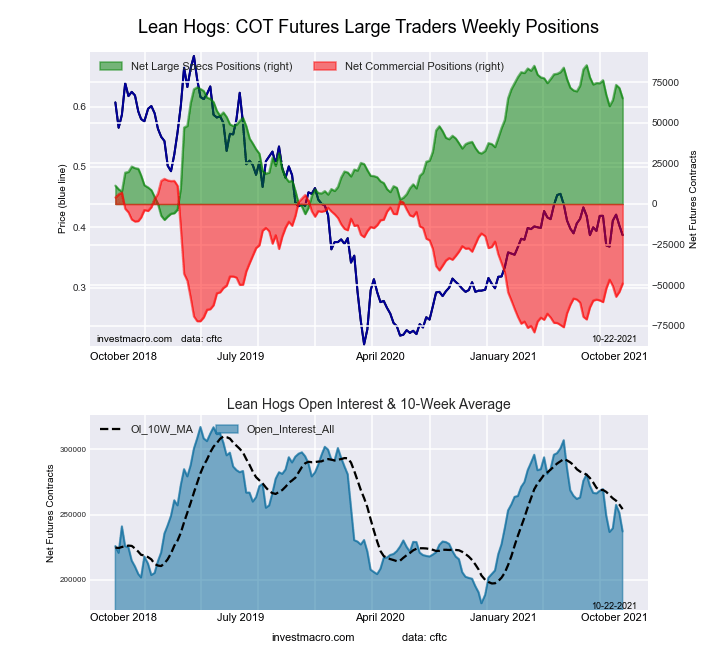
LEAN HOGS Futures:

Eurodollar Bonds Futures COT ChartThe LEAN HOGS large speculator standing this week resulted in a net position of 65,182 contracts in the data reported through Tuesday. This was a weekly decrease of -6,362 contracts from the previous week which had a total of 71,544 net contracts.

This week’s current strength score (the trader positioning range over the past three years, measured from 0 to 100) shows the speculators are currently Bullish with a score of 78.6 percent. The commercials are Bearish with a score of 31.8 percent and the small traders (not shown in chart) are Bearish-Extreme with a score of 5.8 percent.

LEAN HOGS Futures StatisticsSPECULATORSCOMMERCIALSSMALL TRADERS
– Percent of Open Interest Longs:41.831.77.4
– Percent of Open Interest Shorts:14.352.414.2
– Net Position:65,182-49,056-16,126
– Gross Longs:99,07175,28517,573
– Gross Shorts:33,889124,34133,699
– Long to Short Ratio:2.9 to 10.6 to 10.5 to 1
NET POSITION TREND:
– COT Index Score (3 Year Range Pct):78.631.85.8
– COT Index Reading (3 Year Range):BullishBearishBearish-Extreme
NET POSITION MOVEMENT INDEX:
– 6-Week Change in Strength Index:-11.712.1-1.0


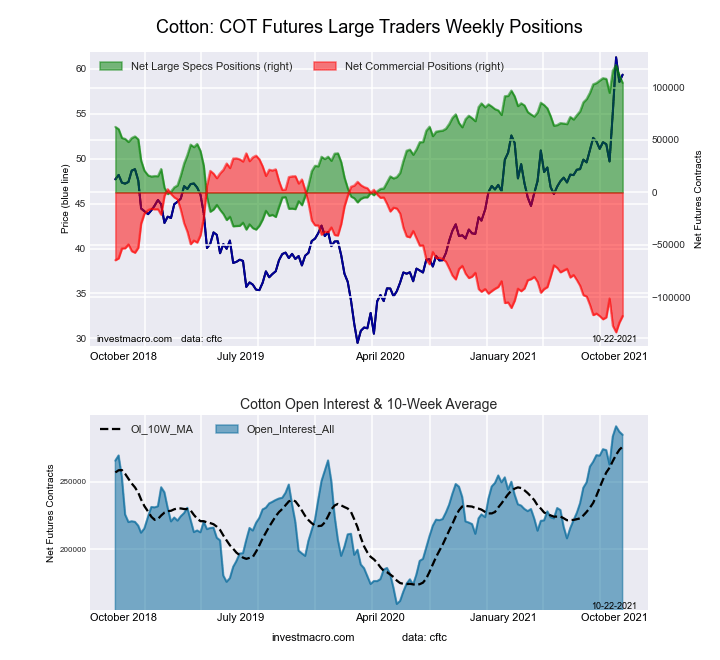
COTTON Futures:

Ultra 10-Year Treasury Notes Bonds Futures COT ChartThe COTTON large speculator standing this week resulted in a net position of 104,423 contracts in the data reported through Tuesday. This was a weekly decrease of -6,968 contracts from the previous week which had a total of 111,391 net contracts.

This week’s current strength score (the trader positioning range over the past three years, measured from 0 to 100) shows the speculators are currently Bullish-Extreme with a score of 89.2 percent. The commercials are Bearish-Extreme with a score of 9.1 percent and the small traders (not shown in chart) are Bullish-Extreme with a score of 96.9 percent.

COTTON Futures StatisticsSPECULATORSCOMMERCIALSSMALL TRADERS
– Percent of Open Interest Longs:40.937.97.9
– Percent of Open Interest Shorts:4.279.33.2
– Net Position:104,423-117,78113,358
– Gross Longs:116,323107,84422,504
– Gross Shorts:11,900225,6259,146
– Long to Short Ratio:9.8 to 10.5 to 12.5 to 1
NET POSITION TREND:
– COT Index Score (3 Year Range Pct):89.29.196.9
– COT Index Reading (3 Year Range):Bullish-ExtremeBearish-ExtremeBullish-Extreme
NET POSITION MOVEMENT INDEX:
– 6-Week Change in Strength Index:-2.91.88.8


COCOA Futures:

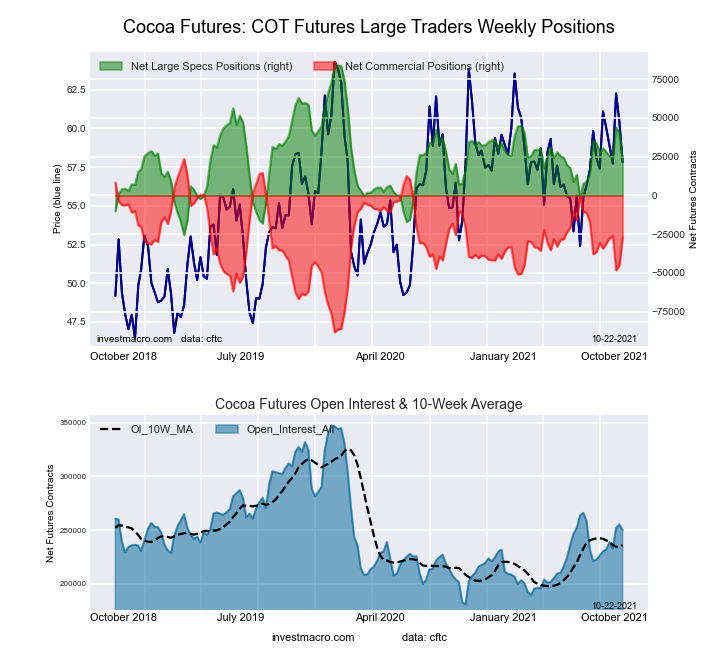
US Year Treasury Notes Long Bonds Futures COT ChartThe COCOA large speculator standing this week resulted in a net position of 22,821 contracts in the data reported through Tuesday. This was a weekly lowering of -17,400 contracts from the previous week which had a total of 40,221 net contracts.

This week’s current strength score (the trader positioning range over the past three years, measured from 0 to 100) shows the speculators are currently Bearish with a score of 44.1 percent. The commercials are Bullish with a score of 54.7 percent and the small traders (not shown in chart) are Bullish with a score of 56.9 percent.

COCOA Futures StatisticsSPECULATORSCOMMERCIALSSMALL TRADERS
– Percent of Open Interest Longs:27.049.84.8
– Percent of Open Interest Shorts:17.960.63.1
– Net Position:22,821-27,0774,256
– Gross Longs:67,550124,42711,933
– Gross Shorts:44,729151,5047,677
– Long to Short Ratio:1.5 to 10.8 to 11.6 to 1
NET POSITION TREND:
– COT Index Score (3 Year Range Pct):44.154.756.9
– COT Index Reading (3 Year Range):BearishBullishBullish
NET POSITION MOVEMENT INDEX:
– 6-Week Change in Strength Index:-7.06.53.7


WHEAT Futures:

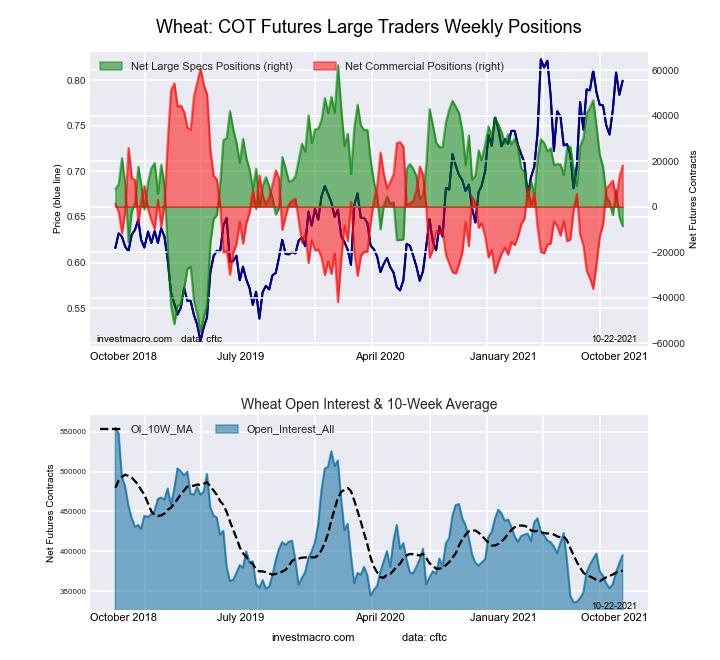
Ultra US Year Treasury Notes Long Bonds Futures COT ChartThe WHEAT large speculator standing this week resulted in a net position of -8,566 contracts in the data reported through Tuesday. This was a weekly reduction of -4,032 contracts from the previous week which had a total of -4,534 net contracts.

This week’s current strength score (the trader positioning range over the past three years, measured from 0 to 100) shows the speculators are currently Bearish with a score of 39.7 percent. The commercials are Bullish with a score of 58.5 percent and the small traders (not shown in chart) are Bullish with a score of 55.7 percent.

WHEAT Futures StatisticsSPECULATORSCOMMERCIALSSMALL TRADERS
– Percent of Open Interest Longs:24.741.07.9
– Percent of Open Interest Shorts:26.936.410.3
– Net Position:-8,56618,180-9,614
– Gross Longs:97,532162,05231,200
– Gross Shorts:106,098143,87240,814
– Long to Short Ratio:0.9 to 11.1 to 10.8 to 1
NET POSITION TREND:
– COT Index Score (3 Year Range Pct):39.758.555.7
– COT Index Reading (3 Year Range):BearishBullishBullish
NET POSITION MOVEMENT INDEX:
– 6-Week Change in Strength Index:-22.225.30.5


Article By InvestMacro.comReceive our weekly COT Reports by Email

*COT Report: The COT data, released weekly to the public each Friday, is updated through the most recent Tuesday (data is 3 days old) and shows a quick view of how large speculators or non-commercials (for-profit traders) were positioned in the futures markets.

The CFTC categorizes trader positions according to commercial hedgers (traders who use futures contracts for hedging as part of the business), non-commercials (large traders who speculate to realize trading profits) and nonreportable traders (usually small traders/speculators).

Find CFTC criteria here: (http://www.cftc.gov/MarketReports/CommitmentsofTraders/ExplanatoryNotes/index.htm).
COT Metals Charts: Copper Speculator bullish bets jump by most in 97-weeks

By InvestMacro.com COT Home | Data Tables | Data Downloads | COT Newsletter

Here are the latest charts and statistics for the Commitment of Traders (COT) data published by the Commodities Futures Trading Commission (CFTC).

The latest COT data is updated through Tuesday October 19th 2021 and shows a quick view of how large traders (for-profit speculators and commercial entities) were positioned in the futures markets.

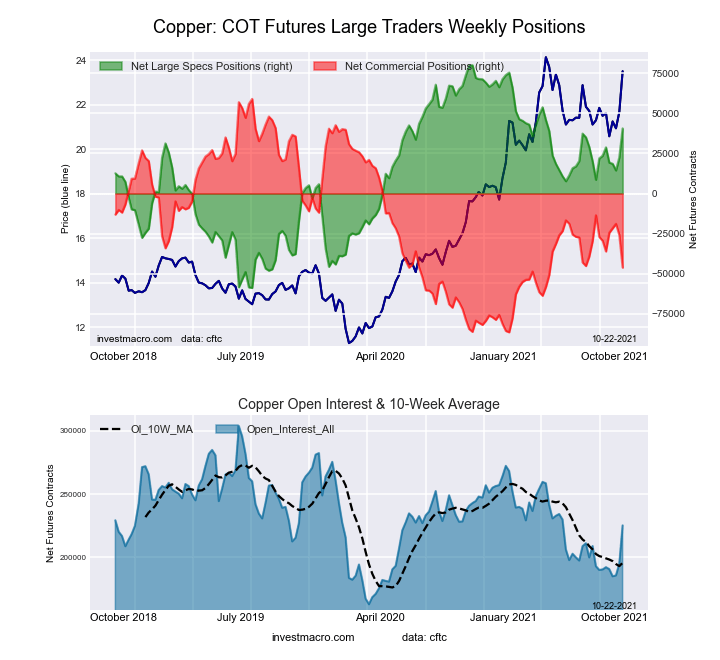
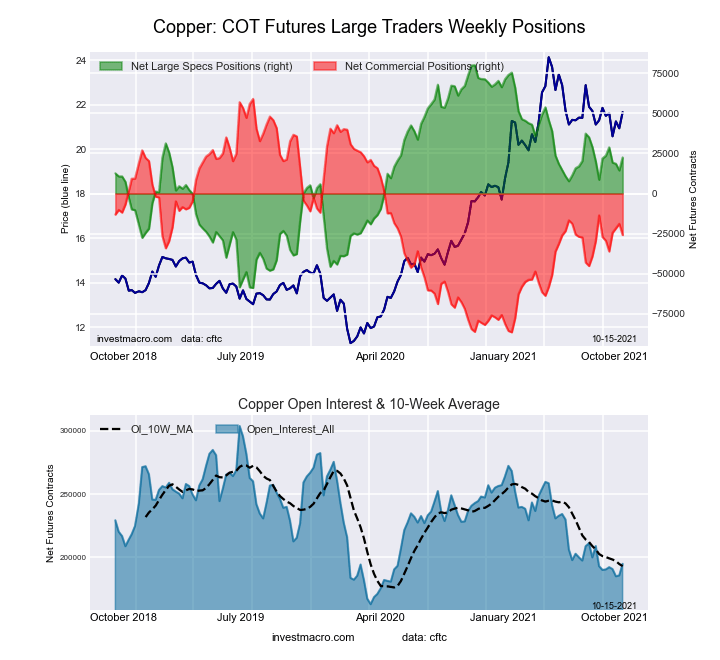
Highlighting this week’s COT Metals data was a surge in speculator’s Copper bullish bets which jumped by over +18,000 net contracts. Copper speculative positions rose by the largest one-week amount in the past ninety-seven weeks, dating all the way back to December 10th of 2017 when bullish bets increased by +20,559 contracts. This week’s positive sentiment has pushed the current speculator bullish positioning to a total of +40,584 contracts and its highest standing since May 11th, a span of twenty-three weeks. Overall, Copper speculator bets have now remained in bullish territory for seventy-two straight weeks since turning bullish on June 9th of 2020.


Data Snapshot of Commodity Market Traders | Columns Legend
Oct-19-2021OIOI-IndexSpec-NetSpec-IndexCom-NetCOM-IndexSmalls-NetSmalls-Index
WTI Crude2,205,08944429,59449-473,1814143,58776
Gold485,97422193,34956-219,1904325,84143
Silver143,6641030,35653-44,5805514,22423
Copper225,2254440,58472-46,208285,62458
Palladium9,06112-2,41652,355936148
Platinum58,5701914,84424-21,176796,33250
Natural Gas1,318,49848-131,0703986,5745844,49692
Brent202,71441-28,0187323,413234,60576
Heating Oil415,5565626,44181-50,2501823,80981
Soybeans750,9393343,54141-9,57564-33,96615
Corn1,404,1265277,02965-218,17241-58,8579
Coffee304,8746268,88999-73,10034,21117
Sugar871,31621211,55080-243,5642232,01447
Wheat394,94927-8,5664018,18059-9,61456


Gold Comex Futures:

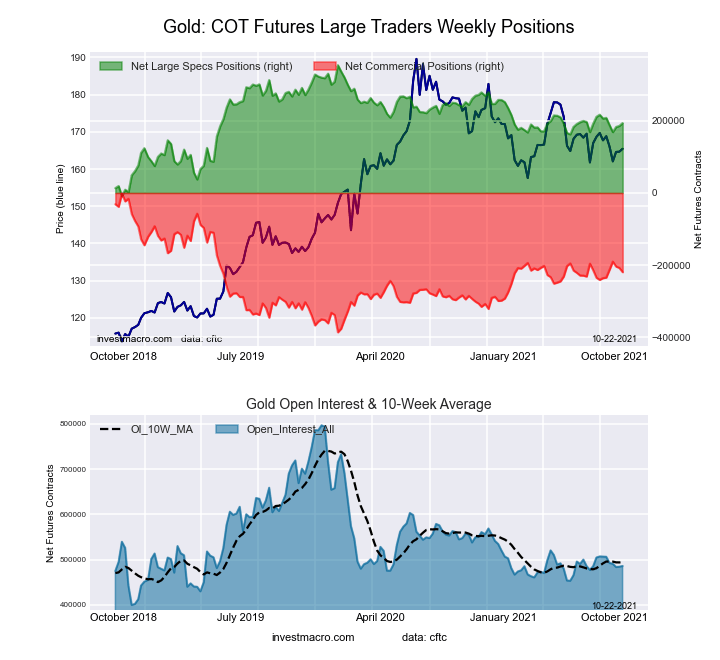
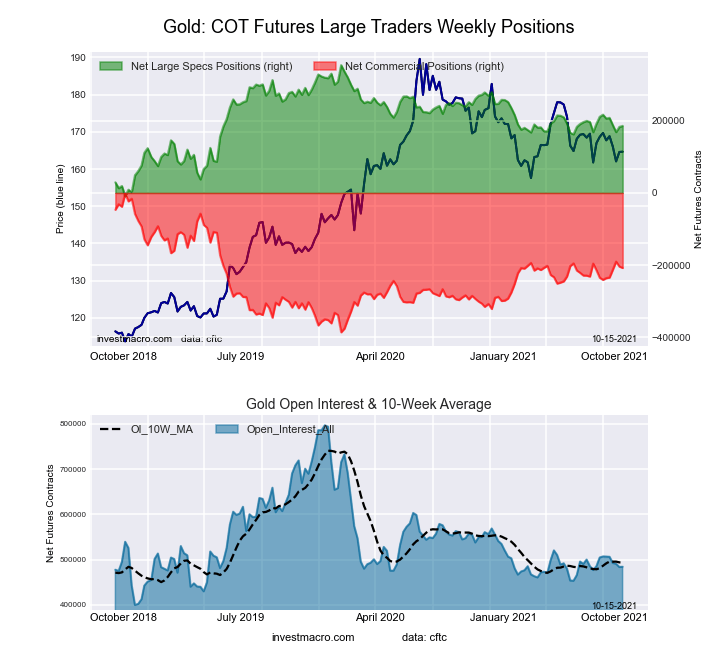
Federal Funds 30-Day Bonds Futures COT ChartThe Gold Comex Futures large speculator standing this week was a net position of 193,349 contracts in the data reported through Tuesday. This was a weekly gain of 7,810 contracts from the previous week which had a total of 185,539 net contracts.

This week’s current strength score (the trader positioning range over the past three years, measured from 0 to 100) shows the speculators are currently Bullish with a score of 55.8 percent. The commercials are Bearish with a score of 43.4 percent and the small traders (not shown in chart) are Bearish with a score of 43.0 percent.

Gold Futures StatisticsSPECULATORSCOMMERCIALSSMALL TRADERS
– Percent of Open Interest Longs:61.722.09.5
– Percent of Open Interest Shorts:21.967.14.2
– Net Position:193,349-219,19025,841
– Gross Longs:299,882107,12846,194
– Gross Shorts:106,533326,31820,353
– Long to Short Ratio:2.8 to 10.3 to 12.3 to 1
NET POSITION TREND:
– COT Index Score (3 Year Range Pct):55.843.443.0
– COT Index Reading (3 Year Range):BullishBearishBearish
NET POSITION MOVEMENT INDEX:
– 6-Week Change in Strength Index:-3.54.3-10.2


Silver Comex Futures:

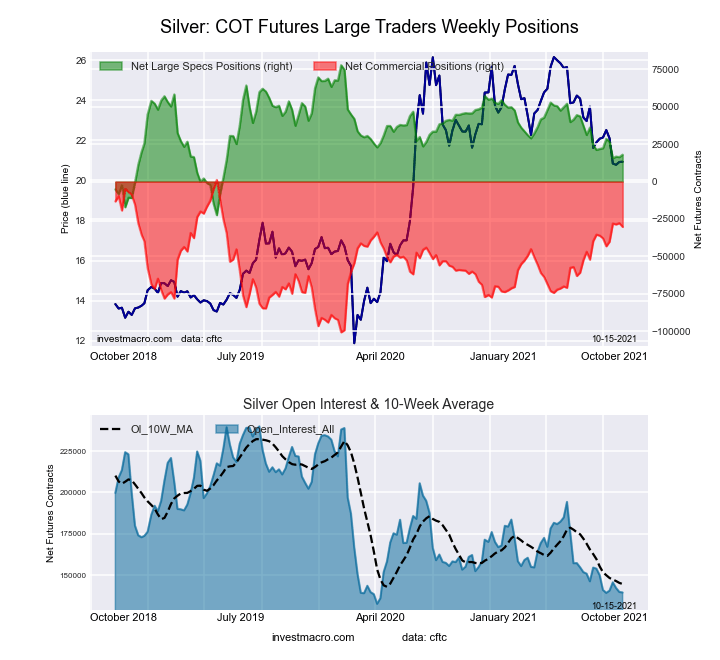
2-Year Treasury Bonds Futures COT ChartThe Silver Comex Futures large speculator standing this week was a net position of 30,356 contracts in the data reported through Tuesday. This was a weekly rise of 12,369 contracts from the previous week which had a total of 17,987 net contracts.

This week’s current strength score (the trader positioning range over the past three years, measured from 0 to 100) shows the speculators are currently Bullish with a score of 52.6 percent. The commercials are Bullish with a score of 55.2 percent and the small traders (not shown in chart) are Bearish with a score of 23.0 percent.

Silver Futures StatisticsSPECULATORSCOMMERCIALSSMALL TRADERS
– Percent of Open Interest Longs:46.328.218.9
– Percent of Open Interest Shorts:25.259.39.0
– Net Position:30,356-44,58014,224
– Gross Longs:66,57240,55627,203
– Gross Shorts:36,21685,13612,979
– Long to Short Ratio:1.8 to 10.5 to 12.1 to 1
NET POSITION TREND:
– COT Index Score (3 Year Range Pct):52.655.223.0
– COT Index Reading (3 Year Range):BullishBullishBearish
NET POSITION MOVEMENT INDEX:
– 6-Week Change in Strength Index:1.8-1.3-2.8


Copper Grade #1 Futures:

5-Year Treasury Bonds Futures COT ChartThe Copper Grade #1 Futures large speculator standing this week was a net position of 40,584 contracts in the data reported through Tuesday. This was a weekly advance of 18,103 contracts from the previous week which had a total of 22,481 net contracts.

This week’s current strength score (the trader positioning range over the past three years, measured from 0 to 100) shows the speculators are currently Bullish with a score of 71.6 percent. The commercials are Bearish with a score of 27.7 percent and the small traders (not shown in chart) are Bullish with a score of 57.8 percent.

Copper Futures StatisticsSPECULATORSCOMMERCIALSSMALL TRADERS
– Percent of Open Interest Longs:46.035.18.5
– Percent of Open Interest Shorts:27.955.66.0
– Net Position:40,584-46,2085,624
– Gross Longs:103,49679,08019,249
– Gross Shorts:62,912125,28813,625
– Long to Short Ratio:1.6 to 10.6 to 11.4 to 1
NET POSITION TREND:
– COT Index Score (3 Year Range Pct):71.627.757.8
– COT Index Reading (3 Year Range):BullishBearishBullish
NET POSITION MOVEMENT INDEX:
– 6-Week Change in Strength Index:12.2-11.5-1.4


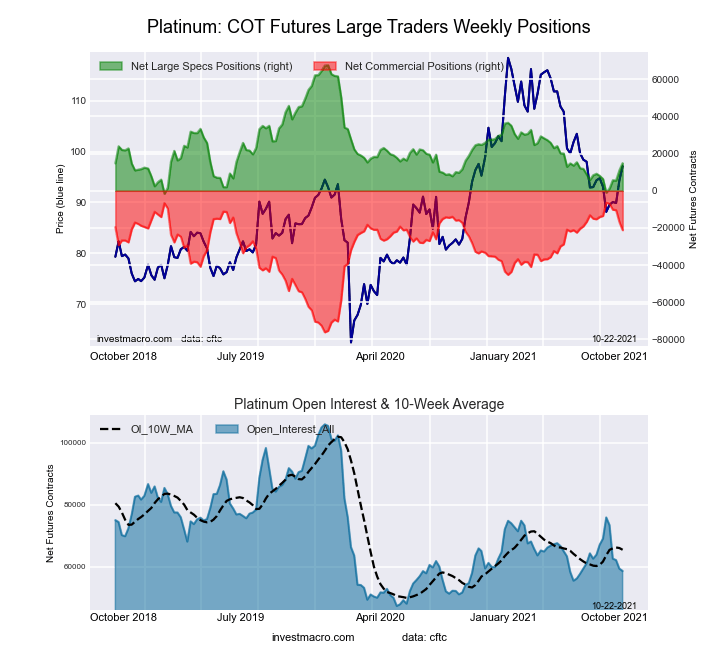
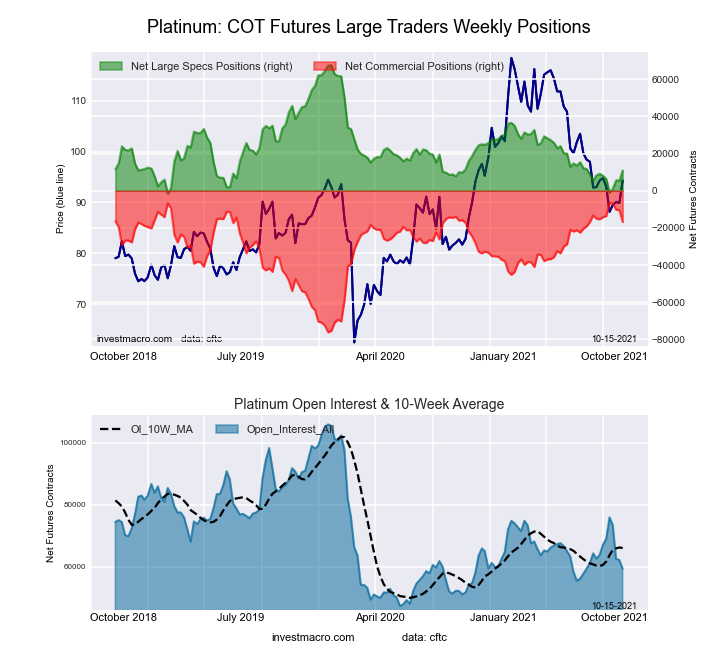
Platinum Futures:

10-Year Treasury Notes Bonds Futures COT ChartThe Platinum Futures large speculator standing this week was a net position of 14,844 contracts in the data reported through Tuesday. This was a weekly lift of 3,925 contracts from the previous week which had a total of 10,919 net contracts.

This week’s current strength score (the trader positioning range over the past three years, measured from 0 to 100) shows the speculators are currently Bearish with a score of 23.8 percent. The commercials are Bullish with a score of 78.8 percent and the small traders (not shown in chart) are Bullish with a score of 50.4 percent.

Platinum Futures StatisticsSPECULATORSCOMMERCIALSSMALL TRADERS
– Percent of Open Interest Longs:52.827.915.8
– Percent of Open Interest Shorts:27.464.15.0
– Net Position:14,844-21,1766,332
– Gross Longs:30,91716,3469,238
– Gross Shorts:16,07337,5222,906
– Long to Short Ratio:1.9 to 10.4 to 13.2 to 1
NET POSITION TREND:
– COT Index Score (3 Year Range Pct):23.878.850.4
– COT Index Reading (3 Year Range):BearishBullishBullish
NET POSITION MOVEMENT INDEX:
– 6-Week Change in Strength Index:12.3-11.0-11.5


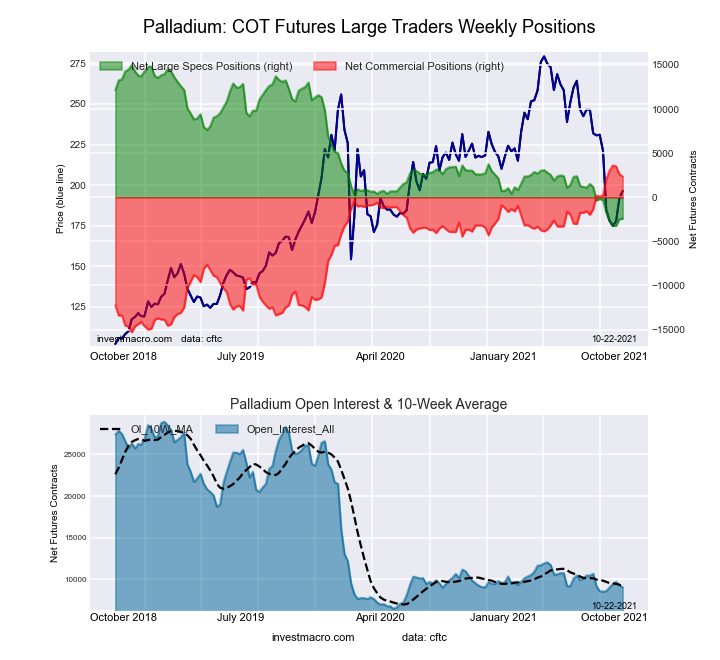
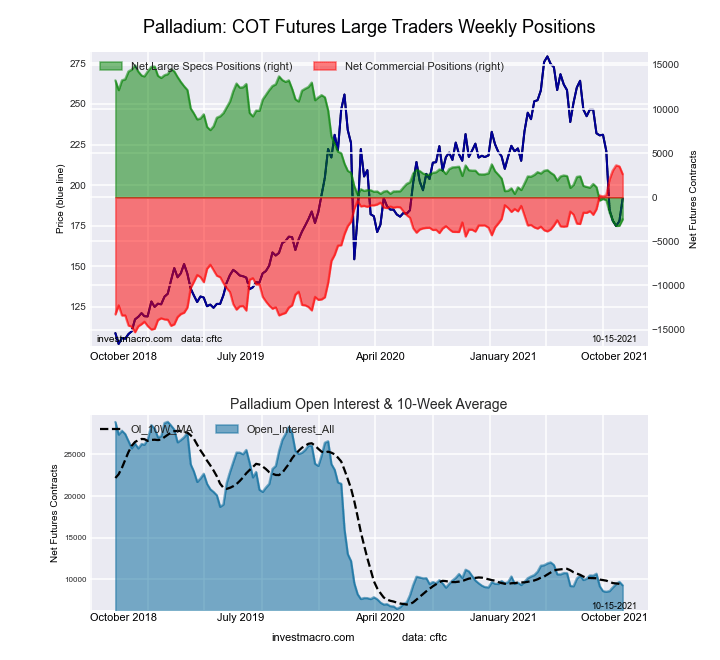
Palladium Futures:

Ultra 10-Year Treasury Notes Bonds Futures COT ChartThe Palladium Futures large speculator standing this week was a net position of -2,416 contracts in the data reported through Tuesday. This was a weekly advance of 80 contracts from the previous week which had a total of -2,496 net contracts.

This week’s current strength score (the trader positioning range over the past three years, measured from 0 to 100) shows the speculators are currently Bearish-Extreme with a score of 4.6 percent. The commercials are Bullish-Extreme with a score of 93.3 percent and the small traders (not shown in chart) are Bearish with a score of 48.2 percent.

Palladium Futures StatisticsSPECULATORSCOMMERCIALSSMALL TRADERS
– Percent of Open Interest Longs:31.849.815.1
– Percent of Open Interest Shorts:58.523.814.5
– Net Position:-2,4162,35561
– Gross Longs:2,8824,5151,372
– Gross Shorts:5,2982,1601,311
– Long to Short Ratio:0.5 to 12.1 to 11.0 to 1
NET POSITION TREND:
– COT Index Score (3 Year Range Pct):4.693.348.2
– COT Index Reading (3 Year Range):Bearish-ExtremeBullish-ExtremeBearish
NET POSITION MOVEMENT INDEX:
– 6-Week Change in Strength Index:-11.411.2-2.2


Article By InvestMacro.comReceive our weekly COT Reports by Email

*COT Report: The COT data, released weekly to the public each Friday, is updated through the most recent Tuesday (data is 3 days old) and shows a quick view of how large speculators or non-commercials (for-profit traders) were positioned in the futures markets.

The CFTC categorizes trader positions according to commercial hedgers (traders who use futures contracts for hedging as part of the business), non-commercials (large traders who speculate to realize trading profits) and nonreportable traders (usually small traders/speculators).

Find CFTC criteria here: (http://www.cftc.gov/MarketReports/CommitmentsofTraders/ExplanatoryNotes/index.htm).
COT Energy Charts: WTI Crude Oil Speculator bets rise for 6th week

By InvestMacro.com COT Home | Data Tables | Data Downloads | Newsletter

Here are the latest charts and statistics for the Commitment of Traders (COT) data published by the Commodities Futures Trading Commission (CFTC).

The latest COT data is updated through Tuesday October 19th 2021 and shows a quick view of how large traders (for-profit speculators and commercial entities) were positioned in the futures markets.

Highlighting this week’s COT Energy data is the speculator’s WTI Crude Oil bullish bets which have now gained for six straight weeks. WTI crude speculator wagers have risen by a total of +80,436 contracts over that time-frame and has pushed the current bullish standing to an eleven week high-point. The WTI futures price has surged recently to the highest level since 2014 due to many factors including fears over supply combined with more demand.


Data Snapshot of Commodity Market Traders | Columns Legend
Oct-19-2021OIOI-IndexSpec-NetSpec-IndexCom-NetCOM-IndexSmalls-NetSmalls-Index
WTI Crude2,205,08944429,59449-473,1814143,58776
Gold485,97422193,34956-219,1904325,84143
Silver143,6641030,35653-44,5805514,22423
Copper225,2254440,58472-46,208285,62458
Palladium9,06112-2,41652,355936148
Platinum58,5701914,84424-21,176796,33250
Natural Gas1,318,49848-131,0703986,5745844,49692
Brent202,71441-28,0187323,413234,60576
Heating Oil415,5565626,44181-50,2501823,80981
Soybeans750,9393343,54141-9,57564-33,96615
Corn1,404,1265277,02965-218,17241-58,8579
Coffee304,8746268,88999-73,10034,21117
Sugar871,31621211,55080-243,5642232,01447
Wheat394,94927-8,5664018,18059-9,61456


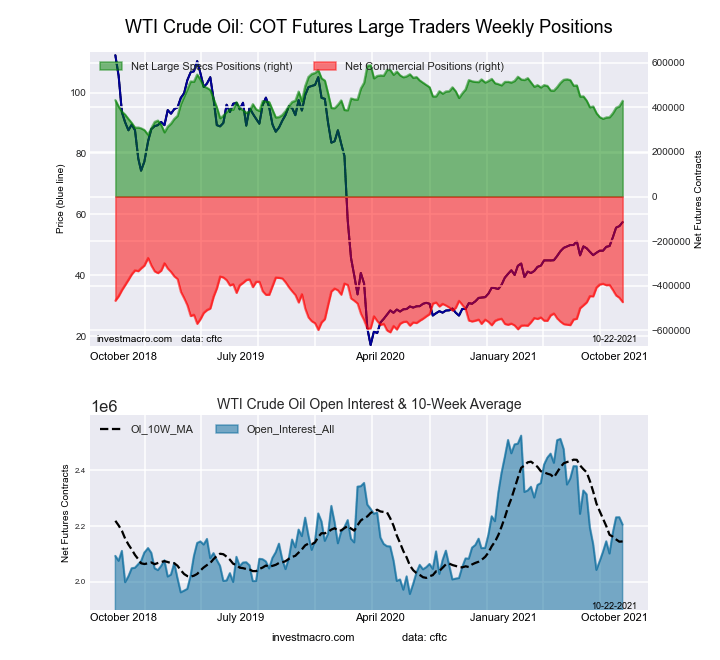
WTI Crude Oil Futures:

WTI Crude Oil Futures COT ChartThe WTI Crude Oil Futures large speculator standing this week resulted in a net position of 429,594 contracts in the data reported through Tuesday. This was a weekly boost of 24,818 contracts from the previous week which had a total of 404,776 net contracts.

This week’s current strength score (the trader positioning range over the past three years, measured from 0 to 100) shows the speculators are currently Bearish with a score of 48.8 percent. The commercials are Bearish with a score of 40.6 percent and the small traders (not shown in chart) are Bullish with a score of 76.4 percent.

WTI Crude Oil Futures StatisticsSPECULATORSCOMMERCIALSSMALL TRADERS
– Percent of Open Interest Longs:25.731.74.4
– Percent of Open Interest Shorts:6.253.22.5
– Net Position:429,594-473,18143,587
– Gross Longs:565,720698,99297,623
– Gross Shorts:136,1261,172,17354,036
– Long to Short Ratio:4.2 to 10.6 to 11.8 to 1
NET POSITION TREND:
– COT Index Score (3 Year Range Pct):48.840.676.4
– COT Index Reading (3 Year Range):BearishBearishBullish
NET POSITION MOVEMENT INDEX:
– 6-Week Change in Strength Index:25.8-24.62.1


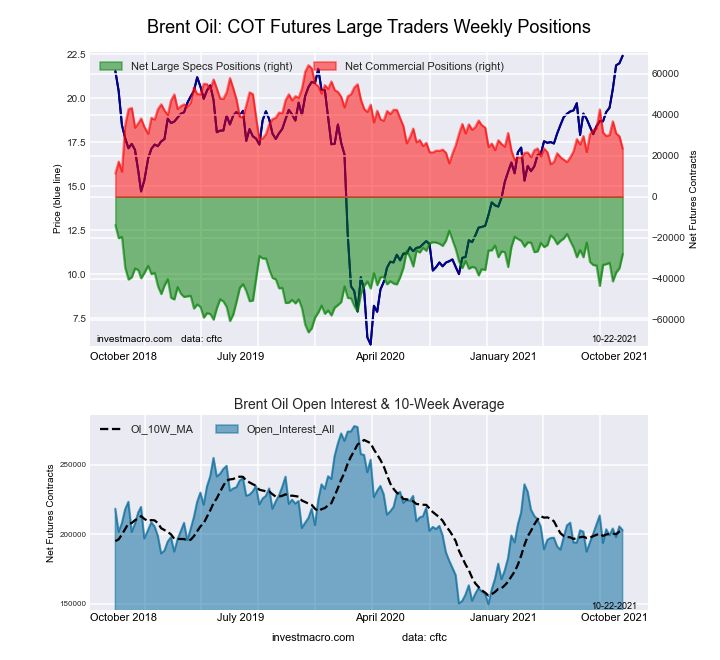
Brent Crude Oil Futures:

Brent Last Day Crude Oil Futures COT ChartThe Brent Crude Oil Futures large speculator standing this week resulted in a net position of -28,018 contracts in the data reported through Tuesday. This was a weekly advance of 6,906 contracts from the previous week which had a total of -34,924 net contracts.

This week’s current strength score (the trader positioning range over the past three years, measured from 0 to 100) shows the speculators are currently Bullish with a score of 73.0 percent. The commercials are Bearish with a score of 22.9 percent and the small traders (not shown in chart) are Bullish with a score of 75.8 percent.

Brent Crude Oil Futures StatisticsSPECULATORSCOMMERCIALSSMALL TRADERS
– Percent of Open Interest Longs:16.946.55.0
– Percent of Open Interest Shorts:30.735.02.7
– Net Position:-28,01823,4134,605
– Gross Longs:34,30394,28710,045
– Gross Shorts:62,32170,8745,440
– Long to Short Ratio:0.6 to 11.3 to 11.8 to 1
NET POSITION TREND:
– COT Index Score (3 Year Range Pct):73.022.975.8
– COT Index Reading (3 Year Range):BullishBearishBullish
NET POSITION MOVEMENT INDEX:
– 6-Week Change in Strength Index:10.0-14.923.2


Natural Gas Futures:

Natural Gas Futures COT ChartThe Natural Gas Futures large speculator standing this week resulted in a net position of -131,070 contracts in the data reported through Tuesday. This was a weekly lowering of -168 contracts from the previous week which had a total of -130,902 net contracts.

This week’s current strength score (the trader positioning range over the past three years, measured from 0 to 100) shows the speculators are currently Bearish with a score of 39.2 percent. The commercials are Bullish with a score of 58.2 percent and the small traders (not shown in chart) are Bullish-Extreme with a score of 91.6 percent.

Natural Gas Futures StatisticsSPECULATORSCOMMERCIALSSMALL TRADERS
– Percent of Open Interest Longs:20.343.65.2
– Percent of Open Interest Shorts:30.337.11.8
– Net Position:-131,07086,57444,496
– Gross Longs:268,031575,42568,020
– Gross Shorts:399,101488,85123,524
– Long to Short Ratio:0.7 to 11.2 to 12.9 to 1
NET POSITION TREND:
– COT Index Score (3 Year Range Pct):39.258.291.6
– COT Index Reading (3 Year Range):BearishBullishBullish-Extreme
NET POSITION MOVEMENT INDEX:
– 6-Week Change in Strength Index:-3.3-8.091.6


Gasoline Blendstock Futures:

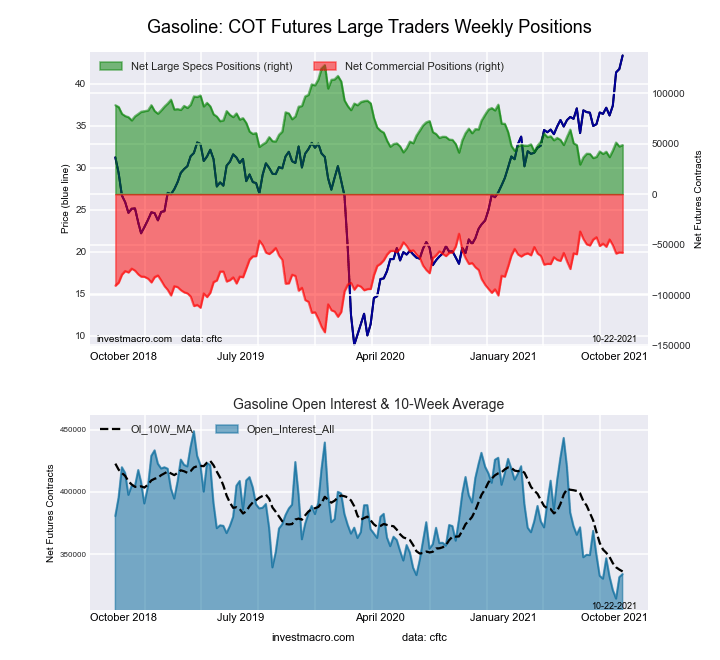
RBOB Gasoline Energy Futures COT ChartThe Gasoline Blendstock Futures large speculator standing this week resulted in a net position of 48,642 contracts in the data reported through Tuesday. This was a weekly rise of 1,449 contracts from the previous week which had a total of 47,193 net contracts.

This week’s current strength score (the trader positioning range over the past three years, measured from 0 to 100) shows the speculators are currently Bearish-Extreme with a score of 19.6 percent. The commercials are Bullish with a score of 79.0 percent and the small traders (not shown in chart) are Bullish with a score of 67.6 percent.

Nasdaq Mini Futures StatisticsSPECULATORSCOMMERCIALSSMALL TRADERS
– Percent of Open Interest Longs:30.746.07.1
– Percent of Open Interest Shorts:16.263.44.3
– Net Position:48,642-58,0219,379
– Gross Longs:102,687153,55423,616
– Gross Shorts:54,045211,57514,237
– Long to Short Ratio:1.9 to 10.7 to 11.7 to 1
NET POSITION TREND:
– COT Index Score (3 Year Range Pct):19.679.067.6
– COT Index Reading (3 Year Range):Bearish-ExtremeBullishBullish
NET POSITION MOVEMENT INDEX:
– 6-Week Change in Strength Index:8.9-9.01.2


#2 Heating Oil NY-Harbor Futures:

NY Harbor Heating Oil Energy Futures COT ChartThe #2 Heating Oil NY-Harbor Futures large speculator standing this week resulted in a net position of 26,441 contracts in the data reported through Tuesday. This was a weekly lowering of -12,696 contracts from the previous week which had a total of 39,137 net contracts.

This week’s current strength score (the trader positioning range over the past three years, measured from 0 to 100) shows the speculators are currently Bullish-Extreme with a score of 81.3 percent. The commercials are Bearish-Extreme with a score of 17.7 percent and the small traders (not shown in chart) are Bullish-Extreme with a score of 80.8 percent.

Heating Oil Futures StatisticsSPECULATORSCOMMERCIALSSMALL TRADERS
– Percent of Open Interest Longs:16.549.711.3
– Percent of Open Interest Shorts:10.161.85.6
– Net Position:26,441-50,25023,809
– Gross Longs:68,516206,62846,898
– Gross Shorts:42,075256,87823,089
– Long to Short Ratio:1.6 to 10.8 to 12.0 to 1
NET POSITION TREND:
– COT Index Score (3 Year Range Pct):81.317.780.8
– COT Index Reading (3 Year Range):Bullish-ExtremeBearish-ExtremeBullish-Extreme
NET POSITION MOVEMENT INDEX:
– 6-Week Change in Strength Index:-16.59.28.8


Bloomberg Commodity Index Futures:

Bloomberg Commodity Index Futures COT ChartThe Bloomberg Commodity Index Futures large speculator standing this week resulted in a net position of -16,527 contracts in the data reported through Tuesday. This was a weekly reduction of -410 contracts from the previous week which had a total of -16,117 net contracts.

This week’s current strength score (the trader positioning range over the past three years, measured from 0 to 100) shows the speculators are currently Bearish with a score of 24.2 percent. The commercials are Bullish with a score of 75.3 percent and the small traders (not shown in chart) are Bearish with a score of 47.8 percent.

Bloomberg Index Futures StatisticsSPECULATORSCOMMERCIALSSMALL TRADERS
– Percent of Open Interest Longs:51.543.11.4
– Percent of Open Interest Shorts:91.04.80.1
– Net Position:-16,52715,992535
– Gross Longs:21,50618,008593
– Gross Shorts:38,0332,01658
– Long to Short Ratio:0.6 to 18.9 to 110.2 to 1
NET POSITION TREND:
– COT Index Score (3 Year Range Pct):24.275.347.8
– COT Index Reading (3 Year Range):BearishBullishBearish
NET POSITION MOVEMENT INDEX:
– 6-Week Change in Strength Index:-8.78.55.2


Article By InvestMacro.comReceive our weekly COT Reports by Email

*COT Report: The COT data, released weekly to the public each Friday, is updated through the most recent Tuesday (data is 3 days old) and shows a quick view of how large speculators or non-commercials (for-profit traders) were positioned in the futures markets.

The CFTC categorizes trader positions according to commercial hedgers (traders who use futures contracts for hedging as part of the business), non-commercials (large traders who speculate to realize trading profits) and nonreportable traders (usually small traders/speculators).

Find CFTC criteria here: (http://www.cftc.gov/MarketReports/CommitmentsofTraders/ExplanatoryNotes/index.htm).
COT Bonds Futures Charts: Treasury Notes, Fed Funds, 10-Year, 2-Year, 5-Year Treasury Notes, Eurodollars

By InvestMacro.com COT Home | Data Tables | Data Downloads | Newsletter

Here are the latest charts and statistics for the Commitment of Traders (COT) data published by the Commodities Futures Trading Commission (CFTC).

The latest COT data is updated through Tuesday October 19th 2021 and shows a quick view of how large traders (for-profit speculators and commercial entities) were positioned in the futures markets.


Data Snapshot of Bond Market Traders | Columns Legend
Oct-19-2021OIOI-IndexSpec-NetSpec-IndexCom-NetCOM-IndexSmalls-NetSmalls-Index
Eurodollar12,424,74763-781,200351,080,70660-299,50664
FedFunds1,217,77518-54,4843365,50368-11,01942
2-Year1,991,6898-132,95263172,59851-39,6462
Long T-Bond1,186,55348-57,5717383,73747-26,16632
10-Year4,095,30071-54475319,38860-318,8444
5-Year3,637,74128-255,21147510,37382-255,1620


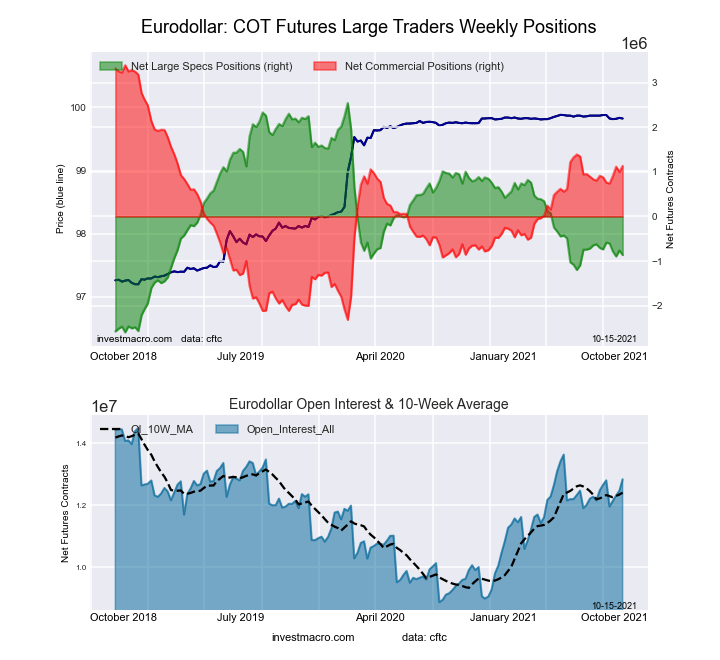
3-Month Eurodollars Futures:

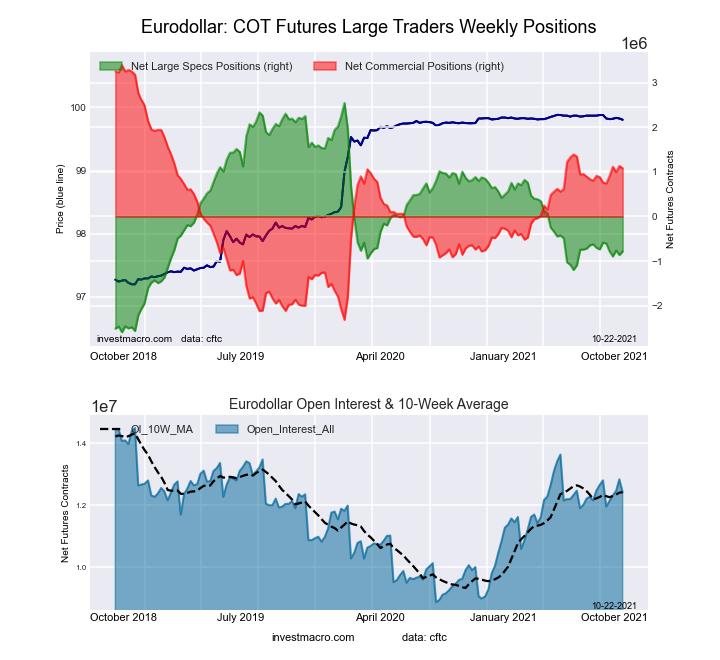
Eurodollar Bonds Futures COT ChartThe 3-Month Eurodollars large speculator standing this week resulted in a net position of -781,200 contracts in the data reported through Tuesday. This was a weekly advance of 82,400 contracts from the previous week which had a total of -863,600 net contracts.

This week’s current strength score (the trader positioning range over the past three years, measured from 0 to 100) shows the speculators are currently Bearish with a score of 35.3 percent. The commercials are Bullish with a score of 59.5 percent and the small traders (not shown in chart) are Bullish with a score of 64.0 percent.

3-Month Eurodollars StatisticsSPECULATORSCOMMERCIALSSMALL TRADERS
– Percent of Open Interest Longs:12.663.44.5
– Percent of Open Interest Shorts:18.954.76.9
– Net Position:-781,2001,080,706-299,506
– Gross Longs:1,565,3127,876,268563,787
– Gross Shorts:2,346,5126,795,562863,293
– Long to Short Ratio:0.7 to 11.2 to 10.7 to 1
NET POSITION TREND:
– COT Index Score (3 Year Range Pct):35.359.564.0
– COT Index Reading (3 Year Range):BearishBullishBullish
NET POSITION MOVEMENT INDEX:
– 6-Week Change in Strength Index:-3.85.6-16.3


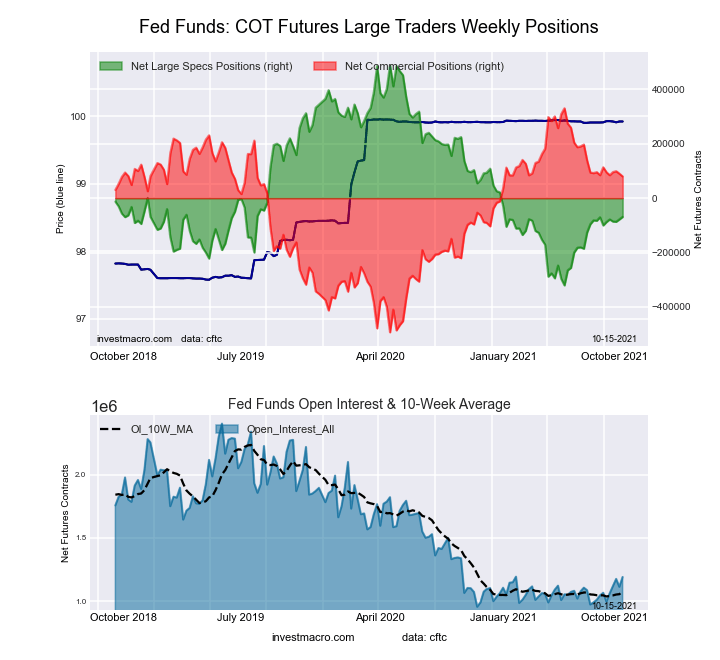
30-Day Federal Funds Futures:

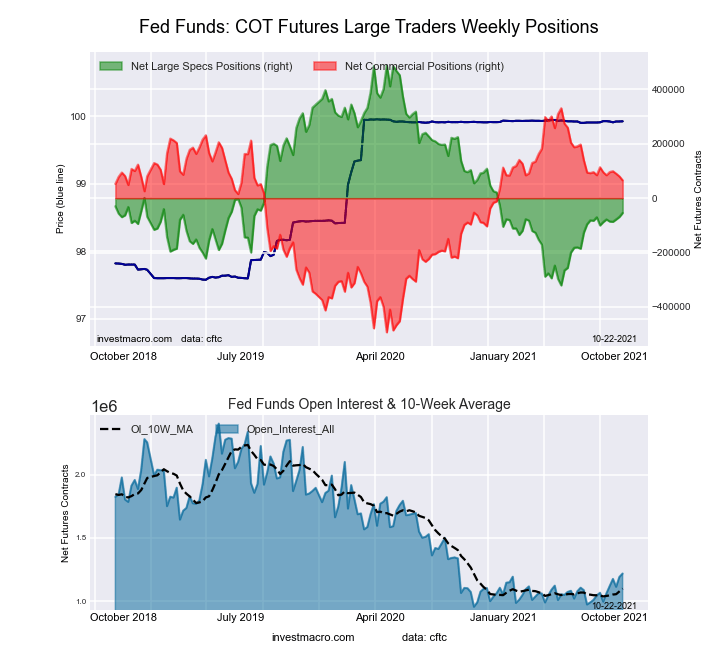
Federal Funds 30-Day Bonds Futures COT ChartThe 30-Day Federal Funds large speculator standing this week resulted in a net position of -54,484 contracts in the data reported through Tuesday. This was a weekly increase of 14,601 contracts from the previous week which had a total of -69,085 net contracts.

This week’s current strength score (the trader positioning range over the past three years, measured from 0 to 100) shows the speculators are currently Bearish with a score of 32.9 percent. The commercials are Bullish with a score of 67.8 percent and the small traders (not shown in chart) are Bearish with a score of 41.5 percent.

30-Day Federal Funds StatisticsSPECULATORSCOMMERCIALSSMALL TRADERS
– Percent of Open Interest Longs:6.177.61.6
– Percent of Open Interest Shorts:10.572.22.5
– Net Position:-54,48465,503-11,019
– Gross Longs:73,882945,17719,058
– Gross Shorts:128,366879,67430,077
– Long to Short Ratio:0.6 to 11.1 to 10.6 to 1
NET POSITION TREND:
– COT Index Score (3 Year Range Pct):32.967.841.5
– COT Index Reading (3 Year Range):BearishBullishBearish
NET POSITION MOVEMENT INDEX:
– 6-Week Change in Strength Index:4.1-3.6-8.2


2-Year Treasury Note Futures:

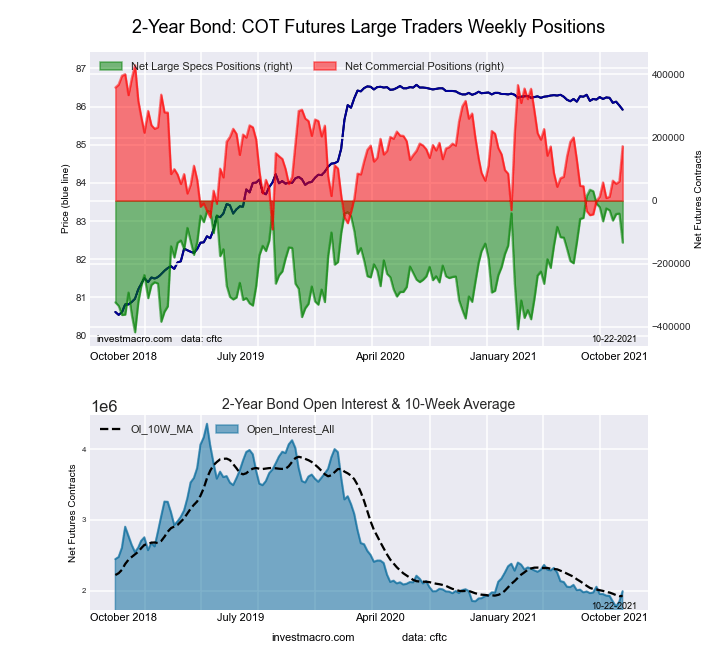
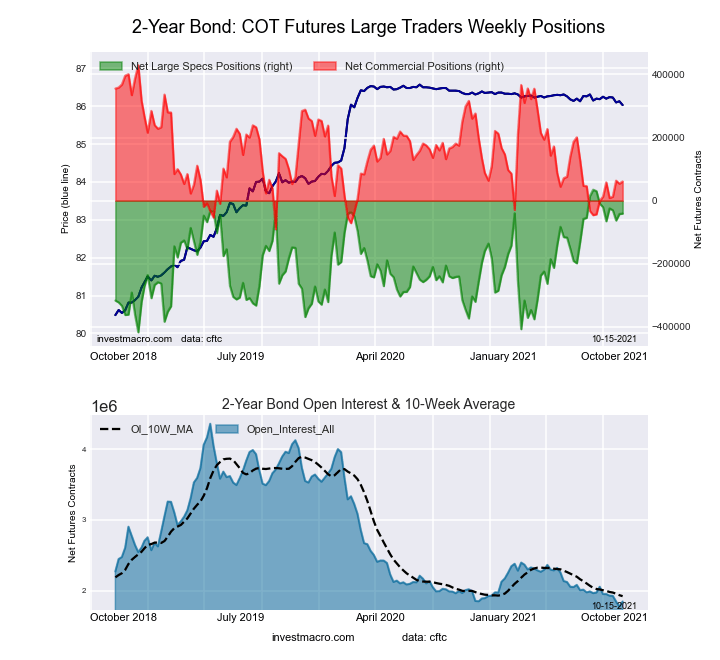
2-Year Treasury Bonds Futures COT ChartThe 2-Year Treasury Note large speculator standing this week resulted in a net position of -132,952 contracts in the data reported through Tuesday. This was a weekly decline of -92,006 contracts from the previous week which had a total of -40,946 net contracts.

This week’s current strength score (the trader positioning range over the past three years, measured from 0 to 100) shows the speculators are currently Bullish with a score of 62.9 percent. The commercials are Bullish with a score of 50.6 percent and the small traders (not shown in chart) are Bearish-Extreme with a score of 2.2 percent.

2-Year Treasury Note StatisticsSPECULATORSCOMMERCIALSSMALL TRADERS
– Percent of Open Interest Longs:17.673.66.5
– Percent of Open Interest Shorts:24.364.98.5
– Net Position:-132,952172,598-39,646
– Gross Longs:350,2931,465,365129,379
– Gross Shorts:483,2451,292,767169,025
– Long to Short Ratio:0.7 to 11.1 to 10.8 to 1
NET POSITION TREND:
– COT Index Score (3 Year Range Pct):62.950.62.2
– COT Index Reading (3 Year Range):BullishBullishBearish-Extreme
NET POSITION MOVEMENT INDEX:
– 6-Week Change in Strength Index:-15.022.1-28.3


5-Year Treasury Note Futures:

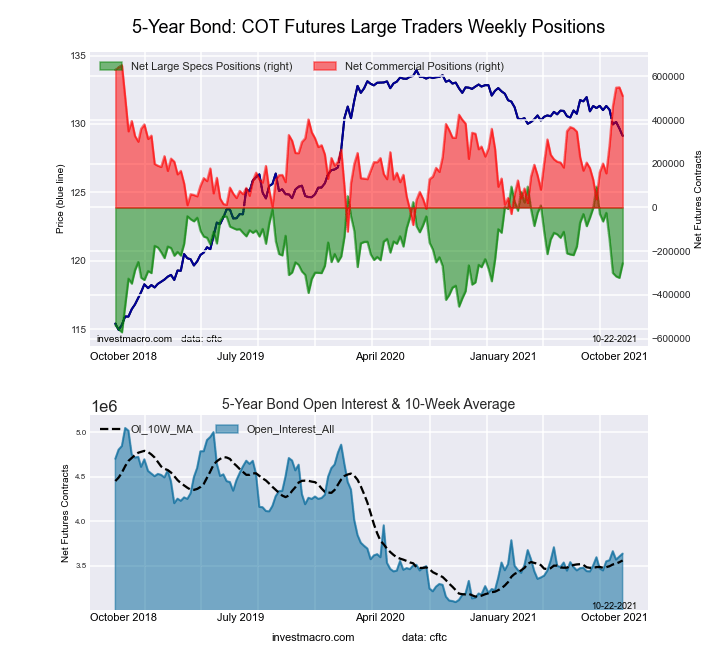
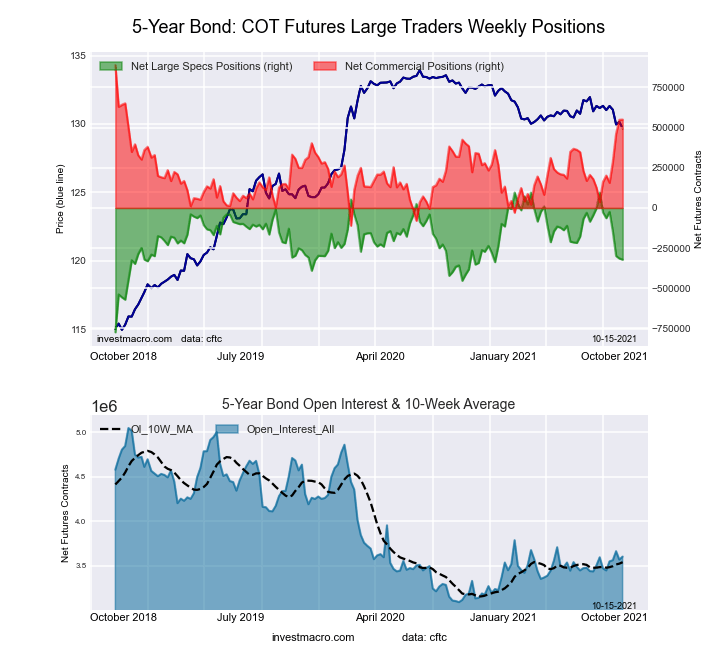
5-Year Treasury Bonds Futures COT ChartThe 5-Year Treasury Note large speculator standing this week resulted in a net position of -255,211 contracts in the data reported through Tuesday. This was a weekly lift of 66,208 contracts from the previous week which had a total of -321,419 net contracts.

This week’s current strength score (the trader positioning range over the past three years, measured from 0 to 100) shows the speculators are currently Bearish with a score of 47.4 percent. The commercials are Bullish-Extreme with a score of 81.5 percent and the small traders (not shown in chart) are Bearish-Extreme with a score of 0.0 percent.

5-Year Treasury Note StatisticsSPECULATORSCOMMERCIALSSMALL TRADERS
– Percent of Open Interest Longs:11.477.77.0
– Percent of Open Interest Shorts:18.463.714.0
– Net Position:-255,211510,373-255,162
– Gross Longs:414,7112,827,556253,812
– Gross Shorts:669,9222,317,183508,974
– Long to Short Ratio:0.6 to 11.2 to 10.5 to 1
NET POSITION TREND:
– COT Index Score (3 Year Range Pct):47.481.50.0
– COT Index Reading (3 Year Range):BearishBullish-ExtremeBearish-Extreme
NET POSITION MOVEMENT INDEX:
– 6-Week Change in Strength Index:-28.840.6-36.1


10-Year Treasury Note Futures:

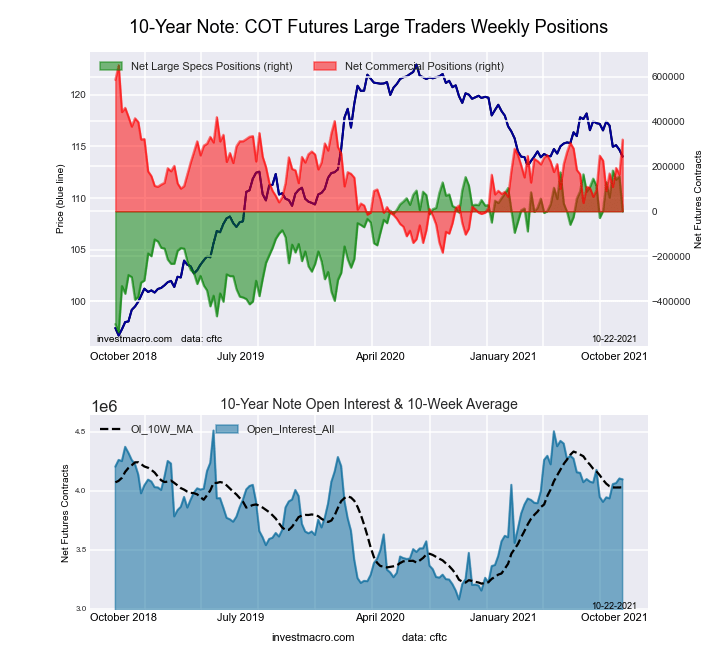
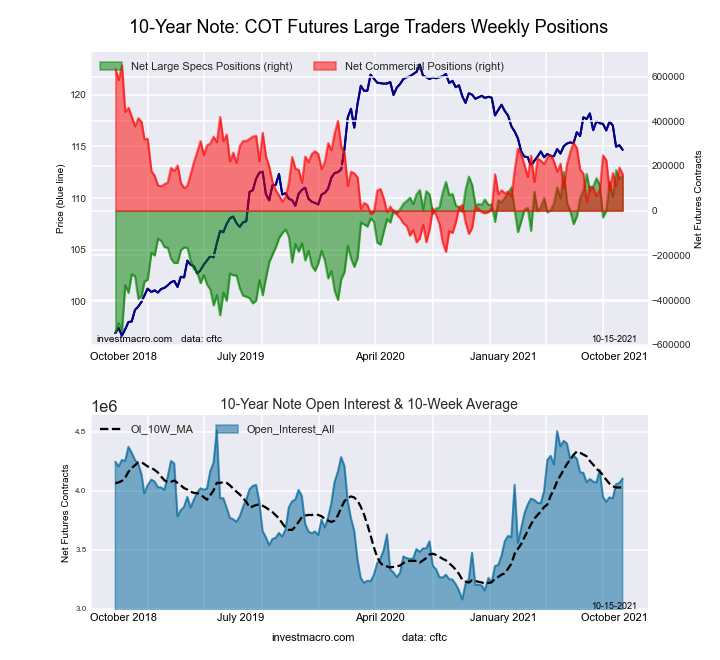
10-Year Treasury Notes Bonds Futures COT ChartThe 10-Year Treasury Note large speculator standing this week resulted in a net position of -544 contracts in the data reported through Tuesday. This was a weekly fall of -156,586 contracts from the previous week which had a total of 156,042 net contracts.

This week’s current strength score (the trader positioning range over the past three years, measured from 0 to 100) shows the speculators are currently Bullish with a score of 74.8 percent. The commercials are Bullish with a score of 60.3 percent and the small traders (not shown in chart) are Bearish-Extreme with a score of 3.6 percent.

10-Year Treasury Note StatisticsSPECULATORSCOMMERCIALSSMALL TRADERS
– Percent of Open Interest Longs:18.271.47.2
– Percent of Open Interest Shorts:18.263.615.0
– Net Position:-544319,388-318,844
– Gross Longs:743,7192,922,085295,191
– Gross Shorts:744,2632,602,697614,035
– Long to Short Ratio:1.0 to 11.1 to 10.5 to 1
NET POSITION TREND:
– COT Index Score (3 Year Range Pct):74.860.33.6
– COT Index Reading (3 Year Range):BullishBullishBearish-Extreme
NET POSITION MOVEMENT INDEX:
– 6-Week Change in Strength Index:-0.211.2-21.7


Ultra 10-Year Notes Futures:

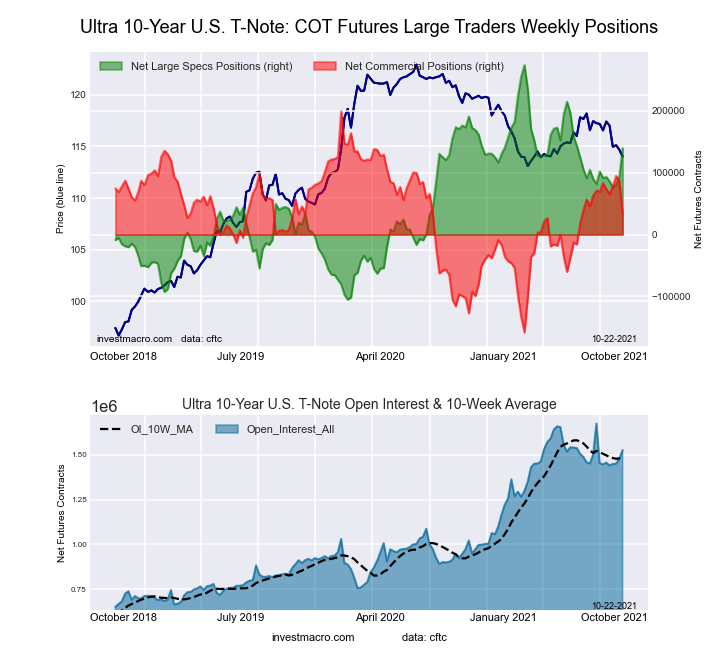
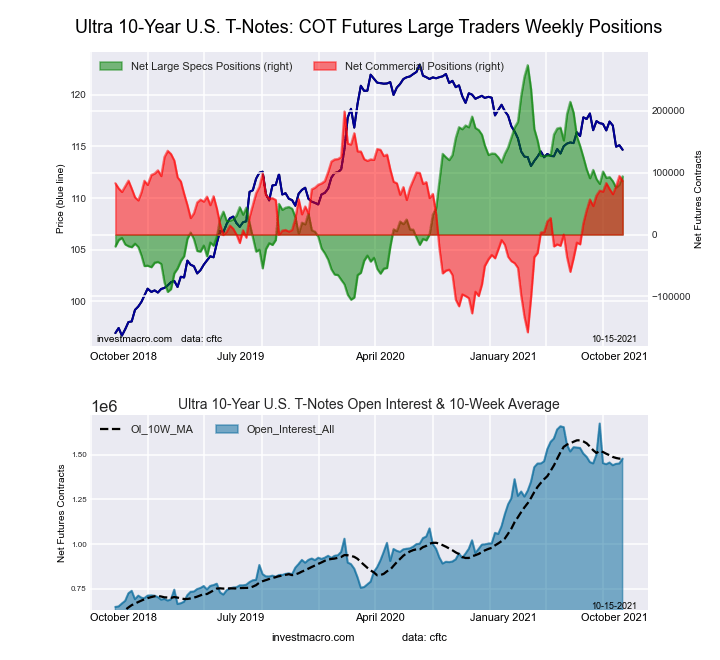
Ultra 10-Year Treasury Notes Bonds Futures COT ChartThe Ultra 10-Year Notes large speculator standing this week resulted in a net position of 139,559 contracts in the data reported through Tuesday. This was a weekly increase of 45,454 contracts from the previous week which had a total of 94,105 net contracts.

This week’s current strength score (the trader positioning range over the past three years, measured from 0 to 100) shows the speculators are currently Bullish with a score of 64.6 percent. The commercials are Bullish with a score of 53.3 percent and the small traders (not shown in chart) are Bearish-Extreme with a score of 5.6 percent.

Ultra 10-Year Notes StatisticsSPECULATORSCOMMERCIALSSMALL TRADERS
– Percent of Open Interest Longs:19.772.87.1
– Percent of Open Interest Shorts:10.670.718.4
– Net Position:139,55932,149-171,708
– Gross Longs:301,2861,110,821108,529
– Gross Shorts:161,7271,078,672280,237
– Long to Short Ratio:1.9 to 11.0 to 10.4 to 1
NET POSITION TREND:
– COT Index Score (3 Year Range Pct):64.653.35.6
– COT Index Reading (3 Year Range):BullishBullishBearish-Extreme
NET POSITION MOVEMENT INDEX:
– 6-Week Change in Strength Index:12.7-14.31.9


US Treasury Bonds Futures:

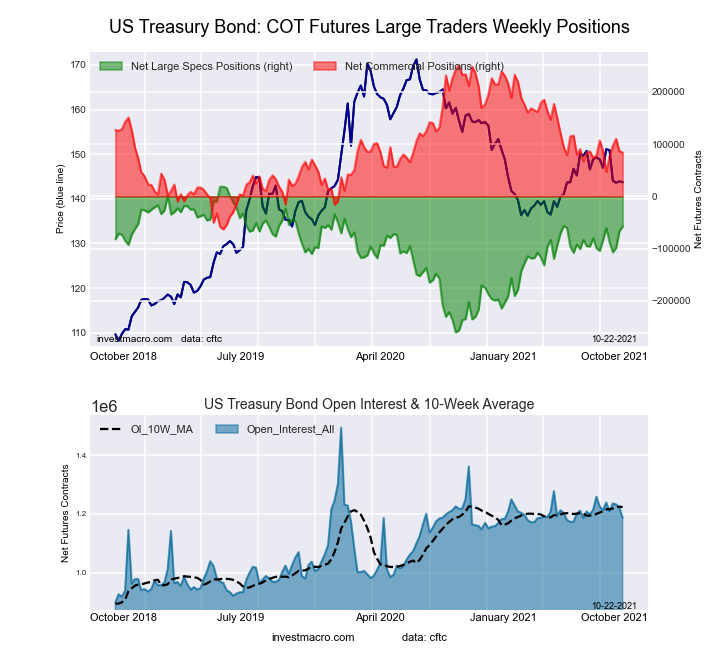
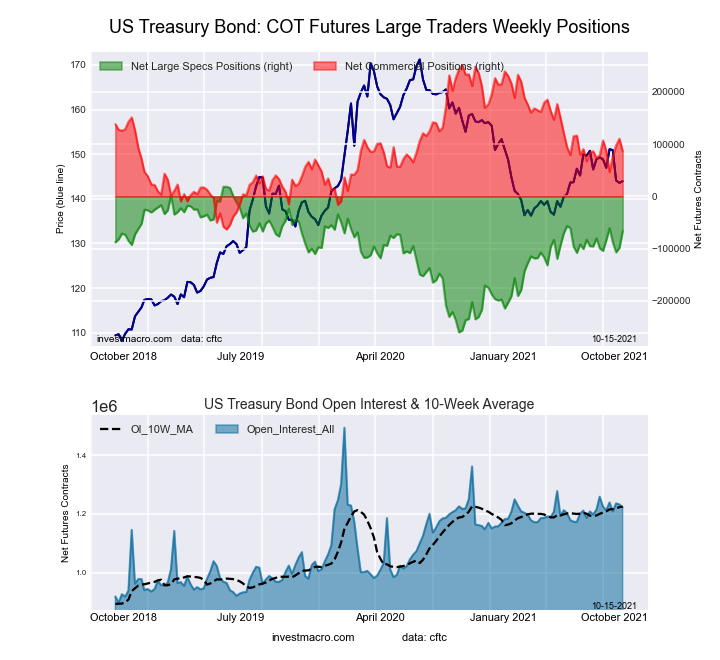
US Year Treasury Notes Long Bonds Futures COT ChartThe US Treasury Bonds large speculator standing this week resulted in a net position of -57,571 contracts in the data reported through Tuesday. This was a weekly boost of 8,980 contracts from the previous week which had a total of -66,551 net contracts.

This week’s current strength score (the trader positioning range over the past three years, measured from 0 to 100) shows the speculators are currently Bullish with a score of 72.7 percent. The commercials are Bearish with a score of 46.8 percent and the small traders (not shown in chart) are Bearish with a score of 31.8 percent.

US Treasury Bonds StatisticsSPECULATORSCOMMERCIALSSMALL TRADERS
– Percent of Open Interest Longs:9.974.813.6
– Percent of Open Interest Shorts:14.867.715.8
– Net Position:-57,57183,737-26,166
– Gross Longs:117,543887,561161,202
– Gross Shorts:175,114803,824187,368
– Long to Short Ratio:0.7 to 11.1 to 10.9 to 1
NET POSITION TREND:
– COT Index Score (3 Year Range Pct):72.746.831.8
– COT Index Reading (3 Year Range):BullishBearishBearish
NET POSITION MOVEMENT INDEX:
– 6-Week Change in Strength Index:9.3-0.9-18.4


Ultra US Treasury Bonds Futures:

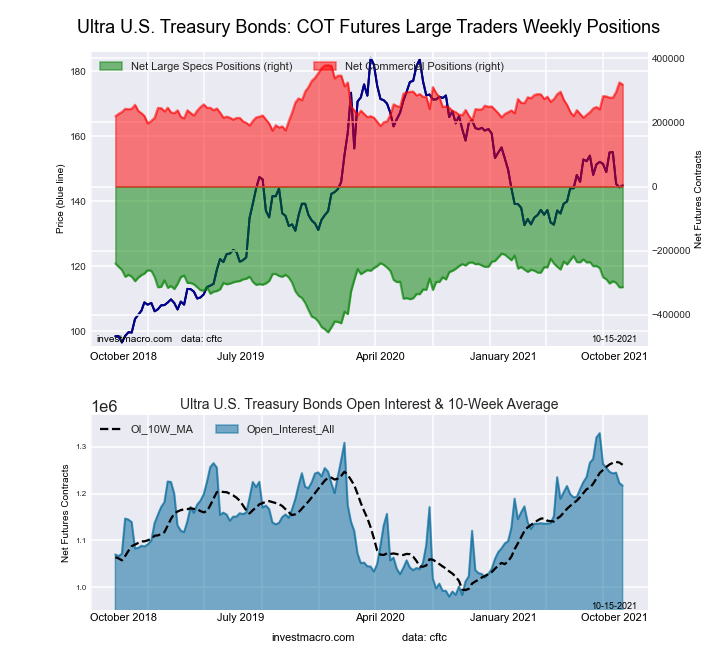
Ultra US Year Treasury Notes Long Bonds Futures COT ChartThe Ultra US Treasury Bonds large speculator standing this week resulted in a net position of -311,777 contracts in the data reported through Tuesday. This was a weekly boost of 1,637 contracts from the previous week which had a total of -313,414 net contracts.

This week’s current strength score (the trader positioning range over the past three years, measured from 0 to 100) shows the speculators are currently Bullish with a score of 58.0 percent. The commercials are Bullish with a score of 68.5 percent and the small traders (not shown in chart) are Bearish with a score of 26.8 percent.

Ultra US Treasury Bonds StatisticsSPECULATORSCOMMERCIALSSMALL TRADERS
– Percent of Open Interest Longs:5.081.412.6
– Percent of Open Interest Shorts:30.655.612.7
– Net Position:-311,777313,784-2,007
– Gross Longs:60,848989,707152,699
– Gross Shorts:372,625675,923154,706
– Long to Short Ratio:0.2 to 11.5 to 11.0 to 1
NET POSITION TREND:
– COT Index Score (3 Year Range Pct):58.068.526.8
– COT Index Reading (3 Year Range):BullishBullishBearish
NET POSITION MOVEMENT INDEX:
– 6-Week Change in Strength Index:-9.516.2-7.1


Article By InvestMacroReceive our weekly COT Reports by Email

*COT Report: The COT data, released weekly to the public each Friday, is updated through the most recent Tuesday (data is 3 days old) and shows a quick view of how large speculators or non-commercials (for-profit traders) were positioned in the futures markets.

The CFTC categorizes trader positions according to commercial hedgers (traders who use futures contracts for hedging as part of the business), non-commercials (large traders who speculate to realize trading profits) and nonreportable traders (usually small traders/speculators) as well as their open interest (contracts open in the market at time of reporting).

Find CFTC criteria here: (http://www.cftc.gov/MarketReports/CommitmentsofTraders/ExplanatoryNotes/index.htm).
COT Stock Market Charts: VIX Volatility, SP500 E-Mini Futures, Nasdaq, Russell-2000 & Dow Jones

By InvestMacro.com COT Home | Data Tables | Data Downloads | Newsletter

Here are the latest charts and statistics for the Commitment of Traders (COT) data published by the Commodities Futures Trading Commission (CFTC).

The latest COT data is updated through Tuesday October 19th 2021 and shows a quick view of how large traders (for-profit speculators and commercial entities) were positioned in the futures markets.


Data Snapshot of Stock Market Traders | Columns Legend
Oct-19-2021OIOI-IndexSpec-NetSpec-IndexCom-NetCOM-IndexSmalls-NetSmalls-Index
S&P500-Mini2,386,587067,61965-85,2755117,65630
Nikkei 22516,97781,21262-3,790392,57860
Nasdaq-Mini237,36535-3,0577310,42833-7,37127
DowJones-Mini106,040783,63140-8,168524,53763
VIX361,39145-86,7685093,60751-6,83930
Nikkei 225 Yen54,615351,1442528,926100-30,07021


VIX Volatility Futures:

Federal Funds 30-Day Bonds Futures COT ChartThe VIX Volatility large speculator standing this week totaled a net position of -86,768 contracts in the data reported through Tuesday. This was a weekly reduction of -13,199 contracts from the previous week which had a total of -73,569 net contracts.

This week’s current strength score (the trader positioning range over the past three years, measured from 0 to 100) shows the speculators are currently Bullish with a score of 50.1 percent. The commercials are Bullish with a score of 50.9 percent and the small traders (not shown in chart) are Bearish with a score of 30.5 percent.

VIX Volatility Futures StatisticsSPECULATORSCOMMERCIALSSMALL TRADERS
– Percent of Open Interest Longs:16.853.16.3
– Percent of Open Interest Shorts:40.827.28.2
– Net Position:-86,76893,607-6,839
– Gross Longs:60,834191,93722,690
– Gross Shorts:147,60298,33029,529
– Long to Short Ratio:0.4 to 12.0 to 10.8 to 1
NET POSITION TREND:
– COT Index Score (3 Year Range Pct):50.150.930.5
– COT Index Reading (3 Year Range):BullishBullishBearish
NET POSITION MOVEMENT INDEX:
– 6-Week Change in Strength Index:1.3-1.0-1.7


S&P500 Mini Futures:

2-Year Treasury Bonds Futures COT ChartThe S&P500 Mini large speculator standing this week totaled a net position of 67,619 contracts in the data reported through Tuesday. This was a weekly lowering of -31,164 contracts from the previous week which had a total of 98,783 net contracts.

This week’s current strength score (the trader positioning range over the past three years, measured from 0 to 100) shows the speculators are currently Bullish with a score of 65.5 percent. The commercials are Bullish with a score of 50.6 percent and the small traders (not shown in chart) are Bearish with a score of 30.1 percent.

S&P500 Mini Futures StatisticsSPECULATORSCOMMERCIALSSMALL TRADERS
– Percent of Open Interest Longs:14.772.010.8
– Percent of Open Interest Shorts:11.875.610.1
– Net Position:67,619-85,27517,656
– Gross Longs:350,1551,718,651258,179
– Gross Shorts:282,5361,803,926240,523
– Long to Short Ratio:1.2 to 11.0 to 11.1 to 1
NET POSITION TREND:
– COT Index Score (3 Year Range Pct):65.550.630.1
– COT Index Reading (3 Year Range):BullishBullishBearish
NET POSITION MOVEMENT INDEX:
– 6-Week Change in Strength Index:16.9-0.7-19.3


Dow Jones Mini Futures:

5-Year Treasury Bonds Futures COT ChartThe Dow Jones Mini large speculator standing this week totaled a net position of 3,631 contracts in the data reported through Tuesday. This was a weekly rise of 7,914 contracts from the previous week which had a total of -4,283 net contracts.

This week’s current strength score (the trader positioning range over the past three years, measured from 0 to 100) shows the speculators are currently Bearish with a score of 40.4 percent. The commercials are Bullish with a score of 52.4 percent and the small traders (not shown in chart) are Bullish with a score of 62.7 percent.

Dow Jones Mini Futures StatisticsSPECULATORSCOMMERCIALSSMALL TRADERS
– Percent of Open Interest Longs:37.843.516.4
– Percent of Open Interest Shorts:34.451.212.1
– Net Position:3,631-8,1684,537
– Gross Longs:40,10546,15517,408
– Gross Shorts:36,47454,32312,871
– Long to Short Ratio:1.1 to 10.8 to 11.4 to 1
NET POSITION TREND:
– COT Index Score (3 Year Range Pct):40.452.462.7
– COT Index Reading (3 Year Range):BearishBullishBullish
NET POSITION MOVEMENT INDEX:
– 6-Week Change in Strength Index:17.2-12.2-20.5


Nasdaq Mini Futures:

10-Year Treasury Notes Bonds Futures COT ChartThe Nasdaq Mini large speculator standing this week totaled a net position of -3,057 contracts in the data reported through Tuesday. This was a weekly decline of -2,239 contracts from the previous week which had a total of -818 net contracts.

This week’s current strength score (the trader positioning range over the past three years, measured from 0 to 100) shows the speculators are currently Bullish with a score of 73.3 percent. The commercials are Bearish with a score of 32.9 percent and the small traders (not shown in chart) are Bearish with a score of 27.4 percent.

Nasdaq Mini Futures StatisticsSPECULATORSCOMMERCIALSSMALL TRADERS
– Percent of Open Interest Longs:25.556.915.4
– Percent of Open Interest Shorts:26.852.518.5
– Net Position:-3,05710,428-7,371
– Gross Longs:60,578135,01236,648
– Gross Shorts:63,635124,58444,019
– Long to Short Ratio:1.0 to 11.1 to 10.8 to 1
NET POSITION TREND:
– COT Index Score (3 Year Range Pct):73.332.927.4
– COT Index Reading (3 Year Range):BullishBearishBearish
NET POSITION MOVEMENT INDEX:
– 6-Week Change in Strength Index:-4.54.13.3


Russell 2000 Mini Futures:

Ultra 10-Year Treasury Notes Bonds Futures COT ChartThe Russell 2000 Mini large speculator standing this week totaled a net position of -59,321 contracts in the data reported through Tuesday. This was a weekly decrease of -10,615 contracts from the previous week which had a total of -48,706 net contracts.

This week’s current strength score (the trader positioning range over the past three years, measured from 0 to 100) shows the speculators are currently Bearish with a score of 20.0 percent. The commercials are Bullish with a score of 74.0 percent and the small traders (not shown in chart) are Bullish with a score of 71.1 percent.

Russell 2000 Mini Futures StatisticsSPECULATORSCOMMERCIALSSMALL TRADERS
– Percent of Open Interest Longs:12.479.77.0
– Percent of Open Interest Shorts:25.469.74.1
– Net Position:-59,32145,83013,491
– Gross Longs:56,745364,54832,132
– Gross Shorts:116,066318,71818,641
– Long to Short Ratio:0.5 to 11.1 to 11.7 to 1
NET POSITION TREND:
– COT Index Score (3 Year Range Pct):20.074.071.1
– COT Index Reading (3 Year Range):BearishBullishBullish
NET POSITION MOVEMENT INDEX:
– 6-Week Change in Strength Index:-2.0-1.012.6


Nikkei Stock Average (USD) Futures:

US Year Treasury Notes Long Bonds Futures COT ChartThe Nikkei Stock Average (USD) large speculator standing this week totaled a net position of 1,212 contracts in the data reported through Tuesday. This was a weekly gain of 18 contracts from the previous week which had a total of 1,194 net contracts.

This week’s current strength score (the trader positioning range over the past three years, measured from 0 to 100) shows the speculators are currently Bullish with a score of 61.9 percent. The commercials are Bearish with a score of 39.3 percent and the small traders (not shown in chart) are Bullish with a score of 59.9 percent.

Nikkei Stock Average Futures StatisticsSPECULATORSCOMMERCIALSSMALL TRADERS
– Percent of Open Interest Longs:14.056.229.6
– Percent of Open Interest Shorts:6.878.614.5
– Net Position:1,212-3,7902,578
– Gross Longs:2,3719,5465,033
– Gross Shorts:1,15913,3362,455
– Long to Short Ratio:2.0 to 10.7 to 12.1 to 1
NET POSITION TREND:
– COT Index Score (3 Year Range Pct):61.939.359.9
– COT Index Reading (3 Year Range):BullishBearishBullish
NET POSITION MOVEMENT INDEX:
– 6-Week Change in Strength Index:34.3-31.7-5.1


MSCI EAFE Mini Futures:

Ultra US Year Treasury Notes Long Bonds Futures COT ChartThe MSCI EAFE Mini large speculator standing this week totaled a net position of 12,839 contracts in the data reported through Tuesday. This was a weekly decline of -3,615 contracts from the previous week which had a total of 16,454 net contracts.

This week’s current strength score (the trader positioning range over the past three years, measured from 0 to 100) shows the speculators are currently Bearish with a score of 26.8 percent. The commercials are Bullish with a score of 67.3 percent and the small traders (not shown in chart) are Bullish with a score of 63.6 percent.

MSCI EAFE Mini Futures StatisticsSPECULATORSCOMMERCIALSSMALL TRADERS
– Percent of Open Interest Longs:6.889.83.0
– Percent of Open Interest Shorts:3.494.61.7
– Net Position:12,839-18,0925,253
– Gross Longs:25,861342,24411,565
– Gross Shorts:13,022360,3366,312
– Long to Short Ratio:2.0 to 10.9 to 11.8 to 1
NET POSITION TREND:
– COT Index Score (3 Year Range Pct):26.867.363.6
– COT Index Reading (3 Year Range):BearishBullishBullish
NET POSITION MOVEMENT INDEX:
– 6-Week Change in Strength Index:-19.823.2-19.7


Article By InvestMacro.comReceive our weekly COT Reports by Email

*COT Report: The COT data, released weekly to the public each Friday, is updated through the most recent Tuesday (data is 3 days old) and shows a quick view of how large speculators or non-commercials (for-profit traders) were positioned in the futures markets.

The CFTC categorizes trader positions according to commercial hedgers (traders who use futures contracts for hedging as part of the business), non-commercials (large traders who speculate to realize trading profits) and nonreportable traders (usually small traders/speculators).

Find CFTC criteria here: (http://www.cftc.gov/MarketReports/CommitmentsofTraders/ExplanatoryNotes/index.htm).
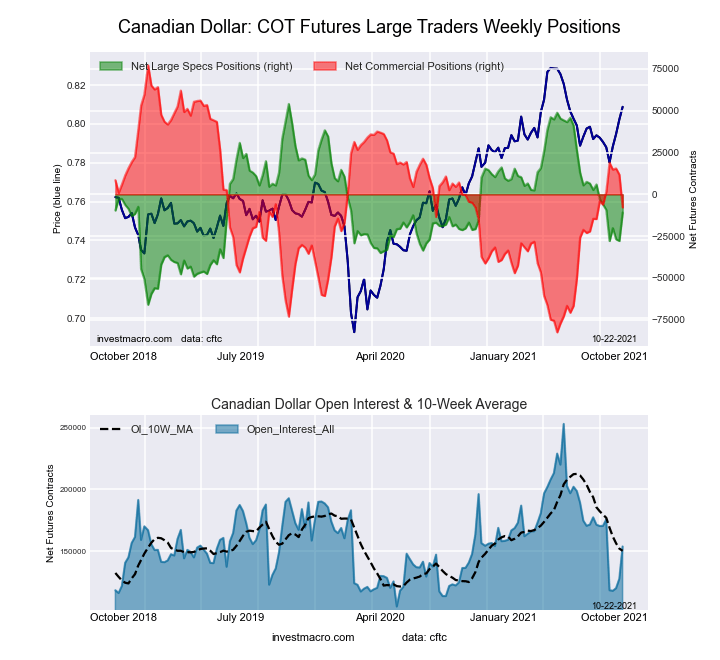
COT Currency Charts: Speculators push US Dollar Index bullish bets to 104-week high

By InvestMacro | COT Home | Data Tables | Data Downloads | Newsletter

Here are the latest charts and statistics for the Commitment of Traders (COT) data published by the Commodities Futures Trading Commission (CFTC).

The latest COT data is updated through Tuesday October 12th 2021 and shows a quick view of how large traders (for-profit speculators and commercial entities) were positioned in the futures markets. All currency positions are in direct relation to the US dollar where, for example, a bet for the euro is a bet that the euro will rise versus the dollar while a bet against the euro will be a bet that the euro will decline versus the dollar.

Highlighting this week’s COT Currency data is the speculator’s US Dollar Index bullish bets which have risen to the highest level in 104 weeks. Speculator wagers in favor of the Dollar Index have now increased for eight straight weeks and have climbed higher for sixteen out of the past seventeen weeks. This pushes the current position (35,062 contracts) to the most bullish standing dating back to October 15th of 2019 when net positions totaled 37,436 contracts. The speculator strength index score (current levels compared to past three years) also shows that spec sentiment has now moved into an extreme bullish position (86 percent score) for a second week.


Data Snapshot of Forex Market Traders | Columns Legend
Oct-12-2021OIOI-IndexSpec-NetSpec-IndexCom-NetCOM-IndexSmalls-NetSmalls-Index
USD Index62,8369535,06286-42,69247,630100
EUR695,32982-18,39829-8,9537327,35123
GBP172,82921-11,9796520,19142-8,21239
JPY243,617100-76,6342195,09284-18,45812
CHF57,34138-12,9724729,96365-16,99113
CAD127,82715-27,8603211,7285916,13271
AUD177,93266-87,6082102,00095-14,39220
NZD37,340198,74886-8,15118-59745
MXN171,75434-39,634037,7591001,87551
RUB54,7716119,30859-21,718362,410100
BRL27,33826-37368-1073348073
Bitcoin10,91869-1,42664555087118


US Dollar Index Futures:

Federal Funds 30-Day Bonds Futures COT ChartThe US Dollar Index large speculator standing this week resulted in a net position of 35,062 contracts in the data reported through Tuesday. This was a weekly gain of 3,036 contracts from the previous week which had a total of 32,026 net contracts.

This week’s current strength score (the trader positioning range over the past three years, measured from 0 to 100) shows the speculators are currently Bullish-Extreme with a score of 86.3 percent. The commercials are Bearish-Extreme with a score of 3.7 percent and the small traders (not shown in chart) are Bullish-Extreme with a score of 100.0 percent.

US DOLLAR INDEX StatisticsSPECULATORSCOMMERCIALSSMALL TRADERS
– Percent of Open Interest Longs:78.63.414.5
– Percent of Open Interest Shorts:22.871.32.4
– Net Position:35,062-42,6927,630
– Gross Longs:49,3942,1319,108
– Gross Shorts:14,33244,8231,478
– Long to Short Ratio:3.4 to 10.0 to 16.2 to 1
NET POSITION TREND:
– COT Index Score (3 Year Range Pct):86.33.7100.0
– COT Index Reading (3 Year Range):Bullish-ExtremeBearish-ExtremeBullish-Extreme
NET POSITION MOVEMENT INDEX:
– 6-Week Change in Strength Index:24.8-27.423.4


Euro Currency Futures:

2-Year Treasury Bonds Futures COT ChartThe Euro Currency large speculator standing this week resulted in a net position of -18,398 contracts in the data reported through Tuesday. This was a weekly rise of 3,936 contracts from the previous week which had a total of -22,334 net contracts.

This week’s current strength score (the trader positioning range over the past three years, measured from 0 to 100) shows the speculators are currently Bearish with a score of 29.4 percent. The commercials are Bullish with a score of 73.2 percent and the small traders (not shown in chart) are Bearish with a score of 23.3 percent.

EURO Currency StatisticsSPECULATORSCOMMERCIALSSMALL TRADERS
– Percent of Open Interest Longs:29.157.012.8
– Percent of Open Interest Shorts:31.858.38.8
– Net Position:-18,398-8,95327,351
– Gross Longs:202,512396,22488,733
– Gross Shorts:220,910405,17761,382
– Long to Short Ratio:0.9 to 11.0 to 11.4 to 1
NET POSITION TREND:
– COT Index Score (3 Year Range Pct):29.473.223.3
– COT Index Reading (3 Year Range):BearishBullishBearish
NET POSITION MOVEMENT INDEX:
– 6-Week Change in Strength Index:-8.912.2-22.7


British Pound Sterling Futures:

5-Year Treasury Bonds Futures COT ChartThe British Pound Sterling large speculator standing this week resulted in a net position of -11,979 contracts in the data reported through Tuesday. This was a weekly increase of 8,039 contracts from the previous week which had a total of -20,018 net contracts.

This week’s current strength score (the trader positioning range over the past three years, measured from 0 to 100) shows the speculators are currently Bullish with a score of 65.4 percent. The commercials are Bearish with a score of 41.6 percent and the small traders (not shown in chart) are Bearish with a score of 38.6 percent.

BRITISH POUND StatisticsSPECULATORSCOMMERCIALSSMALL TRADERS
– Percent of Open Interest Longs:27.157.014.3
– Percent of Open Interest Shorts:34.045.319.1
– Net Position:-11,97920,191-8,212
– Gross Longs:46,79498,51224,778
– Gross Shorts:58,77378,32132,990
– Long to Short Ratio:0.8 to 11.3 to 10.8 to 1
NET POSITION TREND:
– COT Index Score (3 Year Range Pct):65.441.638.6
– COT Index Reading (3 Year Range):BullishBearishBearish
NET POSITION MOVEMENT INDEX:
– 6-Week Change in Strength Index:2.13.4-18.0


Japanese Yen Futures:

10-Year Treasury Notes Bonds Futures COT ChartThe Japanese Yen large speculator standing this week resulted in a net position of -76,634 contracts in the data reported through Tuesday. This was a weekly reduction of -12,940 contracts from the previous week which had a total of -63,694 net contracts.

This week’s current strength score (the trader positioning range over the past three years, measured from 0 to 100) shows the speculators are currently Bearish with a score of 20.7 percent. The commercials are Bullish-Extreme with a score of 84.3 percent and the small traders (not shown in chart) are Bearish-Extreme with a score of 12.4 percent.

JAPANESE YEN StatisticsSPECULATORSCOMMERCIALSSMALL TRADERS
– Percent of Open Interest Longs:14.776.28.5
– Percent of Open Interest Shorts:46.237.116.1
– Net Position:-76,63495,092-18,458
– Gross Longs:35,810185,56020,735
– Gross Shorts:112,44490,46839,193
– Long to Short Ratio:0.3 to 12.1 to 10.5 to 1
NET POSITION TREND:
– COT Index Score (3 Year Range Pct):20.784.312.4
– COT Index Reading (3 Year Range):BearishBullish-ExtremeBearish-Extreme
NET POSITION MOVEMENT INDEX:
– 6-Week Change in Strength Index:-8.47.9-4.6


Swiss Franc Futures:

Ultra 10-Year Treasury Notes Bonds Futures COT ChartThe Swiss Franc large speculator standing this week resulted in a net position of -12,972 contracts in the data reported through Tuesday. This was a weekly boost of 2,707 contracts from the previous week which had a total of -15,679 net contracts.

This week’s current strength score (the trader positioning range over the past three years, measured from 0 to 100) shows the speculators are currently Bearish with a score of 47.3 percent. The commercials are Bullish with a score of 64.6 percent and the small traders (not shown in chart) are Bearish-Extreme with a score of 13.5 percent.

SWISS FRANC StatisticsSPECULATORSCOMMERCIALSSMALL TRADERS
– Percent of Open Interest Longs:6.279.014.7
– Percent of Open Interest Shorts:28.826.844.3
– Net Position:-12,97229,963-16,991
– Gross Longs:3,56045,3278,435
– Gross Shorts:16,53215,36425,426
– Long to Short Ratio:0.2 to 13.0 to 10.3 to 1
NET POSITION TREND:
– COT Index Score (3 Year Range Pct):47.364.613.5
– COT Index Reading (3 Year Range):BearishBullishBearish-Extreme
NET POSITION MOVEMENT INDEX:
– 6-Week Change in Strength Index:-29.630.7-30.1


Canadian Dollar Futures:

US Year Treasury Notes Long Bonds Futures COT ChartThe Canadian Dollar large speculator standing this week resulted in a net position of -27,860 contracts in the data reported through Tuesday. This was a weekly decline of -994 contracts from the previous week which had a total of -26,866 net contracts.

This week’s current strength score (the trader positioning range over the past three years, measured from 0 to 100) shows the speculators are currently Bearish with a score of 31.8 percent. The commercials are Bullish with a score of 59.0 percent and the small traders (not shown in chart) are Bullish with a score of 71.1 percent.

CANADIAN DOLLAR StatisticsSPECULATORSCOMMERCIALSSMALL TRADERS
– Percent of Open Interest Longs:17.552.329.1
– Percent of Open Interest Shorts:39.343.116.5
– Net Position:-27,86011,72816,132
– Gross Longs:22,38266,80337,224
– Gross Shorts:50,24255,07521,092
– Long to Short Ratio:0.4 to 11.2 to 11.8 to 1
NET POSITION TREND:
– COT Index Score (3 Year Range Pct):31.859.071.1
– COT Index Reading (3 Year Range):BearishBullishBullish
NET POSITION MOVEMENT INDEX:
– 6-Week Change in Strength Index:-20.89.913.9


Australian Dollar Futures:

Ultra US Year Treasury Notes Long Bonds Futures COT ChartThe Australian Dollar large speculator standing this week resulted in a net position of -87,608 contracts in the data reported through Tuesday. This was a weekly gain of 2,371 contracts from the previous week which had a total of -89,979 net contracts.

This week’s current strength score (the trader positioning range over the past three years, measured from 0 to 100) shows the speculators are currently Bearish-Extreme with a score of 2.2 percent. The commercials are Bullish-Extreme with a score of 95.0 percent and the small traders (not shown in chart) are Bearish with a score of 20.2 percent.

AUSTRALIAN DOLLAR StatisticsSPECULATORSCOMMERCIALSSMALL TRADERS
– Percent of Open Interest Longs:6.382.29.2
– Percent of Open Interest Shorts:55.524.817.3
– Net Position:-87,608102,000-14,392
– Gross Longs:11,193146,17616,345
– Gross Shorts:98,80144,17630,737
– Long to Short Ratio:0.1 to 13.3 to 10.5 to 1
NET POSITION TREND:
– COT Index Score (3 Year Range Pct):2.295.020.2
– COT Index Reading (3 Year Range):Bearish-ExtremeBullish-ExtremeBearish
NET POSITION MOVEMENT INDEX:
– 6-Week Change in Strength Index:-25.915.216.7


New Zealand Dollar Futures:

Eurodollar Bonds Futures COT ChartThe New Zealand Dollar large speculator standing this week resulted in a net position of 8,748 contracts in the data reported through Tuesday. This was a weekly gain of 692 contracts from the previous week which had a total of 8,056 net contracts.

This week’s current strength score (the trader positioning range over the past three years, measured from 0 to 100) shows the speculators are currently Bullish-Extreme with a score of 85.9 percent. The commercials are Bearish-Extreme with a score of 17.8 percent and the small traders (not shown in chart) are Bearish with a score of 45.0 percent.

NEW ZEALAND DOLLAR StatisticsSPECULATORSCOMMERCIALSSMALL TRADERS
– Percent of Open Interest Longs:54.833.79.8
– Percent of Open Interest Shorts:31.455.511.4
– Net Position:8,748-8,151-597
– Gross Longs:20,46712,5863,646
– Gross Shorts:11,71920,7374,243
– Long to Short Ratio:1.7 to 10.6 to 10.9 to 1
NET POSITION TREND:
– COT Index Score (3 Year Range Pct):85.917.845.0
– COT Index Reading (3 Year Range):Bullish-ExtremeBearish-ExtremeBearish
NET POSITION MOVEMENT INDEX:
– 6-Week Change in Strength Index:18.3-16.2-4.2


Mexican Peso Futures:

Ultra 10-Year Treasury Notes Bonds Futures COT ChartThe Mexican Peso large speculator standing this week resulted in a net position of -39,634 contracts in the data reported through Tuesday. This was a weekly decline of -4,055 contracts from the previous week which had a total of -35,579 net contracts.

This week’s current strength score (the trader positioning range over the past three years, measured from 0 to 100) shows the speculators are currently Bearish-Extreme with a score of 0.0 percent. The commercials are Bullish-Extreme with a score of 100.0 percent and the small traders (not shown in chart) are Bullish with a score of 51.0 percent.

MEXICAN PESO StatisticsSPECULATORSCOMMERCIALSSMALL TRADERS
– Percent of Open Interest Longs:43.252.63.2
– Percent of Open Interest Shorts:66.230.62.2
– Net Position:-39,63437,7591,875
– Gross Longs:74,12990,2835,577
– Gross Shorts:113,76352,5243,702
– Long to Short Ratio:0.7 to 11.7 to 11.5 to 1
NET POSITION TREND:
– COT Index Score (3 Year Range Pct):0.0100.051.0
– COT Index Reading (3 Year Range):Bearish-ExtremeBullish-ExtremeBullish
NET POSITION MOVEMENT INDEX:
– 6-Week Change in Strength Index:-8.99.7-8.5


Brazilian Real Futures:

US Year Treasury Notes Long Bonds Futures COT ChartThe Brazilian Real large speculator standing this week resulted in a net position of -373 contracts in the market data reported through Tuesday. This was a weekly advance of 1,917 contracts from the previous week which had a total of -2,290 net contracts.

This week’s current strength score (the trader positioning range over the past three years, measured from 0 to 100) shows the speculators are currently Bullish with a score of 68.1 percent. The commercials are Bearish with a score of 33.3 percent and the small traders (not shown in chart) are Bullish with a score of 72.6 percent.

BRAZIL REAL StatisticsSPECULATORSCOMMERCIALSSMALL TRADERS
– Percent of Open Interest Longs:52.935.111.5
– Percent of Open Interest Shorts:54.235.59.8
– Net Position:-373-107480
– Gross Longs:14,4499,6003,154
– Gross Shorts:14,8229,7072,674
– Long to Short Ratio:1.0 to 11.0 to 11.2 to 1
NET POSITION TREND:
– COT Index Score (3 Year Range Pct):68.133.372.6
– COT Index Reading (3 Year Range):BullishBearishBullish
NET POSITION MOVEMENT INDEX:
– 6-Week Change in Strength Index:-16.918.7-16.7


Russian Ruble Futures:

Ultra US Year Treasury Notes Long Bonds Futures COT ChartThe Russian Ruble large speculator standing this week resulted in a net position of 19,308 contracts in the data reported through Tuesday. This was a weekly fall of -1,101 contracts from the previous week which had a total of 20,409 net contracts.

This week’s current strength score (the trader positioning range over the past three years, measured from 0 to 100) shows the speculators are currently Bullish with a score of 59.1 percent. The commercials are Bearish with a score of 35.8 percent and the small traders (not shown in chart) are Bullish-Extreme with a score of 100.0 percent.

RUSSIAN RUBLE StatisticsSPECULATORSCOMMERCIALSSMALL TRADERS
– Percent of Open Interest Longs:55.139.05.8
– Percent of Open Interest Shorts:19.978.71.4
– Net Position:19,308-21,7182,410
– Gross Longs:30,19321,3883,190
– Gross Shorts:10,88543,106780
– Long to Short Ratio:2.8 to 10.5 to 14.1 to 1
NET POSITION TREND:
– COT Index Score (3 Year Range Pct):59.135.8100.0
– COT Index Reading (3 Year Range):BullishBearishBullish-Extreme
NET POSITION MOVEMENT INDEX:
– 6-Week Change in Strength Index:-5.13.121.7


Bitcoin Futures:

Eurodollar Bonds Futures COT ChartThe Bitcoin large speculator standing this week resulted in a net position of -1,426 contracts in the data reported through Tuesday. This was a weekly lift of 92 contracts from the previous week which had a total of -1,518 net contracts.

This week’s current strength score (the trader positioning range over the past three years, measured from 0 to 100) shows the speculators are currently Bullish with a score of 63.8 percent. The commercials are Bullish-Extreme with a score of 92.3 percent and the small traders (not shown in chart) are Bearish-Extreme with a score of 18.3 percent.

BITCOIN StatisticsSPECULATORSCOMMERCIALSSMALL TRADERS
– Percent of Open Interest Longs:62.76.316.0
– Percent of Open Interest Shorts:75.71.28.1
– Net Position:-1,426555871
– Gross Longs:6,8446891,751
– Gross Shorts:8,270134880
– Long to Short Ratio:0.8 to 15.1 to 12.0 to 1
NET POSITION TREND:
– COT Index Score (3 Year Range Pct):63.892.318.3
– COT Index Reading (3 Year Range):BullishBullish-ExtremeBearish-Extreme
NET POSITION MOVEMENT INDEX:
– 6-Week Change in Strength Index:-9.462.4-8.5


Article By InvestMacro.comReceive our weekly COT Reports by Email

*COT Report: The COT data, released weekly to the public each Friday, is updated through the most recent Tuesday (data is 3 days old) and shows a quick view of how large speculators or non-commercials (for-profit traders) were positioned in the futures markets.

The CFTC categorizes trader positions according to commercial hedgers (traders who use futures contracts for hedging as part of the business), non-commercials (large traders who speculate to realize trading profits) and nonreportable traders (usually small traders/speculators).

Find CFTC criteria here: (http://www.cftc.gov/MarketReports/CommitmentsofTraders/ExplanatoryNotes/index.htm).
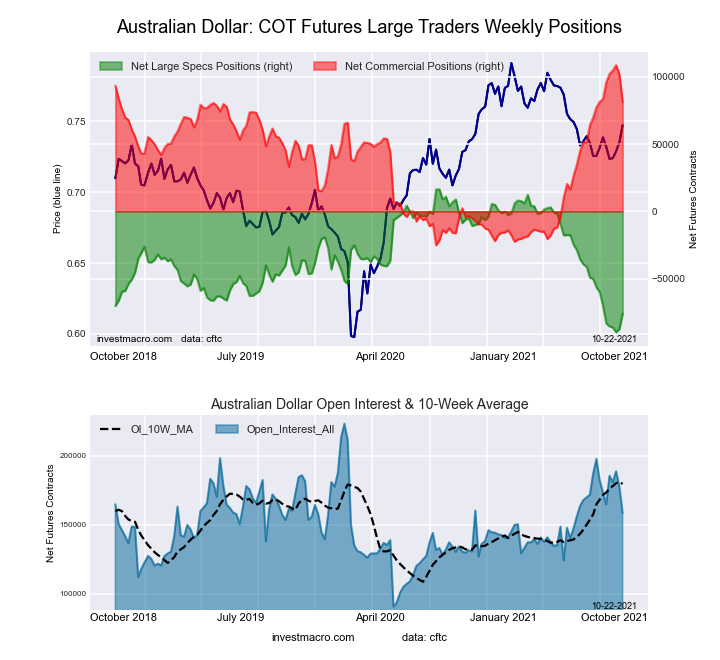
COT Bonds Charts: Speculator’s 10-Year Treasury Notes bullish bets rise for 4th time in 6 weeks

By InvestMacro | COT Home | Data Tables | Data Downloads | Newsletter

Here are the latest charts and statistics for the Commitment of Traders (COT) data published by the Commodities Futures Trading Commission (CFTC).

The latest COT data is updated through Tuesday October 12th 2021 and shows a quick view of how large traders (for-profit speculators and commercial entities) were positioned in the futures markets.

Highlighting this week’s COT Bonds data is the 10-Year Treasury Note which has seen its weekly speculator position rise for four out of the past six weeks. The 10-Year had a negative net contract position as recently as August 31st before speculators boosted their positions by almost 200,000 net contracts from September 7th to October 12th. Interestingly, at the current moment, both the speculators and the commercial traders (163,158 net contracts) are bullish on the 10-Year, according to their net contracts. On the other side of the bet are the small traders which are net bearish with a total of -319,200 contracts as well as an extremely bearish strength index score.


Data Snapshot of Bond Market Traders | Columns Legend
Oct-12-2021OIOI-IndexSpec-NetSpec-IndexCom-NetCOM-IndexSmalls-NetSmalls-Index
Eurodollar12,837,29971-863,600341,133,79160-270,19168
FedFunds1,190,21216-69,0853179,99970-10,91442
2-Year1,845,2703-40,9468360,85529-19,90914
Long T-Bond1,222,49354-66,5517086,24848-19,69737
10-Year4,102,71472156,04297163,15842-319,2003
5-Year3,604,86426-321,41952549,71366-228,2942


3-Month Eurodollars Futures:

Eurodollar Bonds Futures COT ChartThe 3-Month Eurodollars large speculator standing this week recorded a net position of -863,600 contracts in the data reported through Tuesday. This was a weekly decrease of -102,757 contracts from the previous week which had a total of -760,843 net contracts.

This week’s current strength score (the trader positioning range over the past three years, measured from 0 to 100) shows the speculators are currently Bearish with a score of 33.7 percent. The commercials are Bullish with a score of 60.5 percent and the small traders (not shown in chart) are Bullish with a score of 67.7 percent.

3-Month Eurodollars StatisticsSPECULATORSCOMMERCIALSSMALL TRADERS
– Percent of Open Interest Longs:13.261.84.4
– Percent of Open Interest Shorts:19.953.06.5
– Net Position:-863,6001,133,791-270,191
– Gross Longs:1,691,8977,936,364566,490
– Gross Shorts:2,555,4976,802,573836,681
– Long to Short Ratio:0.7 to 11.2 to 10.7 to 1
NET POSITION TREND:
– COT Index Score (3 Year Range Pct):33.760.567.7
– COT Index Reading (3 Year Range):BearishBullishBullish
NET POSITION MOVEMENT INDEX:
– 6-Week Change in Strength Index:-2.54.4-16.1


30-Day Federal Funds Futures:

Federal Funds 30-Day Bonds Futures COT ChartThe 30-Day Federal Funds large speculator standing this week recorded a net position of -69,085 contracts in the data reported through Tuesday. This was a weekly gain of 9,263 contracts from the previous week which had a total of -78,348 net contracts.

This week’s current strength score (the trader positioning range over the past three years, measured from 0 to 100) shows the speculators are currently Bearish with a score of 31.1 percent. The commercials are Bullish with a score of 69.6 percent and the small traders (not shown in chart) are Bearish with a score of 41.7 percent.

30-Day Federal Funds StatisticsSPECULATORSCOMMERCIALSSMALL TRADERS
– Percent of Open Interest Longs:5.777.21.8
– Percent of Open Interest Shorts:11.570.52.7
– Net Position:-69,08579,999-10,914
– Gross Longs:68,061918,64020,954
– Gross Shorts:137,146838,64131,868
– Long to Short Ratio:0.5 to 11.1 to 10.7 to 1
NET POSITION TREND:
– COT Index Score (3 Year Range Pct):31.169.641.7
– COT Index Reading (3 Year Range):BearishBullishBearish
NET POSITION MOVEMENT INDEX:
– 6-Week Change in Strength Index:3.9-4.15.0


2-Year Treasury Note Futures:

2-Year Treasury Bonds Futures COT ChartThe 2-Year Treasury Note large speculator standing this week recorded a net position of -40,946 contracts in the data reported through Tuesday. This was a weekly boost of 1,581 contracts from the previous week which had a total of -42,527 net contracts.

This week’s current strength score (the trader positioning range over the past three years, measured from 0 to 100) shows the speculators are currently Bullish-Extreme with a score of 83.3 percent. The commercials are Bearish with a score of 29.1 percent and the small traders (not shown in chart) are Bearish-Extreme with a score of 14.1 percent.

2-Year Treasury Note StatisticsSPECULATORSCOMMERCIALSSMALL TRADERS
– Percent of Open Interest Longs:17.871.77.0
– Percent of Open Interest Shorts:20.068.48.1
– Net Position:-40,94660,855-19,909
– Gross Longs:328,3291,322,378128,740
– Gross Shorts:369,2751,261,523148,649
– Long to Short Ratio:0.9 to 11.0 to 10.9 to 1
NET POSITION TREND:
– COT Index Score (3 Year Range Pct):83.329.114.1
– COT Index Reading (3 Year Range):Bullish-ExtremeBearishBearish-Extreme
NET POSITION MOVEMENT INDEX:
– 6-Week Change in Strength Index:-4.59.3-16.7


5-Year Treasury Note Futures:

5-Year Treasury Bonds Futures COT ChartThe 5-Year Treasury Note large speculator standing this week recorded a net position of -321,419 contracts in the data reported through Tuesday. This was a weekly decline of -6,595 contracts from the previous week which had a total of -314,824 net contracts.

This week’s current strength score (the trader positioning range over the past three years, measured from 0 to 100) shows the speculators are currently Bullish with a score of 52.0 percent. The commercials are Bullish with a score of 66.1 percent and the small traders (not shown in chart) are Bearish-Extreme with a score of 1.6 percent.

5-Year Treasury Note StatisticsSPECULATORSCOMMERCIALSSMALL TRADERS
– Percent of Open Interest Longs:10.079.27.2
– Percent of Open Interest Shorts:18.964.013.5
– Net Position:-321,419549,713-228,294
– Gross Longs:360,9162,855,878258,857
– Gross Shorts:682,3352,306,165487,151
– Long to Short Ratio:0.5 to 11.2 to 10.5 to 1
NET POSITION TREND:
– COT Index Score (3 Year Range Pct):52.066.11.6
– COT Index Reading (3 Year Range):BullishBullishBearish-Extreme
NET POSITION MOVEMENT INDEX:
– 6-Week Change in Strength Index:-33.738.9-31.3


10-Year Treasury Note Futures:

10-Year Treasury Notes Bonds Futures COT ChartThe 10-Year Treasury Note large speculator standing this week recorded a net position of 156,042 contracts in the data reported through Tuesday. This was a weekly rise of 14,709 contracts from the previous week which had a total of 141,333 net contracts.

This week’s current strength score (the trader positioning range over the past three years, measured from 0 to 100) shows the speculators are currently Bullish-Extreme with a score of 96.5 percent. The commercials are Bearish with a score of 41.6 percent and the small traders (not shown in chart) are Bearish-Extreme with a score of 3.5 percent.

10-Year Treasury Note StatisticsSPECULATORSCOMMERCIALSSMALL TRADERS
– Percent of Open Interest Longs:21.568.17.3
– Percent of Open Interest Shorts:17.764.215.1
– Net Position:156,042163,158-319,200
– Gross Longs:883,6212,795,156300,686
– Gross Shorts:727,5792,631,998619,886
– Long to Short Ratio:1.2 to 11.1 to 10.5 to 1
NET POSITION TREND:
– COT Index Score (3 Year Range Pct):96.541.63.5
– COT Index Reading (3 Year Range):Bullish-ExtremeBearishBearish-Extreme
NET POSITION MOVEMENT INDEX:
– 6-Week Change in Strength Index:25.6-10.1-23.8


Ultra 10-Year Notes Futures:

Ultra 10-Year Treasury Notes Bonds Futures COT ChartThe Ultra 10-Year Notes large speculator standing this week recorded a net position of 94,105 contracts in the data reported through Tuesday. This was a weekly advance of 13,226 contracts from the previous week which had a total of 80,879 net contracts.

This week’s current strength score (the trader positioning range over the past three years, measured from 0 to 100) shows the speculators are currently Bullish with a score of 52.6 percent. The commercials are Bullish with a score of 68.5 percent and the small traders (not shown in chart) are Bearish-Extreme with a score of 0.0 percent.

Ultra 10-Year Notes StatisticsSPECULATORSCOMMERCIALSSMALL TRADERS
– Percent of Open Interest Longs:17.774.47.2
– Percent of Open Interest Shorts:11.468.519.4
– Net Position:94,10586,315-180,420
– Gross Longs:262,1561,099,485106,966
– Gross Shorts:168,0511,013,170287,386
– Long to Short Ratio:1.6 to 11.1 to 10.4 to 1
NET POSITION TREND:
– COT Index Score (3 Year Range Pct):52.668.50.0
– COT Index Reading (3 Year Range):BullishBullishBearish-Extreme
NET POSITION MOVEMENT INDEX:
– 6-Week Change in Strength Index:-2.14.7-5.9


US Treasury Bonds Futures:

US Year Treasury Notes Long Bonds Futures COT ChartThe US Treasury Bonds large speculator standing this week recorded a net position of -66,551 contracts in the data reported through Tuesday. This was a weekly advance of 32,098 contracts from the previous week which had a total of -98,649 net contracts.

This week’s current strength score (the trader positioning range over the past three years, measured from 0 to 100) shows the speculators are currently Bullish with a score of 69.5 percent. The commercials are Bearish with a score of 47.6 percent and the small traders (not shown in chart) are Bearish with a score of 37.0 percent.

US Treasury Bonds StatisticsSPECULATORSCOMMERCIALSSMALL TRADERS
– Percent of Open Interest Longs:9.974.313.7
– Percent of Open Interest Shorts:15.367.215.3
– Net Position:-66,55186,248-19,697
– Gross Longs:120,942908,174167,921
– Gross Shorts:187,493821,926187,618
– Long to Short Ratio:0.6 to 11.1 to 10.9 to 1
NET POSITION TREND:
– COT Index Score (3 Year Range Pct):69.547.637.0
– COT Index Reading (3 Year Range):BullishBearishBearish
NET POSITION MOVEMENT INDEX:
– 6-Week Change in Strength Index:13.5-6.5-13.6


Ultra US Treasury Bonds Futures:

Ultra US Year Treasury Notes Long Bonds Futures COT ChartThe Ultra US Treasury Bonds large speculator standing this week recorded a net position of -313,414 contracts in the data reported through Tuesday. This was a weekly rise of 220 contracts from the previous week which had a total of -313,634 net contracts.

This week’s current strength score (the trader positioning range over the past three years, measured from 0 to 100) shows the speculators are currently Bullish with a score of 57.4 percent. The commercials are Bullish with a score of 70.3 percent and the small traders (not shown in chart) are Bearish with a score of 25.4 percent.

Ultra US Treasury Bonds StatisticsSPECULATORSCOMMERCIALSSMALL TRADERS
– Percent of Open Interest Longs:4.582.112.4
– Percent of Open Interest Shorts:30.356.012.8
– Net Position:-313,414317,409-3,995
– Gross Longs:54,907998,802151,411
– Gross Shorts:368,321681,393155,406
– Long to Short Ratio:0.1 to 11.5 to 11.0 to 1
NET POSITION TREND:
– COT Index Score (3 Year Range Pct):57.470.325.4
– COT Index Reading (3 Year Range):BullishBullishBearish
NET POSITION MOVEMENT INDEX:
– 6-Week Change in Strength Index:-12.717.5-3.4


Article By InvestMacroReceive our weekly COT Reports by Email

*COT Report: The COT data, released weekly to the public each Friday, is updated through the most recent Tuesday (data is 3 days old) and shows a quick view of how large speculators or non-commercials (for-profit traders) were positioned in the futures markets.

The CFTC categorizes trader positions according to commercial hedgers (traders who use futures contracts for hedging as part of the business), non-commercials (large traders who speculate to realize trading profits) and nonreportable traders (usually small traders/speculators) as well as their open interest (contracts open in the market at time of reporting).

Find CFTC criteria here: (http://www.cftc.gov/MarketReports/CommitmentsofTraders/ExplanatoryNotes/index.htm).
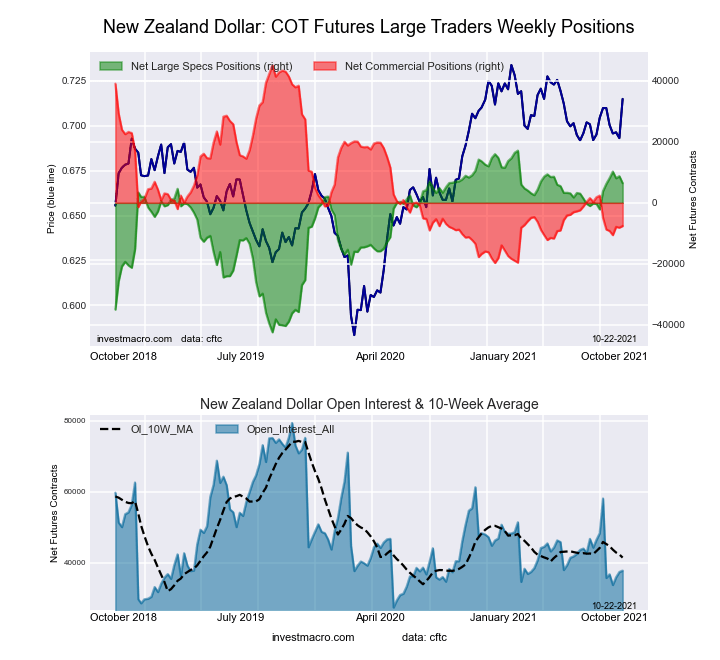
COT Metals Charts: Speculators Palladium futures bets remain bearish for 8th week

By InvestMacro.com COT Home | Data Tables | Data Downloads | Newsletter

Here are the latest charts and statistics for the Commitment of Traders (COT) data published by the Commodities Futures Trading Commission (CFTC).
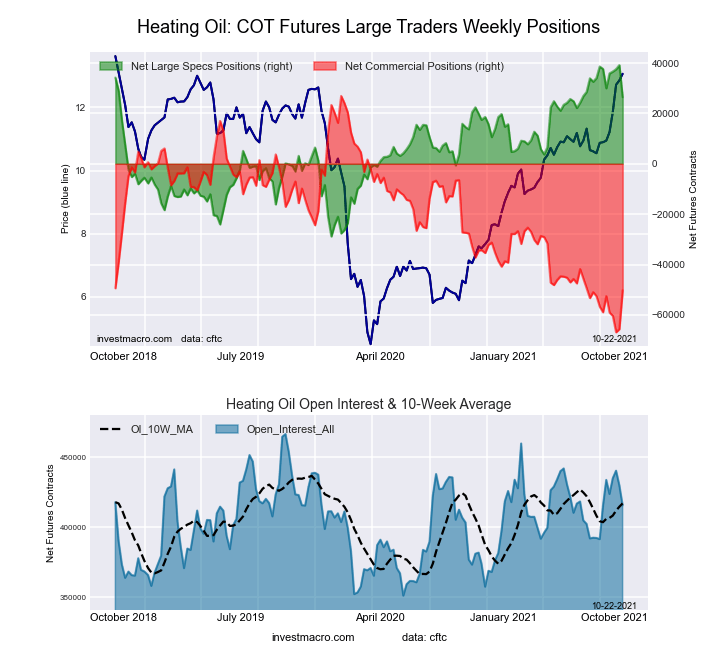
The latest COT data is updated through Tuesday October 12th 2021 and shows a quick view of how large traders (for-profit speculators and commercial entities) were positioned in the futures markets.
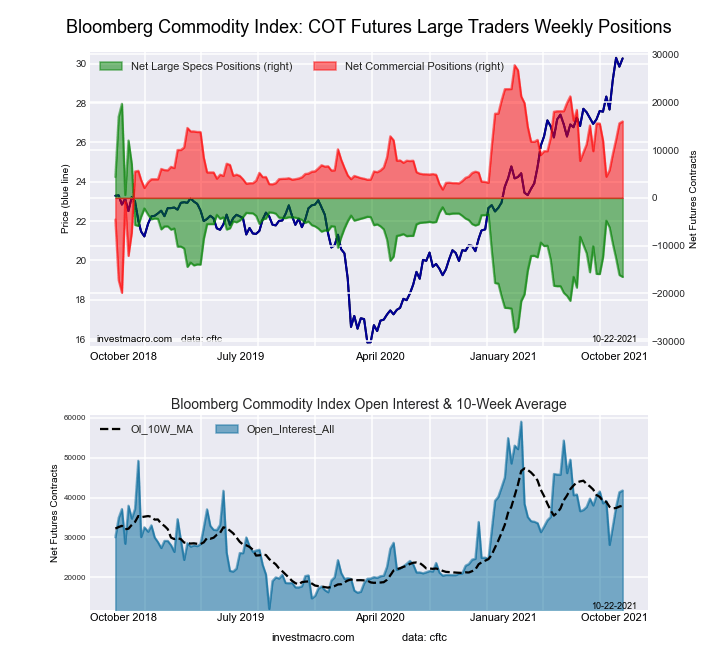
Highlighting this week’s COT Metals data is the Palladium speculator contracts which are now in their eighth straight week of bearish levels. Palladium has seen its fortunes fall in the second half of 2021 after a multi-year uptrend brought prices to all-time high levels in May of 2021. Palladium prices have now cooled off by approximately 30 percent since May and has prompted speculators to take on bearish positions (negative net contracts). Amazingly, when spec contracts went negative on August 24th, this marked the first negative net speculator position since February 25th of 2003, according to the CFTC data, a span of more than eighteen years.


Data Snapshot of Commodity Market Traders | Columns Legend
Oct-12-2021OIOI-IndexSpec-NetSpec-IndexCom-NetCOM-IndexSmalls-NetSmalls-Index
WTI Crude2,231,22748404,77641-453,6844648,90884
Gold484,38221185,53954-207,6144622,07533
Silver139,403617,98740-30,2926912,30511
Copper194,8172322,48159-25,867423,38645
Palladium9,29613-2,49642,62595-12937
Platinum59,3442110,91918-16,756855,83743
Natural Gas1,314,02240-130,9023991,2016039,70179
Brent205,52144-34,9245729,563375,36182
Heating Oil429,9086839,137100-65,644126,50790
Soybeans759,1013541,99041-9,66564-32,32518
Corn1,400,3774279,28866-223,33640-55,95211
Coffee305,1416269,08599-73,80824,72321
Sugar891,67225246,18887-294,6741248,48668
Wheat385,20423-4,5344312,96953-8,43561


Gold Comex Futures:

Federal Funds 30-Day Bonds Futures COT ChartThe Gold Comex Futures large speculator standing this week reached a net position of 185,539 contracts in the data reported through Tuesday. This was a weekly gain of 2,957 contracts from the previous week which had a total of 182,582 net contracts.

This week’s current strength score (the trader positioning range over the past three years, measured from 0 to 100) shows the speculators are currently Bullish with a score of 53.7 percent. The commercials are Bearish with a score of 46.4 percent and the small traders (not shown in chart) are Bearish with a score of 33.2 percent.

Gold Futures StatisticsSPECULATORSCOMMERCIALSSMALL TRADERS
– Percent of Open Interest Longs:61.622.99.0
– Percent of Open Interest Shorts:23.365.74.5
– Net Position:185,539-207,61422,075
– Gross Longs:298,503110,69743,819
– Gross Shorts:112,964318,31121,744
– Long to Short Ratio:2.6 to 10.3 to 12.0 to 1
NET POSITION TREND:
– COT Index Score (3 Year Range Pct):53.746.433.2
– COT Index Reading (3 Year Range):BullishBearishBearish
NET POSITION MOVEMENT INDEX:
– 6-Week Change in Strength Index:-8.58.6-4.9


Silver Comex Futures:

2-Year Treasury Bonds Futures COT ChartThe Silver Comex Futures large speculator standing this week reached a net position of 17,987 contracts in the data reported through Tuesday. This was a weekly lift of 1,608 contracts from the previous week which had a total of 16,379 net contracts.

This week’s current strength score (the trader positioning range over the past three years, measured from 0 to 100) shows the speculators are currently Bearish with a score of 40.3 percent. The commercials are Bullish with a score of 69.2 percent and the small traders (not shown in chart) are Bearish-Extreme with a score of 11.4 percent.

Silver Futures StatisticsSPECULATORSCOMMERCIALSSMALL TRADERS
– Percent of Open Interest Longs:45.530.918.0
– Percent of Open Interest Shorts:32.652.69.2
– Net Position:17,987-30,29212,305
– Gross Longs:63,48843,05525,151
– Gross Shorts:45,50173,34712,846
– Long to Short Ratio:1.4 to 10.6 to 12.0 to 1
NET POSITION TREND:
– COT Index Score (3 Year Range Pct):40.369.211.4
– COT Index Reading (3 Year Range):BearishBullishBearish-Extreme
NET POSITION MOVEMENT INDEX:
– 6-Week Change in Strength Index:-4.37.5-20.1


Copper Grade #1 Futures:

5-Year Treasury Bonds Futures COT ChartThe Copper Grade #1 Futures large speculator standing this week reached a net position of 22,481 contracts in the data reported through Tuesday. This was a weekly increase of 8,064 contracts from the previous week which had a total of 14,417 net contracts.

This week’s current strength score (the trader positioning range over the past three years, measured from 0 to 100) shows the speculators are currently Bullish with a score of 58.6 percent. The commercials are Bearish with a score of 41.7 percent and the small traders (not shown in chart) are Bearish with a score of 44.9 percent.

Copper Futures StatisticsSPECULATORSCOMMERCIALSSMALL TRADERS
– Percent of Open Interest Longs:43.038.48.0
– Percent of Open Interest Shorts:31.551.76.3
– Net Position:22,481-25,8673,386
– Gross Longs:83,81674,87815,582
– Gross Shorts:61,335100,74512,196
– Long to Short Ratio:1.4 to 10.7 to 11.3 to 1
NET POSITION TREND:
– COT Index Score (3 Year Range Pct):58.641.744.9
– COT Index Reading (3 Year Range):BullishBearishBearish
NET POSITION MOVEMENT INDEX:
– 6-Week Change in Strength Index:0.40.8-10.4


Platinum Futures:

10-Year Treasury Notes Bonds Futures COT ChartThe Platinum Futures large speculator standing this week reached a net position of 10,919 contracts in the cot data reported through Tuesday. This was a weekly advance of 5,404 contracts from the previous week which had a total of 5,515 net contracts.

This week’s current strength score (the trader positioning range over the past three years, measured from 0 to 100) shows the speculators are currently Bearish-Extreme with a score of 18.1 percent. The commercials are Bullish-Extreme with a score of 85.1 percent and the small traders (not shown in chart) are Bearish with a score of 43.4 percent.

Platinum Futures StatisticsSPECULATORSCOMMERCIALSSMALL TRADERS
– Percent of Open Interest Longs:53.428.515.2
– Percent of Open Interest Shorts:35.056.85.4
– Net Position:10,919-16,7565,837
– Gross Longs:31,71116,9429,038
– Gross Shorts:20,79233,6983,201
– Long to Short Ratio:1.5 to 10.5 to 12.8 to 1
NET POSITION TREND:
– COT Index Score (3 Year Range Pct):18.185.143.4
– COT Index Reading (3 Year Range):Bearish-ExtremeBullish-ExtremeBearish
NET POSITION MOVEMENT INDEX:
– 6-Week Change in Strength Index:4.1-3.8-2.9


Palladium Futures:

Ultra 10-Year Treasury Notes Bonds Futures COT ChartThe Palladium Futures large speculator standing this week reached a net position of -2,496 contracts in the data reported through Tuesday. This was a weekly lift of 734 contracts from the previous week which had a total of -3,230 net contracts.

This week’s current strength score (the trader positioning range over the past three years, measured from 0 to 100) shows the speculators are currently Bearish-Extreme with a score of 4.1 percent. The commercials are Bullish-Extreme with a score of 94.8 percent and the small traders (not shown in chart) are Bearish with a score of 37.0 percent.

Palladium Futures StatisticsSPECULATORSCOMMERCIALSSMALL TRADERS
– Percent of Open Interest Longs:31.451.813.7
– Percent of Open Interest Shorts:58.323.615.1
– Net Position:-2,4962,625-129
– Gross Longs:2,9204,8151,272
– Gross Shorts:5,4162,1901,401
– Long to Short Ratio:0.5 to 12.2 to 10.9 to 1
NET POSITION TREND:
– COT Index Score (3 Year Range Pct):4.194.837.0
– COT Index Reading (3 Year Range):Bearish-ExtremeBullish-ExtremeBearish
NET POSITION MOVEMENT INDEX:
– 6-Week Change in Strength Index:-12.713.4-13.0


Article By InvestMacro.comReceive our weekly COT Reports by Email

*COT Report: The COT data, released weekly to the public each Friday, is updated through the most recent Tuesday (data is 3 days old) and shows a quick view of how large speculators or non-commercials (for-profit traders) were positioned in the futures markets.

The CFTC categorizes trader positions according to commercial hedgers (traders who use futures contracts for hedging as part of the business), non-commercials (large traders who speculate to realize trading profits) and nonreportable traders (usually small traders/speculators).

Find CFTC criteria here: (http://www.cftc.gov/MarketReports/CommitmentsofTraders/ExplanatoryNotes/index.htm).