
By InvestMacro.com COT Home | Data Tables | Data Downloads | COT Newsletter
Here are the latest charts and statistics for the Commitment of Traders (COT) data published by the Commodities Futures Trading Commission (CFTC).
The latest COT data is updated through Tuesday October 19th 2021 and shows a quick view of how large traders (for-profit speculators and commercial entities) were positioned in the futures markets.
Highlighting this week’s COT Metals data was a surge in speculator’s Copper bullish bets which jumped by over +18,000 net contracts. Copper speculative positions rose by the largest one-week amount in the past ninety-seven weeks, dating all the way back to December 10th of 2017 when bullish bets increased by +20,559 contracts. This week’s positive sentiment has pushed the current speculator bullish positioning to a total of +40,584 contracts and its highest standing since May 11th, a span of twenty-three weeks. Overall, Copper speculator bets have now remained in bullish territory for seventy-two straight weeks since turning bullish on June 9th of 2020.
| Oct-19-2021 | OI | OI-Index | Spec-Net | Spec-Index | Com-Net | COM-Index | Smalls-Net | Smalls-Index |
|---|---|---|---|---|---|---|---|---|
| WTI Crude | 2,205,089 | 44 | 429,594 | 49 | -473,181 | 41 | 43,587 | 76 |
| Gold | 485,974 | 22 | 193,349 | 56 | -219,190 | 43 | 25,841 | 43 |
| Silver | 143,664 | 10 | 30,356 | 53 | -44,580 | 55 | 14,224 | 23 |
| Copper | 225,225 | 44 | 40,584 | 72 | -46,208 | 28 | 5,624 | 58 |
| Palladium | 9,061 | 12 | -2,416 | 5 | 2,355 | 93 | 61 | 48 |
| Platinum | 58,570 | 19 | 14,844 | 24 | -21,176 | 79 | 6,332 | 50 |
| Natural Gas | 1,318,498 | 48 | -131,070 | 39 | 86,574 | 58 | 44,496 | 92 |
| Brent | 202,714 | 41 | -28,018 | 73 | 23,413 | 23 | 4,605 | 76 |
| Heating Oil | 415,556 | 56 | 26,441 | 81 | -50,250 | 18 | 23,809 | 81 |
| Soybeans | 750,939 | 33 | 43,541 | 41 | -9,575 | 64 | -33,966 | 15 |
| Corn | 1,404,126 | 5 | 277,029 | 65 | -218,172 | 41 | -58,857 | 9 |
| Coffee | 304,874 | 62 | 68,889 | 99 | -73,100 | 3 | 4,211 | 17 |
| Sugar | 871,316 | 21 | 211,550 | 80 | -243,564 | 22 | 32,014 | 47 |
| Wheat | 394,949 | 27 | -8,566 | 40 | 18,180 | 59 | -9,614 | 56 |
Gold Comex Futures:
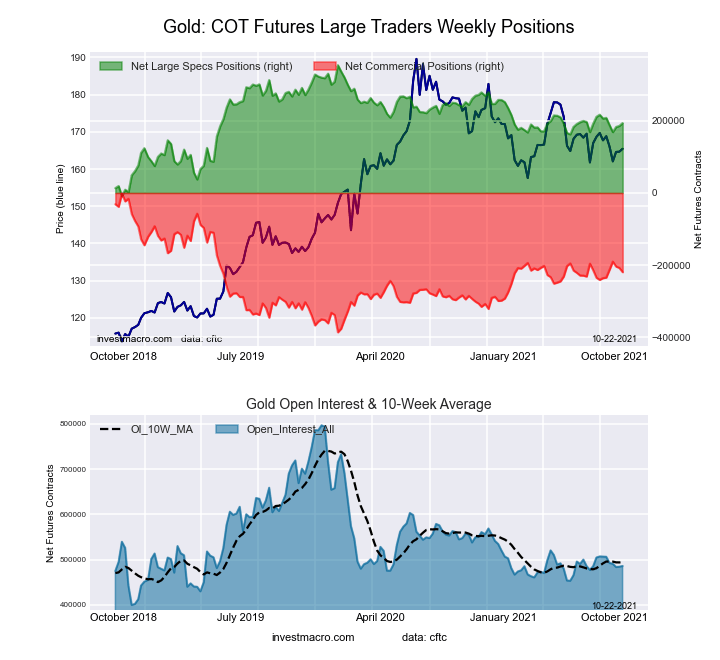 The Gold Comex Futures large speculator standing this week was a net position of 193,349 contracts in the data reported through Tuesday. This was a weekly gain of 7,810 contracts from the previous week which had a total of 185,539 net contracts.
Free Reports:
 Download Our Metatrader 4 Indicators – Put Our Free MetaTrader 4 Custom Indicators on your charts when you join our Weekly Newsletter
 Get our Weekly Commitment of Traders Reports - See where the biggest traders (Hedge Funds and Commercial Hedgers) are positioned in the futures markets on a weekly basis.
This week’s current strength score (the trader positioning range over the past three years, measured from 0 to 100) shows the speculators are currently Bullish with a score of 55.8 percent. The commercials are Bearish with a score of 43.4 percent and the small traders (not shown in chart) are Bearish with a score of 43.0 percent.
| Gold Futures Statistics | SPECULATORS | COMMERCIALS | SMALL TRADERS |
| – Percent of Open Interest Longs: | 61.7 | 22.0 | 9.5 |
| – Percent of Open Interest Shorts: | 21.9 | 67.1 | 4.2 |
| – Net Position: | 193,349 | -219,190 | 25,841 |
| – Gross Longs: | 299,882 | 107,128 | 46,194 |
| – Gross Shorts: | 106,533 | 326,318 | 20,353 |
| – Long to Short Ratio: | 2.8 to 1 | 0.3 to 1 | 2.3 to 1 |
| NET POSITION TREND: | |||
| – COT Index Score (3 Year Range Pct): | 55.8 | 43.4 | 43.0 |
| – COT Index Reading (3 Year Range): | Bullish | Bearish | Bearish |
| NET POSITION MOVEMENT INDEX: | |||
| – 6-Week Change in Strength Index: | -3.5 | 4.3 | -10.2 |
Silver Comex Futures:
 The Silver Comex Futures large speculator standing this week was a net position of 30,356 contracts in the data reported through Tuesday. This was a weekly rise of 12,369 contracts from the previous week which had a total of 17,987 net contracts.
This week’s current strength score (the trader positioning range over the past three years, measured from 0 to 100) shows the speculators are currently Bullish with a score of 52.6 percent. The commercials are Bullish with a score of 55.2 percent and the small traders (not shown in chart) are Bearish with a score of 23.0 percent.
| Silver Futures Statistics | SPECULATORS | COMMERCIALS | SMALL TRADERS |
| – Percent of Open Interest Longs: | 46.3 | 28.2 | 18.9 |
| – Percent of Open Interest Shorts: | 25.2 | 59.3 | 9.0 |
| – Net Position: | 30,356 | -44,580 | 14,224 |
| – Gross Longs: | 66,572 | 40,556 | 27,203 |
| – Gross Shorts: | 36,216 | 85,136 | 12,979 |
| – Long to Short Ratio: | 1.8 to 1 | 0.5 to 1 | 2.1 to 1 |
| NET POSITION TREND: | |||
| – COT Index Score (3 Year Range Pct): | 52.6 | 55.2 | 23.0 |
| – COT Index Reading (3 Year Range): | Bullish | Bullish | Bearish |
| NET POSITION MOVEMENT INDEX: | |||
| – 6-Week Change in Strength Index: | 1.8 | -1.3 | -2.8 |
Copper Grade #1 Futures:
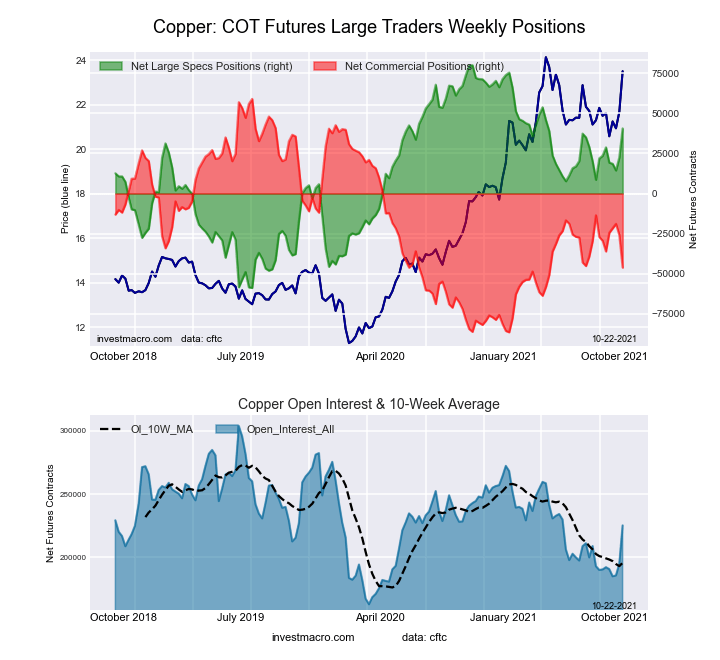 The Copper Grade #1 Futures large speculator standing this week was a net position of 40,584 contracts in the data reported through Tuesday. This was a weekly advance of 18,103 contracts from the previous week which had a total of 22,481 net contracts.
This week’s current strength score (the trader positioning range over the past three years, measured from 0 to 100) shows the speculators are currently Bullish with a score of 71.6 percent. The commercials are Bearish with a score of 27.7 percent and the small traders (not shown in chart) are Bullish with a score of 57.8 percent.
| Copper Futures Statistics | SPECULATORS | COMMERCIALS | SMALL TRADERS |
| – Percent of Open Interest Longs: | 46.0 | 35.1 | 8.5 |
| – Percent of Open Interest Shorts: | 27.9 | 55.6 | 6.0 |
| – Net Position: | 40,584 | -46,208 | 5,624 |
| – Gross Longs: | 103,496 | 79,080 | 19,249 |
| – Gross Shorts: | 62,912 | 125,288 | 13,625 |
| – Long to Short Ratio: | 1.6 to 1 | 0.6 to 1 | 1.4 to 1 |
| NET POSITION TREND: | |||
| – COT Index Score (3 Year Range Pct): | 71.6 | 27.7 | 57.8 |
| – COT Index Reading (3 Year Range): | Bullish | Bearish | Bullish |
| NET POSITION MOVEMENT INDEX: | |||
| – 6-Week Change in Strength Index: | 12.2 | -11.5 | -1.4 |
Platinum Futures:
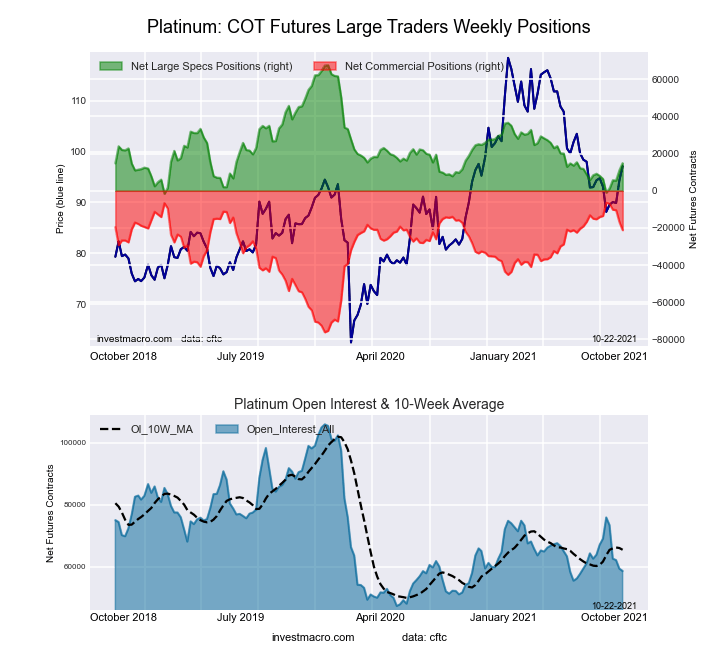 The Platinum Futures large speculator standing this week was a net position of 14,844 contracts in the data reported through Tuesday. This was a weekly lift of 3,925 contracts from the previous week which had a total of 10,919 net contracts.
This week’s current strength score (the trader positioning range over the past three years, measured from 0 to 100) shows the speculators are currently Bearish with a score of 23.8 percent. The commercials are Bullish with a score of 78.8 percent and the small traders (not shown in chart) are Bullish with a score of 50.4 percent.
| Platinum Futures Statistics | SPECULATORS | COMMERCIALS | SMALL TRADERS |
| – Percent of Open Interest Longs: | 52.8 | 27.9 | 15.8 |
| – Percent of Open Interest Shorts: | 27.4 | 64.1 | 5.0 |
| – Net Position: | 14,844 | -21,176 | 6,332 |
| – Gross Longs: | 30,917 | 16,346 | 9,238 |
| – Gross Shorts: | 16,073 | 37,522 | 2,906 |
| – Long to Short Ratio: | 1.9 to 1 | 0.4 to 1 | 3.2 to 1 |
| NET POSITION TREND: | |||
| – COT Index Score (3 Year Range Pct): | 23.8 | 78.8 | 50.4 |
| – COT Index Reading (3 Year Range): | Bearish | Bullish | Bullish |
| NET POSITION MOVEMENT INDEX: | |||
| – 6-Week Change in Strength Index: | 12.3 | -11.0 | -11.5 |
Palladium Futures:
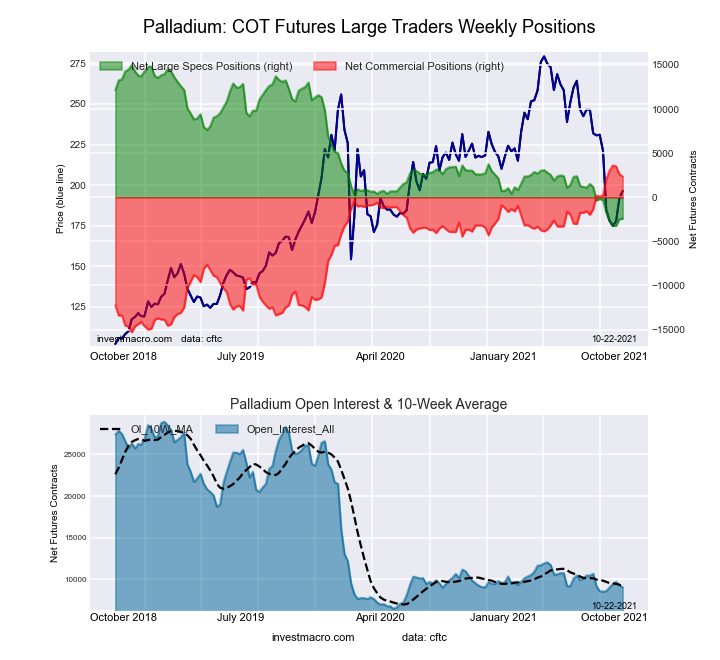 The Palladium Futures large speculator standing this week was a net position of -2,416 contracts in the data reported through Tuesday. This was a weekly advance of 80 contracts from the previous week which had a total of -2,496 net contracts.
This week’s current strength score (the trader positioning range over the past three years, measured from 0 to 100) shows the speculators are currently Bearish-Extreme with a score of 4.6 percent. The commercials are Bullish-Extreme with a score of 93.3 percent and the small traders (not shown in chart) are Bearish with a score of 48.2 percent.
| Palladium Futures Statistics | SPECULATORS | COMMERCIALS | SMALL TRADERS |
| – Percent of Open Interest Longs: | 31.8 | 49.8 | 15.1 |
| – Percent of Open Interest Shorts: | 58.5 | 23.8 | 14.5 |
| – Net Position: | -2,416 | 2,355 | 61 |
| – Gross Longs: | 2,882 | 4,515 | 1,372 |
| – Gross Shorts: | 5,298 | 2,160 | 1,311 |
| – Long to Short Ratio: | 0.5 to 1 | 2.1 to 1 | 1.0 to 1 |
| NET POSITION TREND: | |||
| – COT Index Score (3 Year Range Pct): | 4.6 | 93.3 | 48.2 |
| – COT Index Reading (3 Year Range): | Bearish-Extreme | Bullish-Extreme | Bearish |
| NET POSITION MOVEMENT INDEX: | |||
| – 6-Week Change in Strength Index: | -11.4 | 11.2 | -2.2 |
Article By InvestMacro.com – Receive our weekly COT Reports by Email
*COT Report: The COT data, released weekly to the public each Friday, is updated through the most recent Tuesday (data is 3 days old) and shows a quick view of how large speculators or non-commercials (for-profit traders) were positioned in the futures markets.
The CFTC categorizes trader positions according to commercial hedgers (traders who use futures contracts for hedging as part of the business), non-commercials (large traders who speculate to realize trading profits) and nonreportable traders (usually small traders/speculators).
Find CFTC criteria here: (http://www.cftc.gov/MarketReports/CommitmentsofTraders/ExplanatoryNotes/index.htm).

- The Bank of Canada kept its interest rate unchanged. Platinum prices reached a three‑week high Jul 16, 2026
- Stock indices rose after the release of US inflation data. China’s GDP slowed sharply Jul 15, 2026
- GBP/USD Awaits Political News: What Will Happen Next Jul 15, 2026
- USD/JPY Holds at Highs: Pressure Lingers on Yen Jul 14, 2026
- Oil prices jumped 4% amid a new wave of escalation between the US and Iran Jul 13, 2026
- EUR/USD: US Inflation Will Determine Everything Jul 13, 2026
- COT Metals Charts: Weekly Speculator Bets see small gains for Silver & Gold Jul 12, 2026
- COT Bonds Charts: Speculator Bets led by SOFR 3-Months & 2-Year Bonds Jul 12, 2026
- COT Energy Charts: Weekly Speculator Changes led by Brent Oil Jul 12, 2026
- COT Soft Commodities Charts: Weekly Speculator Changes led by Sugar, Corn & Soybeans Jul 12, 2026