
By InvestMacro.com COT Home | Data Tables | Data Downloads | Newsletter
Here are the latest charts and statistics for the Commitment of Traders (COT) data published by the Commodities Futures Trading Commission (CFTC).
The latest COT data is updated through Tuesday October 19th 2021 and shows a quick view of how large traders (for-profit speculators and commercial entities) were positioned in the futures markets.
| Oct-19-2021 | OI | OI-Index | Spec-Net | Spec-Index | Com-Net | COM-Index | Smalls-Net | Smalls-Index |
|---|---|---|---|---|---|---|---|---|
| S&P500-Mini | 2,386,587 | 0 | 67,619 | 65 | -85,275 | 51 | 17,656 | 30 |
| Nikkei 225 | 16,977 | 8 | 1,212 | 62 | -3,790 | 39 | 2,578 | 60 |
| Nasdaq-Mini | 237,365 | 35 | -3,057 | 73 | 10,428 | 33 | -7,371 | 27 |
| DowJones-Mini | 106,040 | 78 | 3,631 | 40 | -8,168 | 52 | 4,537 | 63 |
| VIX | 361,391 | 45 | -86,768 | 50 | 93,607 | 51 | -6,839 | 30 |
| Nikkei 225 Yen | 54,615 | 35 | 1,144 | 25 | 28,926 | 100 | -30,070 | 21 |
VIX Volatility Futures:
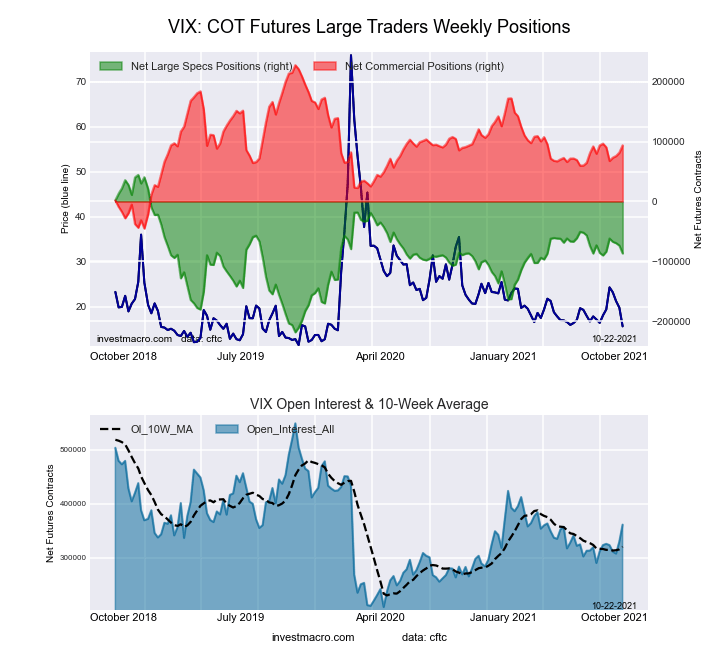 The VIX Volatility large speculator standing this week totaled a net position of -86,768 contracts in the data reported through Tuesday. This was a weekly reduction of -13,199 contracts from the previous week which had a total of -73,569 net contracts.
This week’s current strength score (the trader positioning range over the past three years, measured from 0 to 100) shows the speculators are currently Bullish with a score of 50.1 percent. The commercials are Bullish with a score of 50.9 percent and the small traders (not shown in chart) are Bearish with a score of 30.5 percent.
Free Reports:
 Get our Weekly Commitment of Traders Reports - See where the biggest traders (Hedge Funds and Commercial Hedgers) are positioned in the futures markets on a weekly basis.
 Sign Up for Our Stock Market Newsletter – Get updated on News, Charts & Rankings of Public Companies when you join our Stocks Newsletter
| VIX Volatility Futures Statistics | SPECULATORS | COMMERCIALS | SMALL TRADERS |
| – Percent of Open Interest Longs: | 16.8 | 53.1 | 6.3 |
| – Percent of Open Interest Shorts: | 40.8 | 27.2 | 8.2 |
| – Net Position: | -86,768 | 93,607 | -6,839 |
| – Gross Longs: | 60,834 | 191,937 | 22,690 |
| – Gross Shorts: | 147,602 | 98,330 | 29,529 |
| – Long to Short Ratio: | 0.4 to 1 | 2.0 to 1 | 0.8 to 1 |
| NET POSITION TREND: | |||
| – COT Index Score (3 Year Range Pct): | 50.1 | 50.9 | 30.5 |
| – COT Index Reading (3 Year Range): | Bullish | Bullish | Bearish |
| NET POSITION MOVEMENT INDEX: | |||
| – 6-Week Change in Strength Index: | 1.3 | -1.0 | -1.7 |
S&P500 Mini Futures:
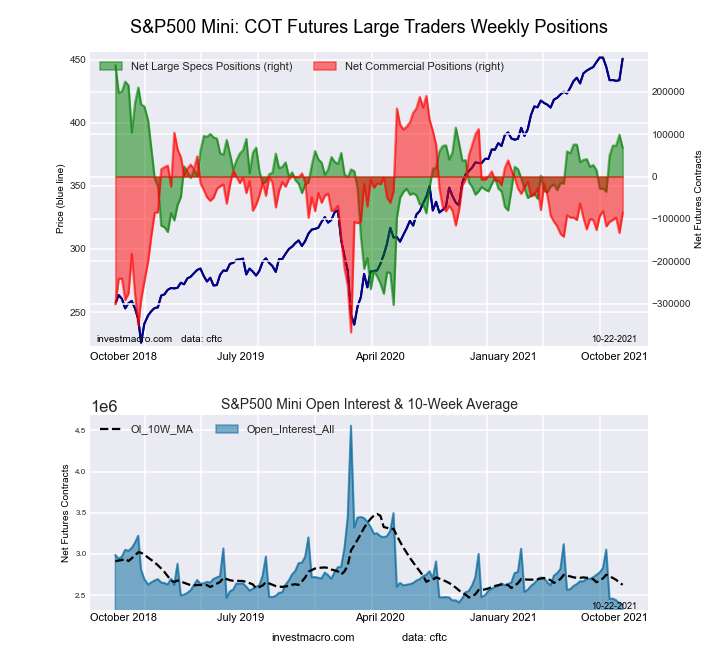 The S&P500 Mini large speculator standing this week totaled a net position of 67,619 contracts in the data reported through Tuesday. This was a weekly lowering of -31,164 contracts from the previous week which had a total of 98,783 net contracts.
This week’s current strength score (the trader positioning range over the past three years, measured from 0 to 100) shows the speculators are currently Bullish with a score of 65.5 percent. The commercials are Bullish with a score of 50.6 percent and the small traders (not shown in chart) are Bearish with a score of 30.1 percent.
| S&P500 Mini Futures Statistics | SPECULATORS | COMMERCIALS | SMALL TRADERS |
| – Percent of Open Interest Longs: | 14.7 | 72.0 | 10.8 |
| – Percent of Open Interest Shorts: | 11.8 | 75.6 | 10.1 |
| – Net Position: | 67,619 | -85,275 | 17,656 |
| – Gross Longs: | 350,155 | 1,718,651 | 258,179 |
| – Gross Shorts: | 282,536 | 1,803,926 | 240,523 |
| – Long to Short Ratio: | 1.2 to 1 | 1.0 to 1 | 1.1 to 1 |
| NET POSITION TREND: | |||
| – COT Index Score (3 Year Range Pct): | 65.5 | 50.6 | 30.1 |
| – COT Index Reading (3 Year Range): | Bullish | Bullish | Bearish |
| NET POSITION MOVEMENT INDEX: | |||
| – 6-Week Change in Strength Index: | 16.9 | -0.7 | -19.3 |
Dow Jones Mini Futures:
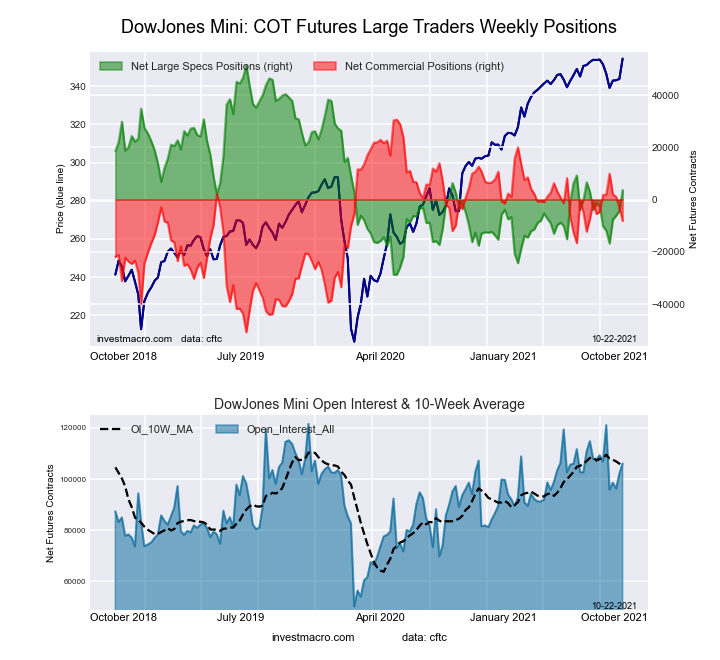 The Dow Jones Mini large speculator standing this week totaled a net position of 3,631 contracts in the data reported through Tuesday. This was a weekly rise of 7,914 contracts from the previous week which had a total of -4,283 net contracts.
This week’s current strength score (the trader positioning range over the past three years, measured from 0 to 100) shows the speculators are currently Bearish with a score of 40.4 percent. The commercials are Bullish with a score of 52.4 percent and the small traders (not shown in chart) are Bullish with a score of 62.7 percent.
| Dow Jones Mini Futures Statistics | SPECULATORS | COMMERCIALS | SMALL TRADERS |
| – Percent of Open Interest Longs: | 37.8 | 43.5 | 16.4 |
| – Percent of Open Interest Shorts: | 34.4 | 51.2 | 12.1 |
| – Net Position: | 3,631 | -8,168 | 4,537 |
| – Gross Longs: | 40,105 | 46,155 | 17,408 |
| – Gross Shorts: | 36,474 | 54,323 | 12,871 |
| – Long to Short Ratio: | 1.1 to 1 | 0.8 to 1 | 1.4 to 1 |
| NET POSITION TREND: | |||
| – COT Index Score (3 Year Range Pct): | 40.4 | 52.4 | 62.7 |
| – COT Index Reading (3 Year Range): | Bearish | Bullish | Bullish |
| NET POSITION MOVEMENT INDEX: | |||
| – 6-Week Change in Strength Index: | 17.2 | -12.2 | -20.5 |
Nasdaq Mini Futures:
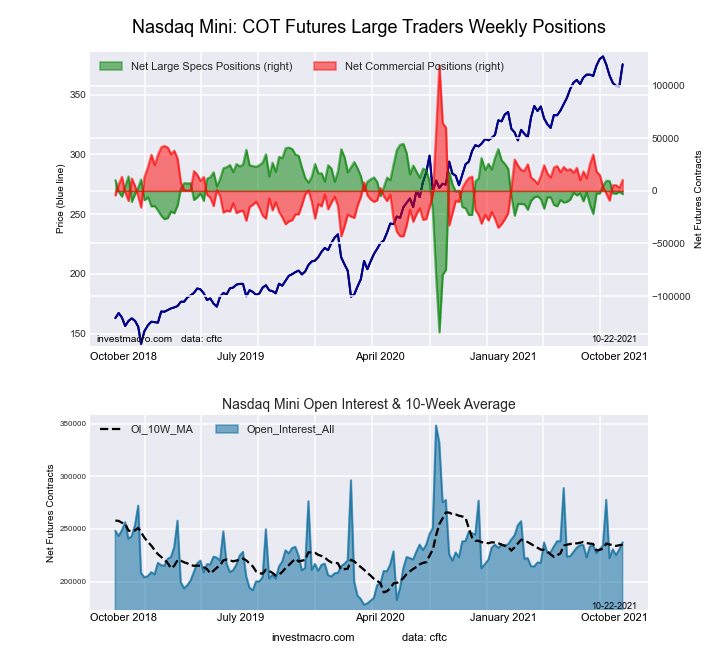 The Nasdaq Mini large speculator standing this week totaled a net position of -3,057 contracts in the data reported through Tuesday. This was a weekly decline of -2,239 contracts from the previous week which had a total of -818 net contracts.
This week’s current strength score (the trader positioning range over the past three years, measured from 0 to 100) shows the speculators are currently Bullish with a score of 73.3 percent. The commercials are Bearish with a score of 32.9 percent and the small traders (not shown in chart) are Bearish with a score of 27.4 percent.
| Nasdaq Mini Futures Statistics | SPECULATORS | COMMERCIALS | SMALL TRADERS |
| – Percent of Open Interest Longs: | 25.5 | 56.9 | 15.4 |
| – Percent of Open Interest Shorts: | 26.8 | 52.5 | 18.5 |
| – Net Position: | -3,057 | 10,428 | -7,371 |
| – Gross Longs: | 60,578 | 135,012 | 36,648 |
| – Gross Shorts: | 63,635 | 124,584 | 44,019 |
| – Long to Short Ratio: | 1.0 to 1 | 1.1 to 1 | 0.8 to 1 |
| NET POSITION TREND: | |||
| – COT Index Score (3 Year Range Pct): | 73.3 | 32.9 | 27.4 |
| – COT Index Reading (3 Year Range): | Bullish | Bearish | Bearish |
| NET POSITION MOVEMENT INDEX: | |||
| – 6-Week Change in Strength Index: | -4.5 | 4.1 | 3.3 |
Russell 2000 Mini Futures:
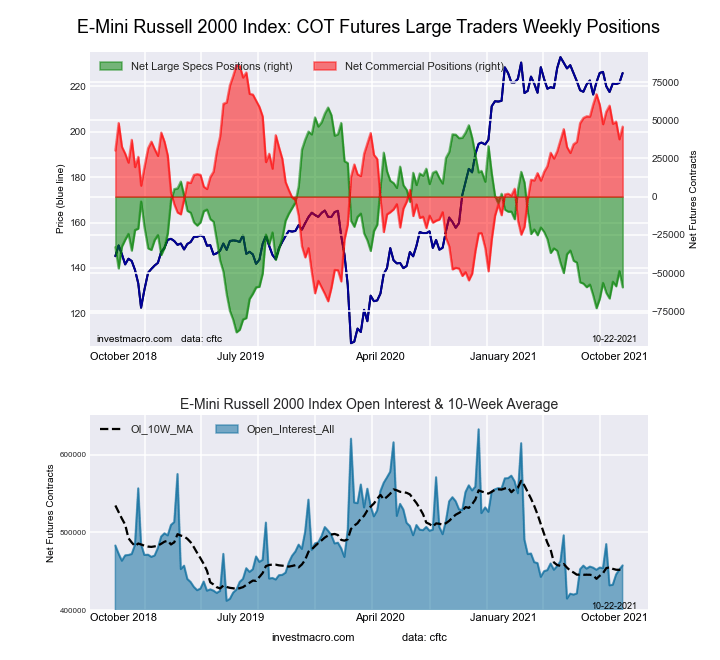 The Russell 2000 Mini large speculator standing this week totaled a net position of -59,321 contracts in the data reported through Tuesday. This was a weekly decrease of -10,615 contracts from the previous week which had a total of -48,706 net contracts.
This week’s current strength score (the trader positioning range over the past three years, measured from 0 to 100) shows the speculators are currently Bearish with a score of 20.0 percent. The commercials are Bullish with a score of 74.0 percent and the small traders (not shown in chart) are Bullish with a score of 71.1 percent.
| Russell 2000 Mini Futures Statistics | SPECULATORS | COMMERCIALS | SMALL TRADERS |
| – Percent of Open Interest Longs: | 12.4 | 79.7 | 7.0 |
| – Percent of Open Interest Shorts: | 25.4 | 69.7 | 4.1 |
| – Net Position: | -59,321 | 45,830 | 13,491 |
| – Gross Longs: | 56,745 | 364,548 | 32,132 |
| – Gross Shorts: | 116,066 | 318,718 | 18,641 |
| – Long to Short Ratio: | 0.5 to 1 | 1.1 to 1 | 1.7 to 1 |
| NET POSITION TREND: | |||
| – COT Index Score (3 Year Range Pct): | 20.0 | 74.0 | 71.1 |
| – COT Index Reading (3 Year Range): | Bearish | Bullish | Bullish |
| NET POSITION MOVEMENT INDEX: | |||
| – 6-Week Change in Strength Index: | -2.0 | -1.0 | 12.6 |
Nikkei Stock Average (USD) Futures:
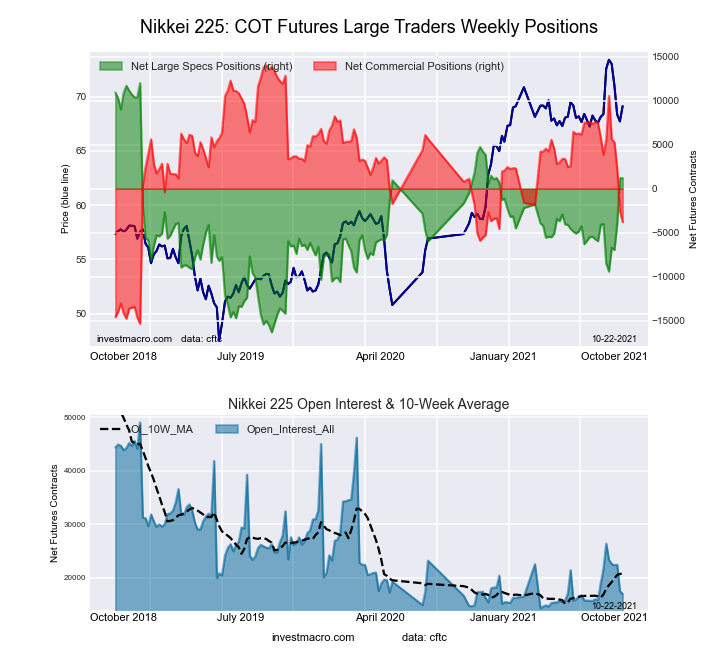 The Nikkei Stock Average (USD) large speculator standing this week totaled a net position of 1,212 contracts in the data reported through Tuesday. This was a weekly gain of 18 contracts from the previous week which had a total of 1,194 net contracts.
This week’s current strength score (the trader positioning range over the past three years, measured from 0 to 100) shows the speculators are currently Bullish with a score of 61.9 percent. The commercials are Bearish with a score of 39.3 percent and the small traders (not shown in chart) are Bullish with a score of 59.9 percent.
| Nikkei Stock Average Futures Statistics | SPECULATORS | COMMERCIALS | SMALL TRADERS |
| – Percent of Open Interest Longs: | 14.0 | 56.2 | 29.6 |
| – Percent of Open Interest Shorts: | 6.8 | 78.6 | 14.5 |
| – Net Position: | 1,212 | -3,790 | 2,578 |
| – Gross Longs: | 2,371 | 9,546 | 5,033 |
| – Gross Shorts: | 1,159 | 13,336 | 2,455 |
| – Long to Short Ratio: | 2.0 to 1 | 0.7 to 1 | 2.1 to 1 |
| NET POSITION TREND: | |||
| – COT Index Score (3 Year Range Pct): | 61.9 | 39.3 | 59.9 |
| – COT Index Reading (3 Year Range): | Bullish | Bearish | Bullish |
| NET POSITION MOVEMENT INDEX: | |||
| – 6-Week Change in Strength Index: | 34.3 | -31.7 | -5.1 |
MSCI EAFE Mini Futures:
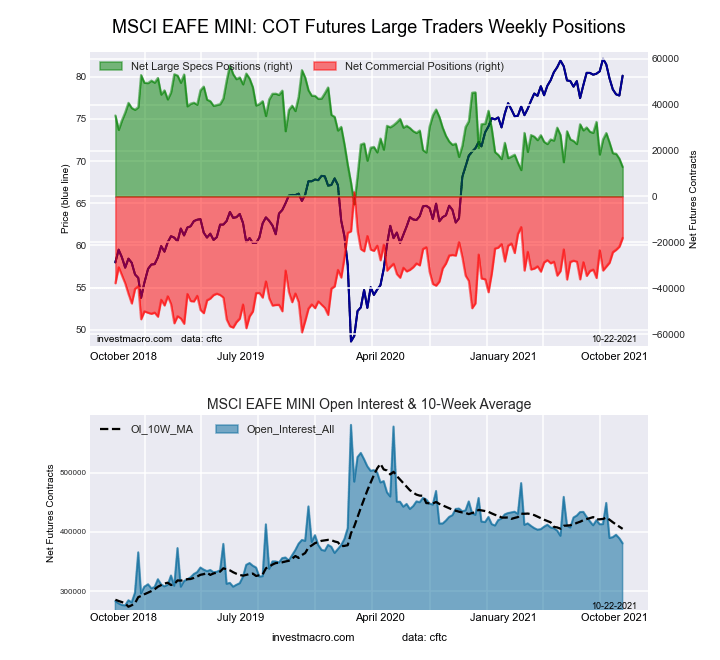 The MSCI EAFE Mini large speculator standing this week totaled a net position of 12,839 contracts in the data reported through Tuesday. This was a weekly decline of -3,615 contracts from the previous week which had a total of 16,454 net contracts.
This week’s current strength score (the trader positioning range over the past three years, measured from 0 to 100) shows the speculators are currently Bearish with a score of 26.8 percent. The commercials are Bullish with a score of 67.3 percent and the small traders (not shown in chart) are Bullish with a score of 63.6 percent.
| MSCI EAFE Mini Futures Statistics | SPECULATORS | COMMERCIALS | SMALL TRADERS |
| – Percent of Open Interest Longs: | 6.8 | 89.8 | 3.0 |
| – Percent of Open Interest Shorts: | 3.4 | 94.6 | 1.7 |
| – Net Position: | 12,839 | -18,092 | 5,253 |
| – Gross Longs: | 25,861 | 342,244 | 11,565 |
| – Gross Shorts: | 13,022 | 360,336 | 6,312 |
| – Long to Short Ratio: | 2.0 to 1 | 0.9 to 1 | 1.8 to 1 |
| NET POSITION TREND: | |||
| – COT Index Score (3 Year Range Pct): | 26.8 | 67.3 | 63.6 |
| – COT Index Reading (3 Year Range): | Bearish | Bullish | Bullish |
| NET POSITION MOVEMENT INDEX: | |||
| – 6-Week Change in Strength Index: | -19.8 | 23.2 | -19.7 |
Article By InvestMacro.com – Receive our weekly COT Reports by Email
*COT Report: The COT data, released weekly to the public each Friday, is updated through the most recent Tuesday (data is 3 days old) and shows a quick view of how large speculators or non-commercials (for-profit traders) were positioned in the futures markets.
The CFTC categorizes trader positions according to commercial hedgers (traders who use futures contracts for hedging as part of the business), non-commercials (large traders who speculate to realize trading profits) and nonreportable traders (usually small traders/speculators).
Find CFTC criteria here: (http://www.cftc.gov/MarketReports/CommitmentsofTraders/ExplanatoryNotes/index.htm).

- The Bank of Canada kept its interest rate unchanged. Platinum prices reached a three‑week high Jul 16, 2026
- Stock indices rose after the release of US inflation data. China’s GDP slowed sharply Jul 15, 2026
- GBP/USD Awaits Political News: What Will Happen Next Jul 15, 2026
- USD/JPY Holds at Highs: Pressure Lingers on Yen Jul 14, 2026
- Oil prices jumped 4% amid a new wave of escalation between the US and Iran Jul 13, 2026
- EUR/USD: US Inflation Will Determine Everything Jul 13, 2026
- COT Metals Charts: Weekly Speculator Bets see small gains for Silver & Gold Jul 12, 2026
- COT Bonds Charts: Speculator Bets led by SOFR 3-Months & 2-Year Bonds Jul 12, 2026
- COT Energy Charts: Weekly Speculator Changes led by Brent Oil Jul 12, 2026
- COT Soft Commodities Charts: Weekly Speculator Changes led by Sugar, Corn & Soybeans Jul 12, 2026