
By InvestMacro.com COT Home | Data Tables | Data Downloads | Newsletter
Here are the latest charts and statistics for the Commitment of Traders (COT) data published by the Commodities Futures Trading Commission (CFTC).
The latest COT data is updated through Tuesday October 19th 2021 and shows a quick view of how large traders (for-profit speculators and commercial entities) were positioned in the futures markets.
Highlighting this week’s COT Soft Commodities data is the speculator’s Coffee bullish bets which dipped by just -196 net contracts. Despite the small shortfall this week, Coffee speculative positions continue to be at an extreme bullish level and had risen for nine straight weeks from August 17th to October 12th to a 20-week high. The speculator strength index score (current levels compared to past three years) has continued to remain in an extreme bullish score (above 80 percent) for 26 weeks in a row and is currently at 98 percent. A potential coffee supply shortage as well as speculative effect on coffee prices can be seen in the rapidly appreciating coffee price (see chart below in coffee section).
| Oct-19-2021 | OI | OI-Index | Spec-Net | Spec-Index | Com-Net | COM-Index | Smalls-Net | Smalls-Index |
|---|---|---|---|---|---|---|---|---|
| WTI Crude | 2,205,089 | 44 | 429,594 | 49 | -473,181 | 41 | 43,587 | 76 |
| Gold | 485,974 | 22 | 193,349 | 56 | -219,190 | 43 | 25,841 | 43 |
| Silver | 143,664 | 10 | 30,356 | 53 | -44,580 | 55 | 14,224 | 23 |
| Copper | 225,225 | 44 | 40,584 | 72 | -46,208 | 28 | 5,624 | 58 |
| Palladium | 9,061 | 12 | -2,416 | 5 | 2,355 | 93 | 61 | 48 |
| Platinum | 58,570 | 19 | 14,844 | 24 | -21,176 | 79 | 6,332 | 50 |
| Natural Gas | 1,318,498 | 48 | -131,070 | 39 | 86,574 | 58 | 44,496 | 92 |
| Brent | 202,714 | 41 | -28,018 | 73 | 23,413 | 23 | 4,605 | 76 |
| Heating Oil | 415,556 | 56 | 26,441 | 81 | -50,250 | 18 | 23,809 | 81 |
| Soybeans | 750,939 | 33 | 43,541 | 41 | -9,575 | 64 | -33,966 | 15 |
| Corn | 1,404,126 | 5 | 277,029 | 65 | -218,172 | 41 | -58,857 | 9 |
| Coffee | 304,874 | 62 | 68,889 | 99 | -73,100 | 3 | 4,211 | 17 |
| Sugar | 871,316 | 21 | 211,550 | 80 | -243,564 | 22 | 32,014 | 47 |
| Wheat | 394,949 | 27 | -8,566 | 40 | 18,180 | 59 | -9,614 | 56 |
CORN Futures:
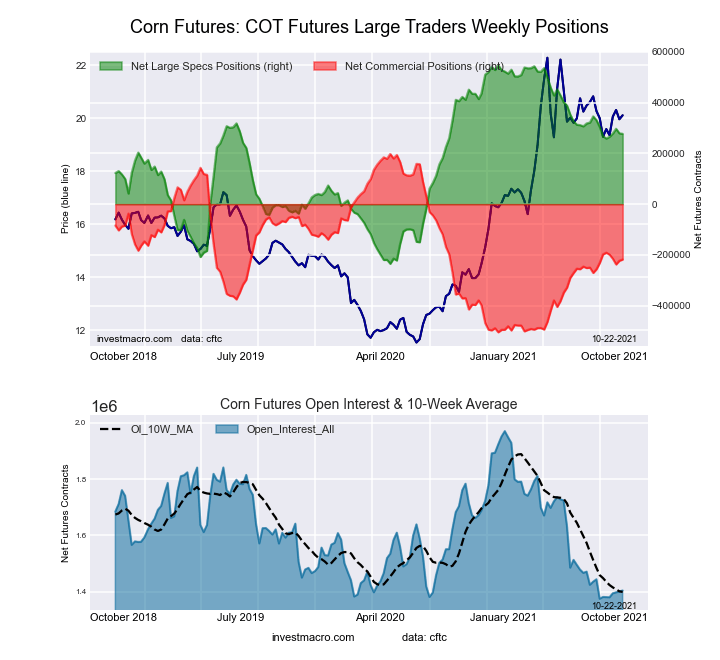 The CORN large speculator standing this week resulted in a net position of 277,029 contracts in the data reported through Tuesday. This was a weekly reduction of -2,259 contracts from the previous week which had a total of 279,288 net contracts.
Free Reports:
 Sign Up for Our Stock Market Newsletter – Get updated on News, Charts & Rankings of Public Companies when you join our Stocks Newsletter
 Get our Weekly Commitment of Traders Reports - See where the biggest traders (Hedge Funds and Commercial Hedgers) are positioned in the futures markets on a weekly basis.
This week’s current strength score (the trader positioning range over the past three years, measured from 0 to 100) shows the speculators are currently Bullish with a score of 65.4 percent. The commercials are Bearish with a score of 40.8 percent and the small traders (not shown in chart) are Bearish-Extreme with a score of 9.2 percent.
| CORN Futures Statistics | SPECULATORS | COMMERCIALS | SMALL TRADERS |
| – Percent of Open Interest Longs: | 27.8 | 49.4 | 9.1 |
| – Percent of Open Interest Shorts: | 8.1 | 64.9 | 13.3 |
| – Net Position: | 277,029 | -218,172 | -58,857 |
| – Gross Longs: | 390,081 | 693,006 | 128,301 |
| – Gross Shorts: | 113,052 | 911,178 | 187,158 |
| – Long to Short Ratio: | 3.5 to 1 | 0.8 to 1 | 0.7 to 1 |
| NET POSITION TREND: | |||
| – COT Index Score (3 Year Range Pct): | 65.4 | 40.8 | 9.2 |
| – COT Index Reading (3 Year Range): | Bullish | Bearish | Bearish-Extreme |
| NET POSITION MOVEMENT INDEX: | |||
| – 6-Week Change in Strength Index: | 1.2 | -2.8 | 6.1 |
SUGAR Futures:
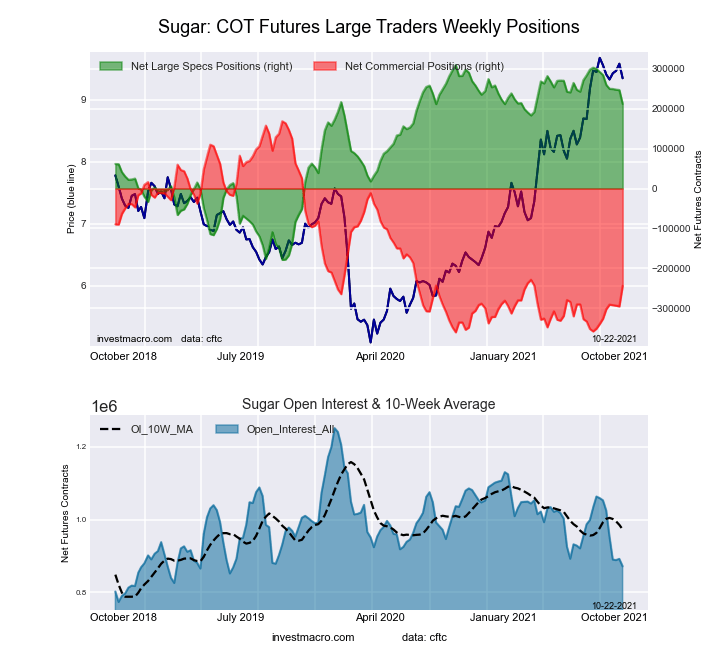 The SUGAR large speculator standing this week resulted in a net position of 211,550 contracts in the data reported through Tuesday. This was a weekly lowering of -34,638 contracts from the previous week which had a total of 246,188 net contracts.
This week’s current strength score (the trader positioning range over the past three years, measured from 0 to 100) shows the speculators are currently Bullish-Extreme with a score of 80.1 percent. The commercials are Bearish with a score of 22.0 percent and the small traders (not shown in chart) are Bearish with a score of 47.4 percent.
| SUGAR Futures Statistics | SPECULATORS | COMMERCIALS | SMALL TRADERS |
| – Percent of Open Interest Longs: | 31.4 | 43.9 | 9.8 |
| – Percent of Open Interest Shorts: | 7.1 | 71.8 | 6.2 |
| – Net Position: | 211,550 | -243,564 | 32,014 |
| – Gross Longs: | 273,687 | 382,386 | 85,819 |
| – Gross Shorts: | 62,137 | 625,950 | 53,805 |
| – Long to Short Ratio: | 4.4 to 1 | 0.6 to 1 | 1.6 to 1 |
| NET POSITION TREND: | |||
| – COT Index Score (3 Year Range Pct): | 80.1 | 22.0 | 47.4 |
| – COT Index Reading (3 Year Range): | Bullish-Extreme | Bearish | Bearish |
| NET POSITION MOVEMENT INDEX: | |||
| – 6-Week Change in Strength Index: | -14.9 | 15.6 | -12.1 |
COFFEE Futures:
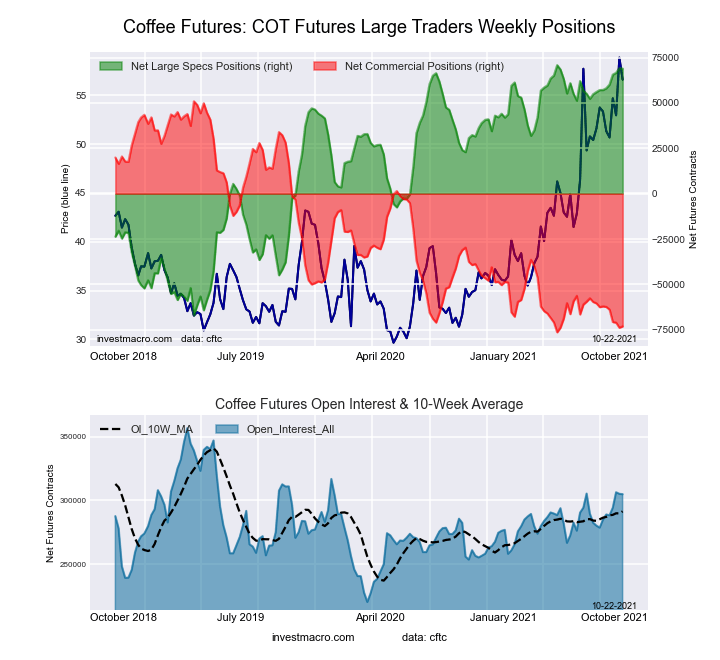 The COFFEE large speculator standing this week resulted in a net position of 68,889 contracts in the data reported through Tuesday. This was a weekly decrease of -196 contracts from the previous week which had a total of 69,085 net contracts.
This week’s current strength score (the trader positioning range over the past three years, measured from 0 to 100) shows the speculators are currently Bullish-Extreme with a score of 98.6 percent. The commercials are Bearish-Extreme with a score of 2.5 percent and the small traders (not shown in chart) are Bearish-Extreme with a score of 17.5 percent.
| COFFEE Futures Statistics | SPECULATORS | COMMERCIALS | SMALL TRADERS |
| – Percent of Open Interest Longs: | 27.9 | 40.5 | 3.8 |
| – Percent of Open Interest Shorts: | 5.3 | 64.5 | 2.4 |
| – Net Position: | 68,889 | -73,100 | 4,211 |
| – Gross Longs: | 85,100 | 123,540 | 11,611 |
| – Gross Shorts: | 16,211 | 196,640 | 7,400 |
| – Long to Short Ratio: | 5.2 to 1 | 0.6 to 1 | 1.6 to 1 |
| NET POSITION TREND: | |||
| – COT Index Score (3 Year Range Pct): | 98.6 | 2.5 | 17.5 |
| – COT Index Reading (3 Year Range): | Bullish-Extreme | Bearish-Extreme | Bearish-Extreme |
| NET POSITION MOVEMENT INDEX: | |||
| – 6-Week Change in Strength Index: | 8.5 | -8.7 | -5.3 |
SOYBEANS Futures:
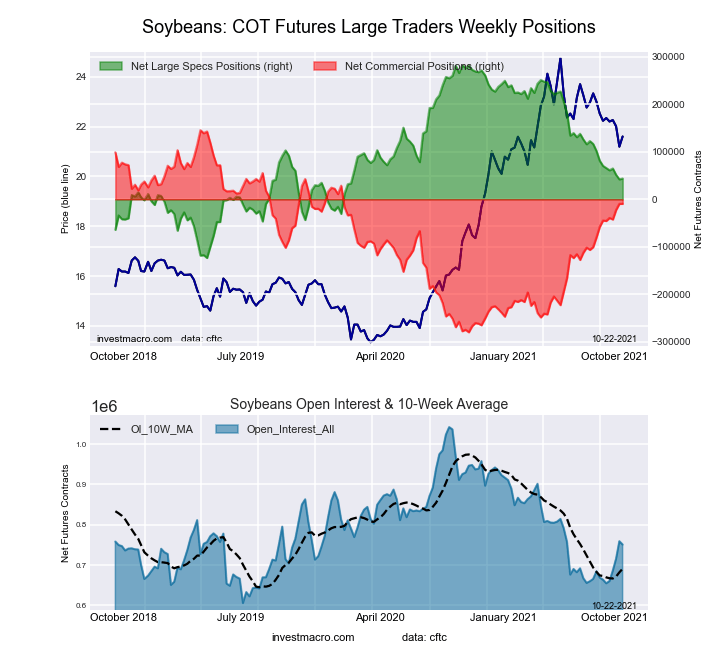 The SOYBEANS large speculator standing this week resulted in a net position of 43,541 contracts in the data reported through Tuesday. This was a weekly advance of 1,551 contracts from the previous week which had a total of 41,990 net contracts.
This week’s current strength score (the trader positioning range over the past three years, measured from 0 to 100) shows the speculators are currently Bearish with a score of 41.2 percent. The commercials are Bullish with a score of 63.6 percent and the small traders (not shown in chart) are Bearish-Extreme with a score of 15.3 percent.
| SOYBEANS Futures Statistics | SPECULATORS | COMMERCIALS | SMALL TRADERS |
| – Percent of Open Interest Longs: | 18.5 | 59.7 | 6.7 |
| – Percent of Open Interest Shorts: | 12.7 | 61.0 | 11.2 |
| – Net Position: | 43,541 | -9,575 | -33,966 |
| – Gross Longs: | 138,576 | 448,243 | 50,125 |
| – Gross Shorts: | 95,035 | 457,818 | 84,091 |
| – Long to Short Ratio: | 1.5 to 1 | 1.0 to 1 | 0.6 to 1 |
| NET POSITION TREND: | |||
| – COT Index Score (3 Year Range Pct): | 41.2 | 63.6 | 15.3 |
| – COT Index Reading (3 Year Range): | Bearish | Bullish | Bearish-Extreme |
| NET POSITION MOVEMENT INDEX: | |||
| – 6-Week Change in Strength Index: | -6.6 | 8.3 | -14.2 |
SOYBEAN OIL Futures:
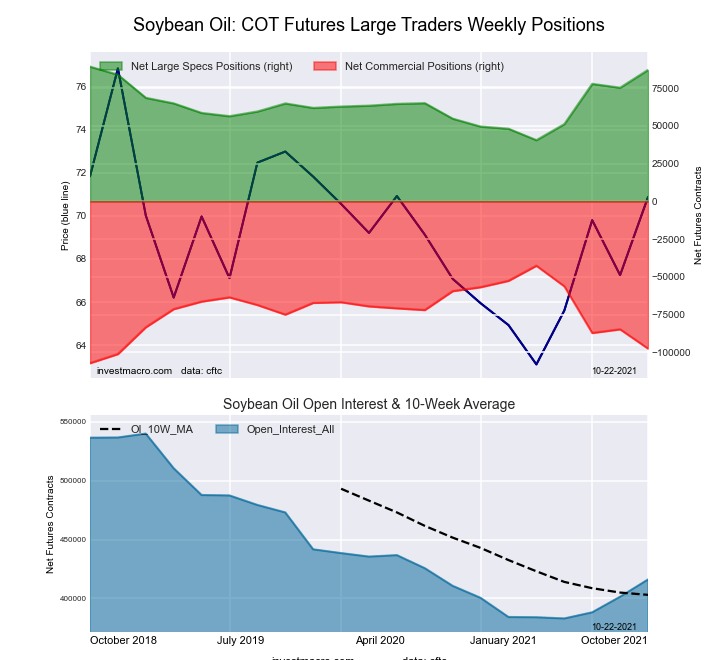 The SOYBEAN OIL large speculator standing this week resulted in a net position of 87,085 contracts in the data reported through Tuesday. This was a weekly rise of 11,787 contracts from the previous week which had a total of 75,298 net contracts.
This week’s current strength score (the trader positioning range over the past three years, measured from 0 to 100) shows the speculators are currently Bullish with a score of 70.8 percent. The commercials are Bearish with a score of 31.0 percent and the small traders (not shown in chart) are Bullish with a score of 52.5 percent.
| SOYBEAN OIL Futures Statistics | SPECULATORS | COMMERCIALS | SMALL TRADERS |
| – Percent of Open Interest Longs: | 27.5 | 48.3 | 7.4 |
| – Percent of Open Interest Shorts: | 6.6 | 71.7 | 4.9 |
| – Net Position: | 87,085 | -97,547 | 10,462 |
| – Gross Longs: | 114,434 | 200,793 | 30,908 |
| – Gross Shorts: | 27,349 | 298,340 | 20,446 |
| – Long to Short Ratio: | 4.2 to 1 | 0.7 to 1 | 1.5 to 1 |
| NET POSITION TREND: | |||
| – COT Index Score (3 Year Range Pct): | 70.8 | 31.0 | 52.5 |
| – COT Index Reading (3 Year Range): | Bullish | Bearish | Bullish |
| NET POSITION MOVEMENT INDEX: | |||
| – 6-Week Change in Strength Index: | 20.2 | -20.3 | 11.7 |
SOYBEAN MEAL Futures:
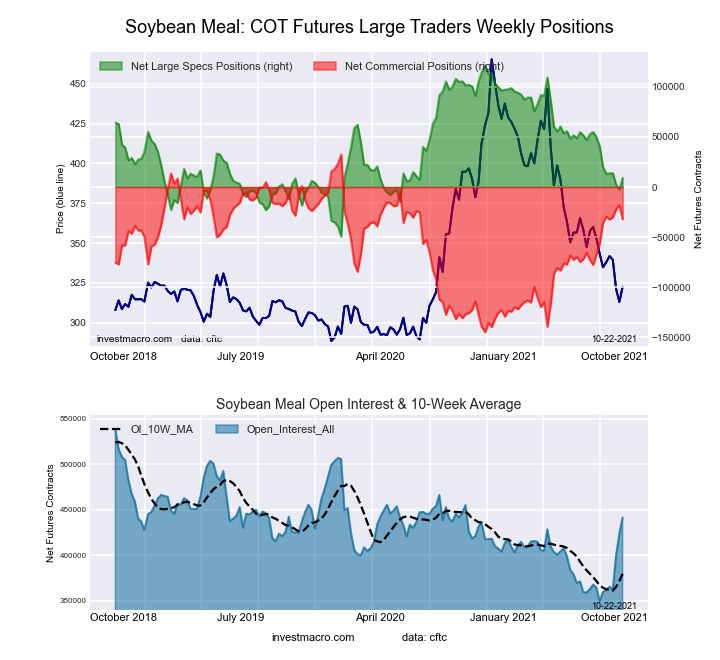 The SOYBEAN MEAL large speculator standing this week resulted in a net position of 9,114 contracts in the data reported through Tuesday. This was a weekly boost of 11,701 contracts from the previous week which had a total of -2,587 net contracts.
This week’s current strength score (the trader positioning range over the past three years, measured from 0 to 100) shows the speculators are currently Bearish with a score of 34.2 percent. The commercials are Bullish with a score of 63.6 percent and the small traders (not shown in chart) are Bullish with a score of 63.1 percent.
| SOYBEAN MEAL Futures Statistics | SPECULATORS | COMMERCIALS | SMALL TRADERS |
| – Percent of Open Interest Longs: | 19.7 | 48.7 | 12.3 |
| – Percent of Open Interest Shorts: | 17.7 | 56.0 | 7.1 |
| – Net Position: | 9,114 | -32,188 | 23,074 |
| – Gross Longs: | 87,127 | 214,800 | 54,299 |
| – Gross Shorts: | 78,013 | 246,988 | 31,225 |
| – Long to Short Ratio: | 1.1 to 1 | 0.9 to 1 | 1.7 to 1 |
| NET POSITION TREND: | |||
| – COT Index Score (3 Year Range Pct): | 34.2 | 63.6 | 63.1 |
| – COT Index Reading (3 Year Range): | Bearish | Bullish | Bullish |
| NET POSITION MOVEMENT INDEX: | |||
| – 6-Week Change in Strength Index: | -6.3 | 2.0 | 28.6 |
LIVE CATTLE Futures:
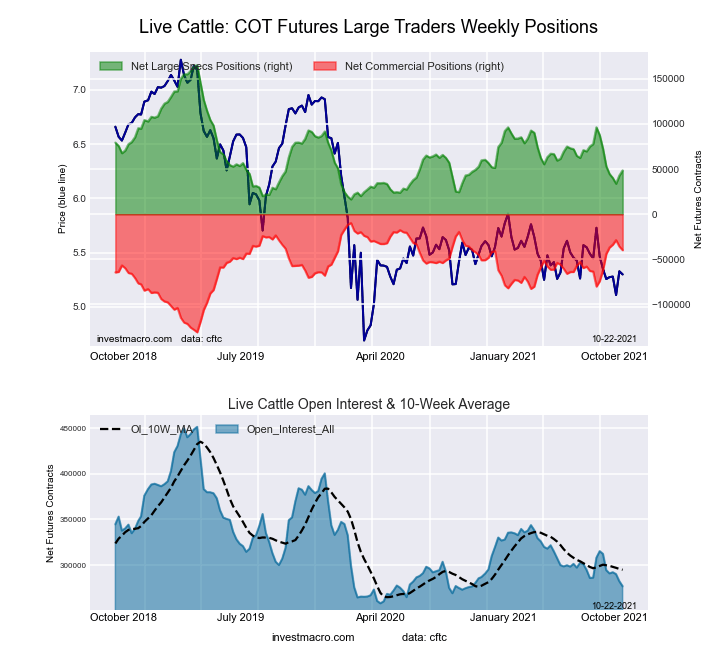 The LIVE CATTLE large speculator standing this week resulted in a net position of 48,491 contracts in the data reported through Tuesday. This was a weekly gain of 5,702 contracts from the previous week which had a total of 42,789 net contracts.
This week’s current strength score (the trader positioning range over the past three years, measured from 0 to 100) shows the speculators are currently Bearish with a score of 21.6 percent. The commercials are Bullish with a score of 75.2 percent and the small traders (not shown in chart) are Bullish with a score of 66.0 percent.
| LIVE CATTLE Futures Statistics | SPECULATORS | COMMERCIALS | SMALL TRADERS |
| – Percent of Open Interest Longs: | 34.2 | 43.3 | 10.1 |
| – Percent of Open Interest Shorts: | 16.7 | 57.7 | 13.3 |
| – Net Position: | 48,491 | -39,825 | -8,666 |
| – Gross Longs: | 94,585 | 119,928 | 28,083 |
| – Gross Shorts: | 46,094 | 159,753 | 36,749 |
| – Long to Short Ratio: | 2.1 to 1 | 0.8 to 1 | 0.8 to 1 |
| NET POSITION TREND: | |||
| – COT Index Score (3 Year Range Pct): | 21.6 | 75.2 | 66.0 |
| – COT Index Reading (3 Year Range): | Bearish | Bullish | Bullish |
| NET POSITION MOVEMENT INDEX: | |||
| – 6-Week Change in Strength Index: | -16.1 | 18.4 | 4.3 |
LEAN HOGS Futures:
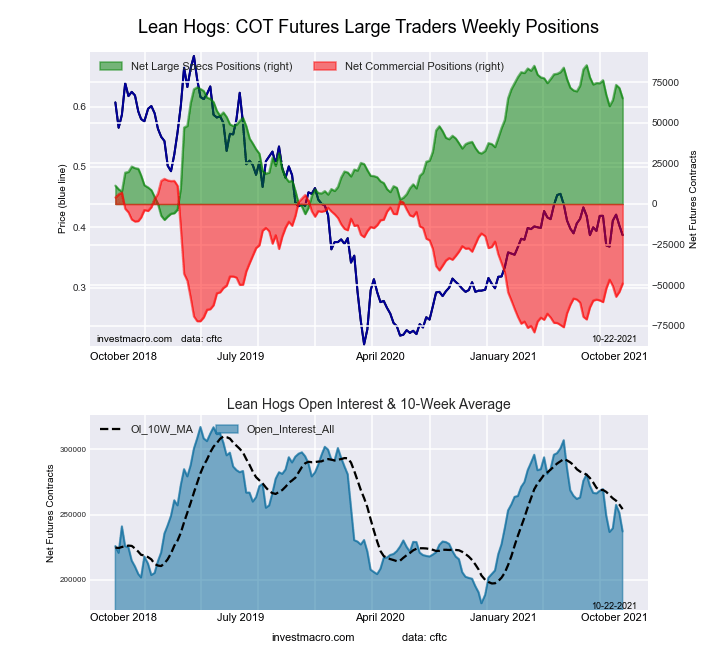 The LEAN HOGS large speculator standing this week resulted in a net position of 65,182 contracts in the data reported through Tuesday. This was a weekly decrease of -6,362 contracts from the previous week which had a total of 71,544 net contracts.
This week’s current strength score (the trader positioning range over the past three years, measured from 0 to 100) shows the speculators are currently Bullish with a score of 78.6 percent. The commercials are Bearish with a score of 31.8 percent and the small traders (not shown in chart) are Bearish-Extreme with a score of 5.8 percent.
| LEAN HOGS Futures Statistics | SPECULATORS | COMMERCIALS | SMALL TRADERS |
| – Percent of Open Interest Longs: | 41.8 | 31.7 | 7.4 |
| – Percent of Open Interest Shorts: | 14.3 | 52.4 | 14.2 |
| – Net Position: | 65,182 | -49,056 | -16,126 |
| – Gross Longs: | 99,071 | 75,285 | 17,573 |
| – Gross Shorts: | 33,889 | 124,341 | 33,699 |
| – Long to Short Ratio: | 2.9 to 1 | 0.6 to 1 | 0.5 to 1 |
| NET POSITION TREND: | |||
| – COT Index Score (3 Year Range Pct): | 78.6 | 31.8 | 5.8 |
| – COT Index Reading (3 Year Range): | Bullish | Bearish | Bearish-Extreme |
| NET POSITION MOVEMENT INDEX: | |||
| – 6-Week Change in Strength Index: | -11.7 | 12.1 | -1.0 |
COTTON Futures:
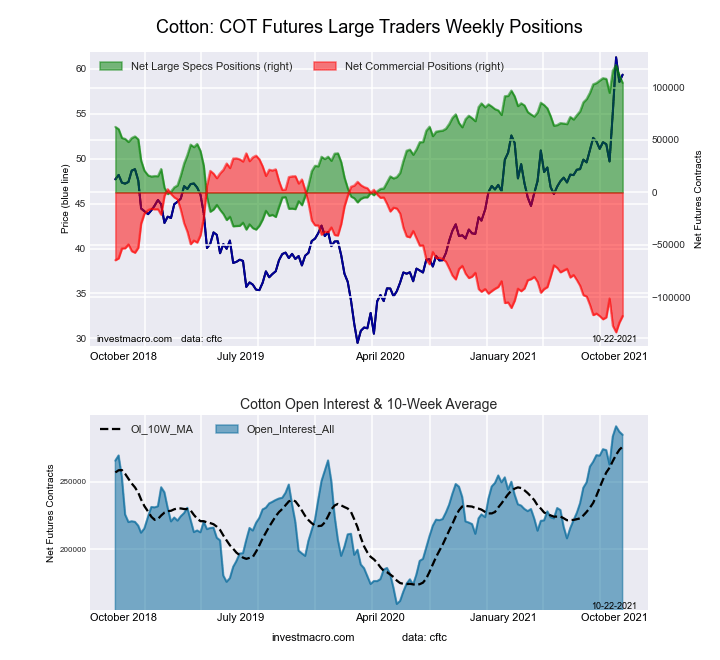 The COTTON large speculator standing this week resulted in a net position of 104,423 contracts in the data reported through Tuesday. This was a weekly decrease of -6,968 contracts from the previous week which had a total of 111,391 net contracts.
This week’s current strength score (the trader positioning range over the past three years, measured from 0 to 100) shows the speculators are currently Bullish-Extreme with a score of 89.2 percent. The commercials are Bearish-Extreme with a score of 9.1 percent and the small traders (not shown in chart) are Bullish-Extreme with a score of 96.9 percent.
| COTTON Futures Statistics | SPECULATORS | COMMERCIALS | SMALL TRADERS |
| – Percent of Open Interest Longs: | 40.9 | 37.9 | 7.9 |
| – Percent of Open Interest Shorts: | 4.2 | 79.3 | 3.2 |
| – Net Position: | 104,423 | -117,781 | 13,358 |
| – Gross Longs: | 116,323 | 107,844 | 22,504 |
| – Gross Shorts: | 11,900 | 225,625 | 9,146 |
| – Long to Short Ratio: | 9.8 to 1 | 0.5 to 1 | 2.5 to 1 |
| NET POSITION TREND: | |||
| – COT Index Score (3 Year Range Pct): | 89.2 | 9.1 | 96.9 |
| – COT Index Reading (3 Year Range): | Bullish-Extreme | Bearish-Extreme | Bullish-Extreme |
| NET POSITION MOVEMENT INDEX: | |||
| – 6-Week Change in Strength Index: | -2.9 | 1.8 | 8.8 |
COCOA Futures:
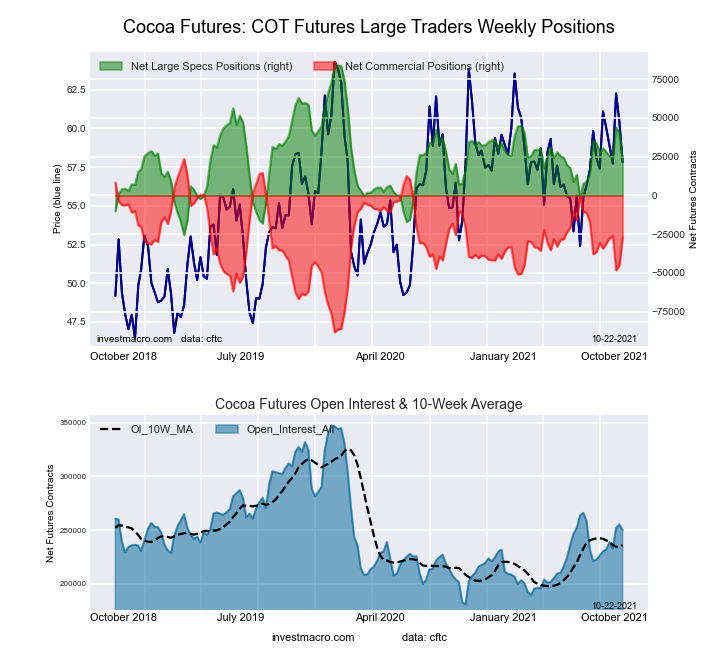 The COCOA large speculator standing this week resulted in a net position of 22,821 contracts in the data reported through Tuesday. This was a weekly lowering of -17,400 contracts from the previous week which had a total of 40,221 net contracts.
This week’s current strength score (the trader positioning range over the past three years, measured from 0 to 100) shows the speculators are currently Bearish with a score of 44.1 percent. The commercials are Bullish with a score of 54.7 percent and the small traders (not shown in chart) are Bullish with a score of 56.9 percent.
| COCOA Futures Statistics | SPECULATORS | COMMERCIALS | SMALL TRADERS |
| – Percent of Open Interest Longs: | 27.0 | 49.8 | 4.8 |
| – Percent of Open Interest Shorts: | 17.9 | 60.6 | 3.1 |
| – Net Position: | 22,821 | -27,077 | 4,256 |
| – Gross Longs: | 67,550 | 124,427 | 11,933 |
| – Gross Shorts: | 44,729 | 151,504 | 7,677 |
| – Long to Short Ratio: | 1.5 to 1 | 0.8 to 1 | 1.6 to 1 |
| NET POSITION TREND: | |||
| – COT Index Score (3 Year Range Pct): | 44.1 | 54.7 | 56.9 |
| – COT Index Reading (3 Year Range): | Bearish | Bullish | Bullish |
| NET POSITION MOVEMENT INDEX: | |||
| – 6-Week Change in Strength Index: | -7.0 | 6.5 | 3.7 |
WHEAT Futures:
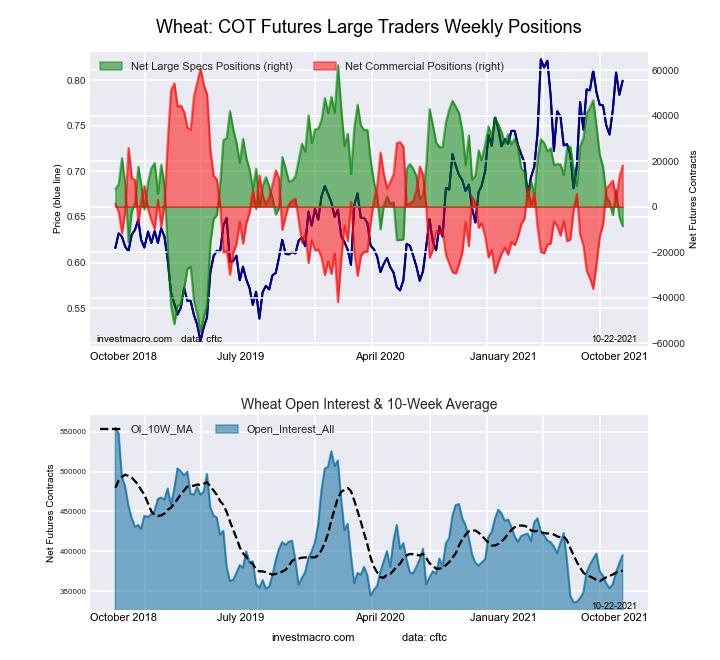 The WHEAT large speculator standing this week resulted in a net position of -8,566 contracts in the data reported through Tuesday. This was a weekly reduction of -4,032 contracts from the previous week which had a total of -4,534 net contracts.
This week’s current strength score (the trader positioning range over the past three years, measured from 0 to 100) shows the speculators are currently Bearish with a score of 39.7 percent. The commercials are Bullish with a score of 58.5 percent and the small traders (not shown in chart) are Bullish with a score of 55.7 percent.
| WHEAT Futures Statistics | SPECULATORS | COMMERCIALS | SMALL TRADERS |
| – Percent of Open Interest Longs: | 24.7 | 41.0 | 7.9 |
| – Percent of Open Interest Shorts: | 26.9 | 36.4 | 10.3 |
| – Net Position: | -8,566 | 18,180 | -9,614 |
| – Gross Longs: | 97,532 | 162,052 | 31,200 |
| – Gross Shorts: | 106,098 | 143,872 | 40,814 |
| – Long to Short Ratio: | 0.9 to 1 | 1.1 to 1 | 0.8 to 1 |
| NET POSITION TREND: | |||
| – COT Index Score (3 Year Range Pct): | 39.7 | 58.5 | 55.7 |
| – COT Index Reading (3 Year Range): | Bearish | Bullish | Bullish |
| NET POSITION MOVEMENT INDEX: | |||
| – 6-Week Change in Strength Index: | -22.2 | 25.3 | 0.5 |
Article By InvestMacro.com – Receive our weekly COT Reports by Email
*COT Report: The COT data, released weekly to the public each Friday, is updated through the most recent Tuesday (data is 3 days old) and shows a quick view of how large speculators or non-commercials (for-profit traders) were positioned in the futures markets.
The CFTC categorizes trader positions according to commercial hedgers (traders who use futures contracts for hedging as part of the business), non-commercials (large traders who speculate to realize trading profits) and nonreportable traders (usually small traders/speculators).
Find CFTC criteria here: (http://www.cftc.gov/MarketReports/CommitmentsofTraders/ExplanatoryNotes/index.htm).

- The Bank of Canada kept its interest rate unchanged. Platinum prices reached a three‑week high Jul 16, 2026
- Stock indices rose after the release of US inflation data. China’s GDP slowed sharply Jul 15, 2026
- GBP/USD Awaits Political News: What Will Happen Next Jul 15, 2026
- USD/JPY Holds at Highs: Pressure Lingers on Yen Jul 14, 2026
- Oil prices jumped 4% amid a new wave of escalation between the US and Iran Jul 13, 2026
- EUR/USD: US Inflation Will Determine Everything Jul 13, 2026
- COT Metals Charts: Weekly Speculator Bets see small gains for Silver & Gold Jul 12, 2026
- COT Bonds Charts: Speculator Bets led by SOFR 3-Months & 2-Year Bonds Jul 12, 2026
- COT Energy Charts: Weekly Speculator Changes led by Brent Oil Jul 12, 2026
- COT Soft Commodities Charts: Weekly Speculator Changes led by Sugar, Corn & Soybeans Jul 12, 2026