
By InvestMacro.com COT Home | Data Tables | Data Downloads | Newsletter
Here are the latest charts and statistics for the Commitment of Traders (COT) data published by the Commodities Futures Trading Commission (CFTC).
The latest COT data is updated through Tuesday October 26th 2021 and shows a quick view of how large traders (for-profit speculators and commercial entities) were positioned in the futures markets.
| Oct-26-2021 | OI | OI-Index | Spec-Net | Spec-Index | Com-Net | COM-Index | Smalls-Net | Smalls-Index |
|---|---|---|---|---|---|---|---|---|
| S&P500-Mini | 2,404,805 | 1 | 96,488 | 76 | -126,538 | 43 | 30,050 | 33 |
| Nikkei 225 | 17,649 | 10 | -262 | 57 | -1,956 | 46 | 2,218 | 55 |
| Nasdaq-Mini | 245,510 | 40 | -3,255 | 73 | 6,413 | 30 | -3,158 | 37 |
| DowJones-Mini | 109,296 | 83 | 1,737 | 38 | -5,178 | 56 | 3,441 | 57 |
| VIX | 337,252 | 38 | -101,596 | 44 | 109,530 | 57 | -7,934 | 26 |
| Nikkei 225 Yen | 49,618 | 28 | 2,177 | 28 | 21,315 | 85 | -23,492 | 33 |
VIX Volatility Futures:
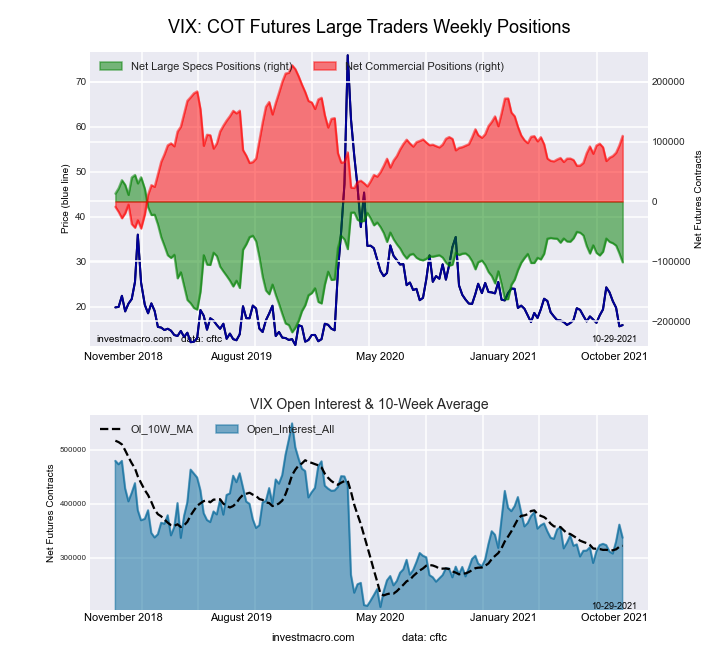 The VIX Volatility large speculator standing this week came in at a net position of -101,596 contracts in the data reported through Tuesday. This was a weekly fall of -14,828 contracts from the previous week which had a total of -86,768 net contracts.
This week’s current strength score (the trader positioning range over the past three years, measured from 0 to 100) shows the speculators are currently Bearish with a score of 44.5 percent. The commercials are Bullish with a score of 56.7 percent and the small traders (not shown in chart) are Bearish with a score of 26.3 percent.
Free Reports:
 Get our Weekly Commitment of Traders Reports - See where the biggest traders (Hedge Funds and Commercial Hedgers) are positioned in the futures markets on a weekly basis.
 Sign Up for Our Stock Market Newsletter – Get updated on News, Charts & Rankings of Public Companies when you join our Stocks Newsletter
| VIX Volatility Futures Statistics | SPECULATORS | COMMERCIALS | SMALL TRADERS |
| – Percent of Open Interest Longs: | 18.5 | 57.3 | 5.8 |
| – Percent of Open Interest Shorts: | 48.6 | 24.8 | 8.2 |
| – Net Position: | -101,596 | 109,530 | -7,934 |
| – Gross Longs: | 62,466 | 193,124 | 19,666 |
| – Gross Shorts: | 164,062 | 83,594 | 27,600 |
| – Long to Short Ratio: | 0.4 to 1 | 2.3 to 1 | 0.7 to 1 |
| NET POSITION TREND: | |||
| – COT Index Score (3 Year Range Pct): | 44.5 | 56.7 | 26.3 |
| – COT Index Reading (3 Year Range): | Bearish | Bullish | Bearish |
| NET POSITION MOVEMENT INDEX: | |||
| – 6-Week Change in Strength Index: | -6.8 | 7.0 | -4.5 |
S&P500 Mini Futures:
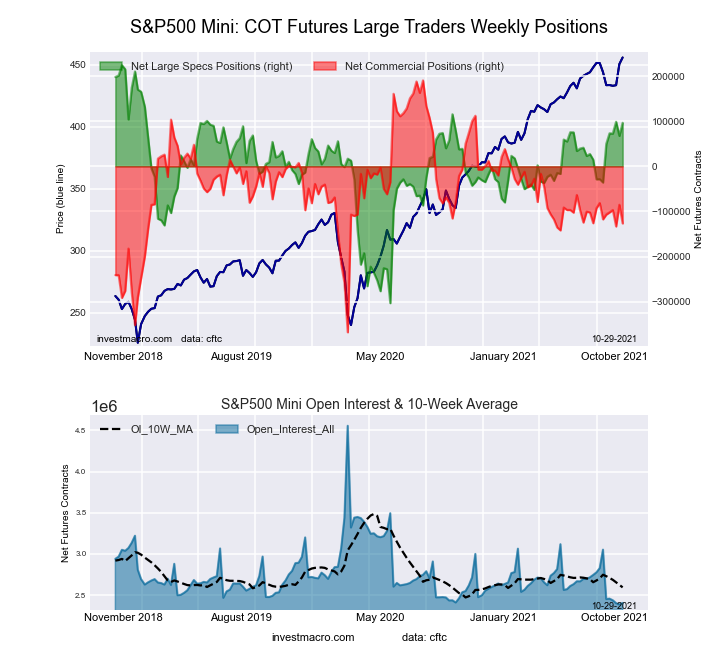 The S&P500 Mini large speculator standing this week came in at a net position of 96,488 contracts in the data reported through Tuesday. This was a weekly gain of 28,869 contracts from the previous week which had a total of 67,619 net contracts.
This week’s current strength score (the trader positioning range over the past three years, measured from 0 to 100) shows the speculators are currently Bullish with a score of 75.8 percent. The commercials are Bearish with a score of 43.2 percent and the small traders (not shown in chart) are Bearish with a score of 32.7 percent.
| S&P500 Mini Futures Statistics | SPECULATORS | COMMERCIALS | SMALL TRADERS |
| – Percent of Open Interest Longs: | 14.7 | 71.2 | 11.4 |
| – Percent of Open Interest Shorts: | 10.7 | 76.4 | 10.2 |
| – Net Position: | 96,488 | -126,538 | 30,050 |
| – Gross Longs: | 352,672 | 1,711,912 | 274,773 |
| – Gross Shorts: | 256,184 | 1,838,450 | 244,723 |
| – Long to Short Ratio: | 1.4 to 1 | 0.9 to 1 | 1.1 to 1 |
| NET POSITION TREND: | |||
| – COT Index Score (3 Year Range Pct): | 75.8 | 43.2 | 32.7 |
| – COT Index Reading (3 Year Range): | Bullish | Bearish | Bearish |
| NET POSITION MOVEMENT INDEX: | |||
| – 6-Week Change in Strength Index: | 25.1 | -1.6 | -25.9 |
Dow Jones Mini Futures:
 The Dow Jones Mini large speculator standing this week came in at a net position of 1,737 contracts in the data reported through Tuesday. This was a weekly decrease of -1,894 contracts from the previous week which had a total of 3,631 net contracts.
This week’s current strength score (the trader positioning range over the past three years, measured from 0 to 100) shows the speculators are currently Bearish with a score of 38.0 percent. The commercials are Bullish with a score of 56.1 percent and the small traders (not shown in chart) are Bullish with a score of 56.9 percent.
| Dow Jones Mini Futures Statistics | SPECULATORS | COMMERCIALS | SMALL TRADERS |
| – Percent of Open Interest Longs: | 38.0 | 44.3 | 15.9 |
| – Percent of Open Interest Shorts: | 36.4 | 49.0 | 12.8 |
| – Net Position: | 1,737 | -5,178 | 3,441 |
| – Gross Longs: | 41,551 | 48,390 | 17,413 |
| – Gross Shorts: | 39,814 | 53,568 | 13,972 |
| – Long to Short Ratio: | 1.0 to 1 | 0.9 to 1 | 1.2 to 1 |
| NET POSITION TREND: | |||
| – COT Index Score (3 Year Range Pct): | 38.0 | 56.1 | 56.9 |
| – COT Index Reading (3 Year Range): | Bearish | Bullish | Bullish |
| NET POSITION MOVEMENT INDEX: | |||
| – 6-Week Change in Strength Index: | 17.0 | -8.7 | -35.1 |
Nasdaq Mini Futures:
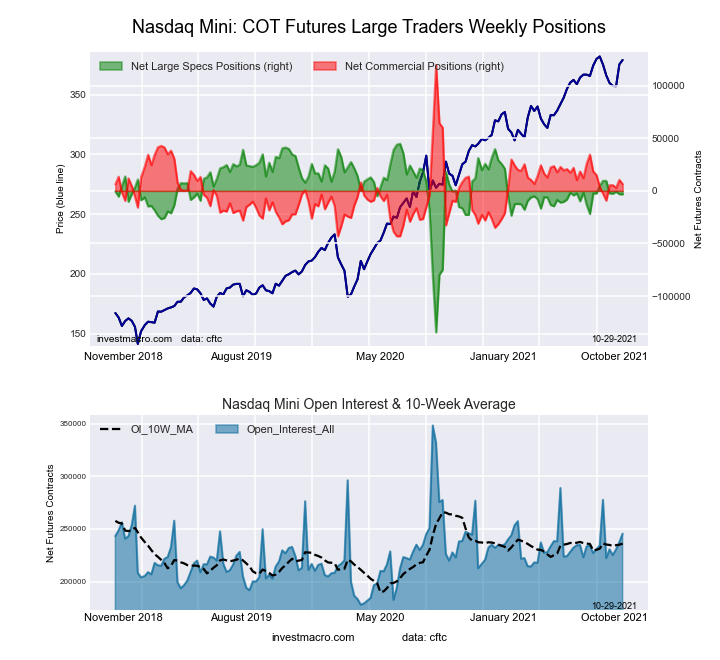 The Nasdaq Mini large speculator standing this week came in at a net position of -3,255 contracts in the data reported through Tuesday. This was a weekly reduction of -198 contracts from the previous week which had a total of -3,057 net contracts.
This week’s current strength score (the trader positioning range over the past three years, measured from 0 to 100) shows the speculators are currently Bullish with a score of 73.2 percent. The commercials are Bearish with a score of 30.5 percent and the small traders (not shown in chart) are Bearish with a score of 36.9 percent.
| Nasdaq Mini Futures Statistics | SPECULATORS | COMMERCIALS | SMALL TRADERS |
| – Percent of Open Interest Longs: | 26.8 | 56.0 | 15.6 |
| – Percent of Open Interest Shorts: | 28.1 | 53.4 | 16.9 |
| – Net Position: | -3,255 | 6,413 | -3,158 |
| – Gross Longs: | 65,755 | 137,552 | 38,307 |
| – Gross Shorts: | 69,010 | 131,139 | 41,465 |
| – Long to Short Ratio: | 1.0 to 1 | 1.0 to 1 | 0.9 to 1 |
| NET POSITION TREND: | |||
| – COT Index Score (3 Year Range Pct): | 73.2 | 30.5 | 36.9 |
| – COT Index Reading (3 Year Range): | Bullish | Bearish | Bearish |
| NET POSITION MOVEMENT INDEX: | |||
| – 6-Week Change in Strength Index: | -7.2 | 5.5 | 8.6 |
Russell 2000 Mini Futures:
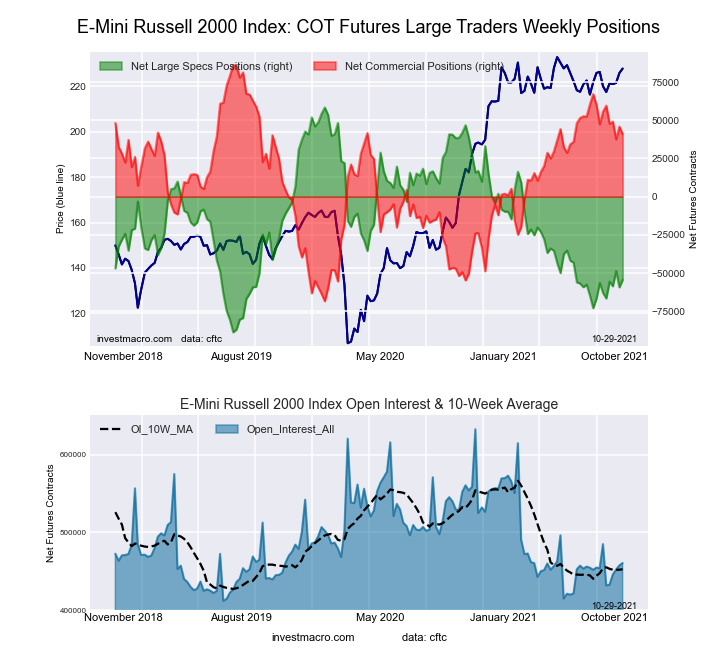 The Russell 2000 Mini large speculator standing this week came in at a net position of -54,431 contracts in the data reported through Tuesday. This was a weekly gain of 4,890 contracts from the previous week which had a total of -59,321 net contracts.
This week’s current strength score (the trader positioning range over the past three years, measured from 0 to 100) shows the speculators are currently Bearish with a score of 23.3 percent. The commercials are Bullish with a score of 70.8 percent and the small traders (not shown in chart) are Bullish with a score of 71.3 percent.
| Russell 2000 Mini Futures Statistics | SPECULATORS | COMMERCIALS | SMALL TRADERS |
| – Percent of Open Interest Longs: | 13.0 | 79.1 | 7.0 |
| – Percent of Open Interest Shorts: | 24.8 | 70.2 | 4.0 |
| – Net Position: | -54,431 | 40,887 | 13,544 |
| – Gross Longs: | 59,793 | 364,163 | 32,009 |
| – Gross Shorts: | 114,224 | 323,276 | 18,465 |
| – Long to Short Ratio: | 0.5 to 1 | 1.1 to 1 | 1.7 to 1 |
| NET POSITION TREND: | |||
| – COT Index Score (3 Year Range Pct): | 23.3 | 70.8 | 71.3 |
| – COT Index Reading (3 Year Range): | Bearish | Bullish | Bullish |
| NET POSITION MOVEMENT INDEX: | |||
| – 6-Week Change in Strength Index: | 5.8 | -9.6 | 17.5 |
Nikkei Stock Average (USD) Futures:
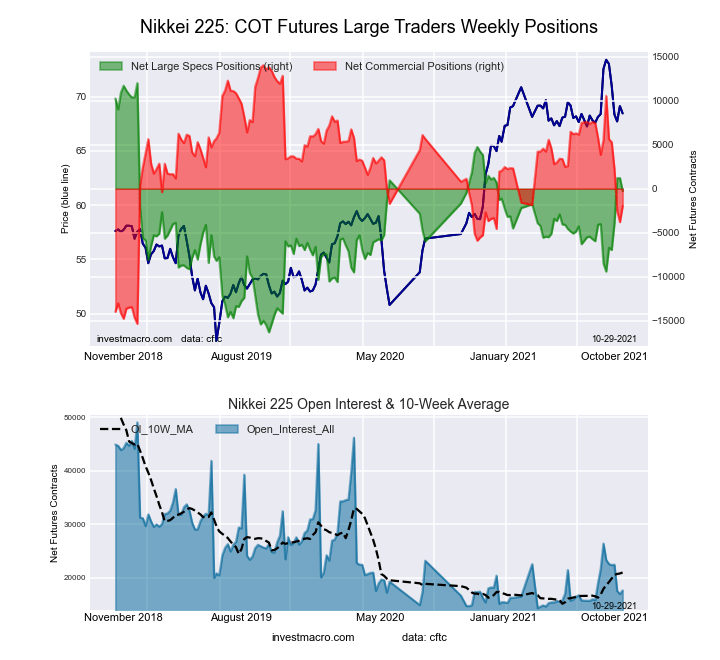 The Nikkei Stock Average (USD) large speculator standing this week came in at a net position of -262 contracts in the data reported through Tuesday. This was a weekly reduction of -1,474 contracts from the previous week which had a total of 1,212 net contracts.
This week’s current strength score (the trader positioning range over the past three years, measured from 0 to 100) shows the speculators are currently Bullish with a score of 56.7 percent. The commercials are Bearish with a score of 45.6 percent and the small traders (not shown in chart) are Bullish with a score of 55.2 percent.
| Nikkei Stock Average Futures Statistics | SPECULATORS | COMMERCIALS | SMALL TRADERS |
| – Percent of Open Interest Longs: | 16.7 | 56.7 | 26.5 |
| – Percent of Open Interest Shorts: | 18.2 | 67.7 | 13.9 |
| – Net Position: | -262 | -1,956 | 2,218 |
| – Gross Longs: | 2,949 | 9,999 | 4,674 |
| – Gross Shorts: | 3,211 | 11,955 | 2,456 |
| – Long to Short Ratio: | 0.9 to 1 | 0.8 to 1 | 1.9 to 1 |
| NET POSITION TREND: | |||
| – COT Index Score (3 Year Range Pct): | 56.7 | 45.6 | 55.2 |
| – COT Index Reading (3 Year Range): | Bullish | Bearish | Bullish |
| NET POSITION MOVEMENT INDEX: | |||
| – 6-Week Change in Strength Index: | 32.3 | -42.6 | 43.0 |
MSCI EAFE Mini Futures:
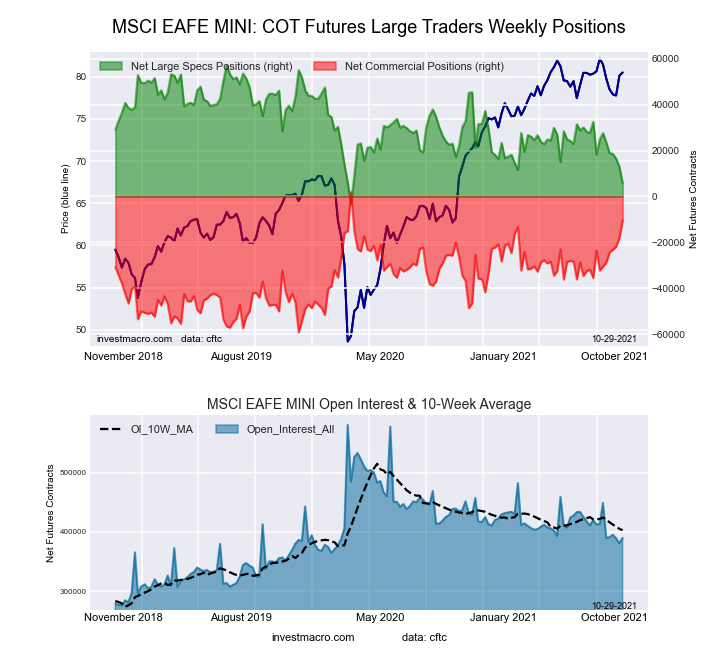 The MSCI EAFE Mini large speculator standing this week came in at a net position of 5,775 contracts in the data reported through Tuesday. This was a weekly lowering of -7,064 contracts from the previous week which had a total of 12,839 net contracts.
This week’s current strength score (the trader positioning range over the past three years, measured from 0 to 100) shows the speculators are currently Bearish-Extreme with a score of 15.1 percent. The commercials are Bullish with a score of 80.0 percent and the small traders (not shown in chart) are Bullish with a score of 57.3 percent.
| MSCI EAFE Mini Futures Statistics | SPECULATORS | COMMERCIALS | SMALL TRADERS |
| – Percent of Open Interest Longs: | 6.7 | 90.3 | 2.8 |
| – Percent of Open Interest Shorts: | 5.3 | 92.9 | 1.6 |
| – Net Position: | 5,775 | -10,344 | 4,569 |
| – Gross Longs: | 26,318 | 352,076 | 10,989 |
| – Gross Shorts: | 20,543 | 362,420 | 6,420 |
| – Long to Short Ratio: | 1.3 to 1 | 1.0 to 1 | 1.7 to 1 |
| NET POSITION TREND: | |||
| – COT Index Score (3 Year Range Pct): | 15.1 | 80.0 | 57.3 |
| – COT Index Reading (3 Year Range): | Bearish-Extreme | Bullish | Bullish |
| NET POSITION MOVEMENT INDEX: | |||
| – 6-Week Change in Strength Index: | -36.0 | 33.1 | 14.7 |
Article By InvestMacro.com – Receive our weekly COT Reports by Email
*COT Report: The COT data, released weekly to the public each Friday, is updated through the most recent Tuesday (data is 3 days old) and shows a quick view of how large speculators or non-commercials (for-profit traders) were positioned in the futures markets.
The CFTC categorizes trader positions according to commercial hedgers (traders who use futures contracts for hedging as part of the business), non-commercials (large traders who speculate to realize trading profits) and nonreportable traders (usually small traders/speculators).
Find CFTC criteria here: (http://www.cftc.gov/MarketReports/CommitmentsofTraders/ExplanatoryNotes/index.htm).

- COT Metals Charts: Weekly Speculator Bets see small gains for Silver & Gold Jul 12, 2026
- COT Bonds Charts: Speculator Bets led by SOFR 3-Months & 2-Year Bonds Jul 12, 2026
- COT Energy Charts: Weekly Speculator Changes led by Brent Oil Jul 12, 2026
- COT Soft Commodities Charts: Weekly Speculator Changes led by Sugar, Corn & Soybeans Jul 12, 2026
- The US and European stock indices are rising again amid renewed investor interest in the AI industry. Jul 10, 2026
- USD/JPY Falls as Yen Recovers Weekly Losses Jul 10, 2026
- Crude oil prices surged sharply by 7% in reaction to the rapid escalation of the conflict in the Middle East Jul 9, 2026
- Middle East Tensions Weigh on Gold Jul 9, 2026
- Pound Awaits Tighter Policy from Bank of England Jul 8, 2026
- The United States carried out airstrikes on Iran after Iran’s attacked tankers in the Strait of Hormuz. The RBNZ raised the interest rate to 2.5% Jul 8, 2026