
By InvestMacro.com COT Home | Data Tables | Data Downloads | Newsletter
Here are the latest charts and statistics for the Commitment of Traders (COT) data published by the Commodities Futures Trading Commission (CFTC).
The latest COT data is updated through Tuesday October 19th 2021 and shows a quick view of how large traders (for-profit speculators and commercial entities) were positioned in the futures markets.
| Oct-19-2021 | OI | OI-Index | Spec-Net | Spec-Index | Com-Net | COM-Index | Smalls-Net | Smalls-Index |
|---|---|---|---|---|---|---|---|---|
| Eurodollar | 12,424,747 | 63 | -781,200 | 35 | 1,080,706 | 60 | -299,506 | 64 |
| FedFunds | 1,217,775 | 18 | -54,484 | 33 | 65,503 | 68 | -11,019 | 42 |
| 2-Year | 1,991,689 | 8 | -132,952 | 63 | 172,598 | 51 | -39,646 | 2 |
| Long T-Bond | 1,186,553 | 48 | -57,571 | 73 | 83,737 | 47 | -26,166 | 32 |
| 10-Year | 4,095,300 | 71 | -544 | 75 | 319,388 | 60 | -318,844 | 4 |
| 5-Year | 3,637,741 | 28 | -255,211 | 47 | 510,373 | 82 | -255,162 | 0 |
3-Month Eurodollars Futures:
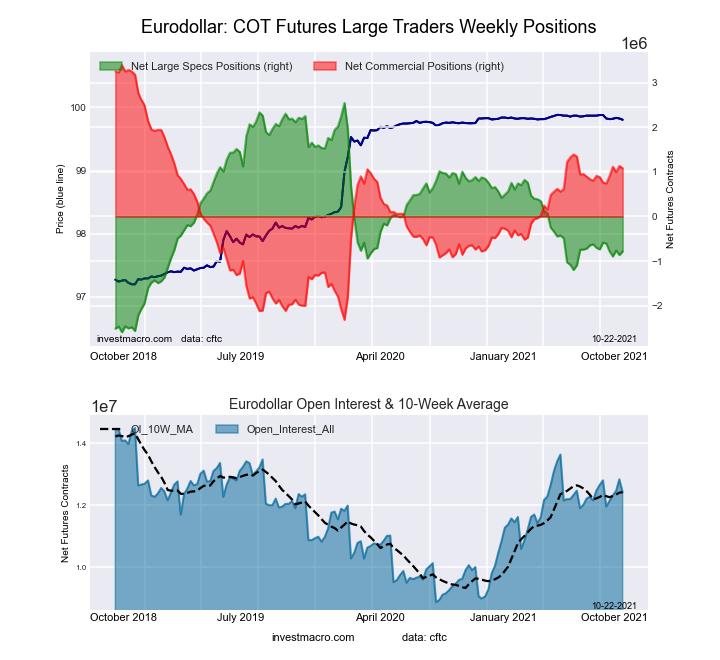 The 3-Month Eurodollars large speculator standing this week resulted in a net position of -781,200 contracts in the data reported through Tuesday. This was a weekly advance of 82,400 contracts from the previous week which had a total of -863,600 net contracts.
This week’s current strength score (the trader positioning range over the past three years, measured from 0 to 100) shows the speculators are currently Bearish with a score of 35.3 percent. The commercials are Bullish with a score of 59.5 percent and the small traders (not shown in chart) are Bullish with a score of 64.0 percent.
Free Reports:
 Get our Weekly Commitment of Traders Reports - See where the biggest traders (Hedge Funds and Commercial Hedgers) are positioned in the futures markets on a weekly basis.
 Sign Up for Our Stock Market Newsletter – Get updated on News, Charts & Rankings of Public Companies when you join our Stocks Newsletter
| 3-Month Eurodollars Statistics | SPECULATORS | COMMERCIALS | SMALL TRADERS |
| – Percent of Open Interest Longs: | 12.6 | 63.4 | 4.5 |
| – Percent of Open Interest Shorts: | 18.9 | 54.7 | 6.9 |
| – Net Position: | -781,200 | 1,080,706 | -299,506 |
| – Gross Longs: | 1,565,312 | 7,876,268 | 563,787 |
| – Gross Shorts: | 2,346,512 | 6,795,562 | 863,293 |
| – Long to Short Ratio: | 0.7 to 1 | 1.2 to 1 | 0.7 to 1 |
| NET POSITION TREND: | |||
| – COT Index Score (3 Year Range Pct): | 35.3 | 59.5 | 64.0 |
| – COT Index Reading (3 Year Range): | Bearish | Bullish | Bullish |
| NET POSITION MOVEMENT INDEX: | |||
| – 6-Week Change in Strength Index: | -3.8 | 5.6 | -16.3 |
30-Day Federal Funds Futures:
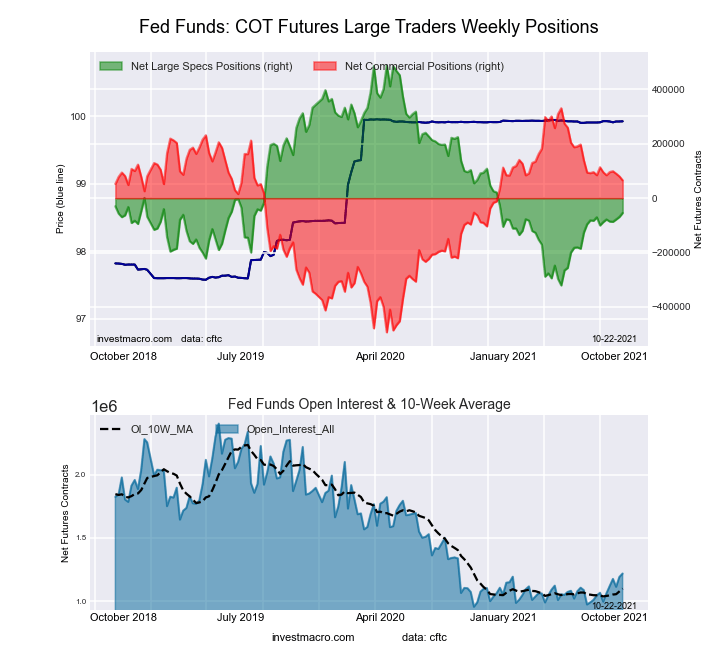 The 30-Day Federal Funds large speculator standing this week resulted in a net position of -54,484 contracts in the data reported through Tuesday. This was a weekly increase of 14,601 contracts from the previous week which had a total of -69,085 net contracts.
This week’s current strength score (the trader positioning range over the past three years, measured from 0 to 100) shows the speculators are currently Bearish with a score of 32.9 percent. The commercials are Bullish with a score of 67.8 percent and the small traders (not shown in chart) are Bearish with a score of 41.5 percent.
| 30-Day Federal Funds Statistics | SPECULATORS | COMMERCIALS | SMALL TRADERS |
| – Percent of Open Interest Longs: | 6.1 | 77.6 | 1.6 |
| – Percent of Open Interest Shorts: | 10.5 | 72.2 | 2.5 |
| – Net Position: | -54,484 | 65,503 | -11,019 |
| – Gross Longs: | 73,882 | 945,177 | 19,058 |
| – Gross Shorts: | 128,366 | 879,674 | 30,077 |
| – Long to Short Ratio: | 0.6 to 1 | 1.1 to 1 | 0.6 to 1 |
| NET POSITION TREND: | |||
| – COT Index Score (3 Year Range Pct): | 32.9 | 67.8 | 41.5 |
| – COT Index Reading (3 Year Range): | Bearish | Bullish | Bearish |
| NET POSITION MOVEMENT INDEX: | |||
| – 6-Week Change in Strength Index: | 4.1 | -3.6 | -8.2 |
2-Year Treasury Note Futures:
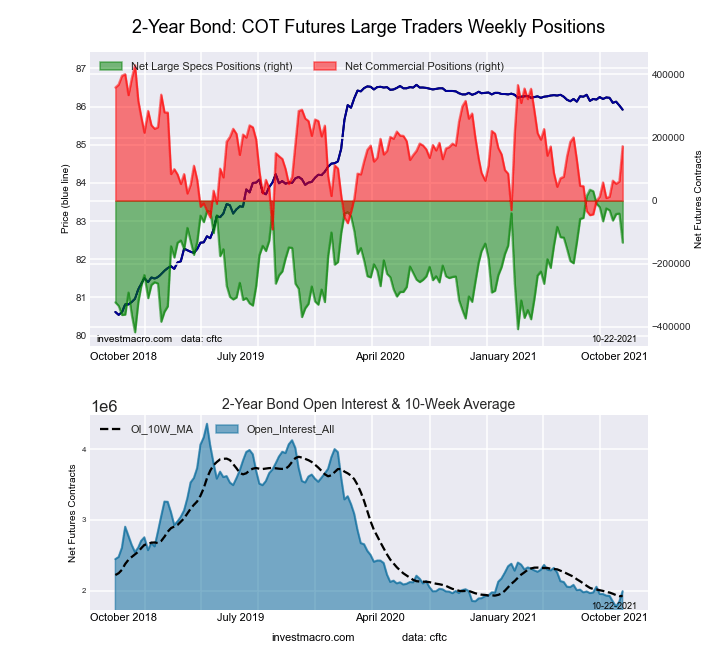 The 2-Year Treasury Note large speculator standing this week resulted in a net position of -132,952 contracts in the data reported through Tuesday. This was a weekly decline of -92,006 contracts from the previous week which had a total of -40,946 net contracts.
This week’s current strength score (the trader positioning range over the past three years, measured from 0 to 100) shows the speculators are currently Bullish with a score of 62.9 percent. The commercials are Bullish with a score of 50.6 percent and the small traders (not shown in chart) are Bearish-Extreme with a score of 2.2 percent.
| 2-Year Treasury Note Statistics | SPECULATORS | COMMERCIALS | SMALL TRADERS |
| – Percent of Open Interest Longs: | 17.6 | 73.6 | 6.5 |
| – Percent of Open Interest Shorts: | 24.3 | 64.9 | 8.5 |
| – Net Position: | -132,952 | 172,598 | -39,646 |
| – Gross Longs: | 350,293 | 1,465,365 | 129,379 |
| – Gross Shorts: | 483,245 | 1,292,767 | 169,025 |
| – Long to Short Ratio: | 0.7 to 1 | 1.1 to 1 | 0.8 to 1 |
| NET POSITION TREND: | |||
| – COT Index Score (3 Year Range Pct): | 62.9 | 50.6 | 2.2 |
| – COT Index Reading (3 Year Range): | Bullish | Bullish | Bearish-Extreme |
| NET POSITION MOVEMENT INDEX: | |||
| – 6-Week Change in Strength Index: | -15.0 | 22.1 | -28.3 |
5-Year Treasury Note Futures:
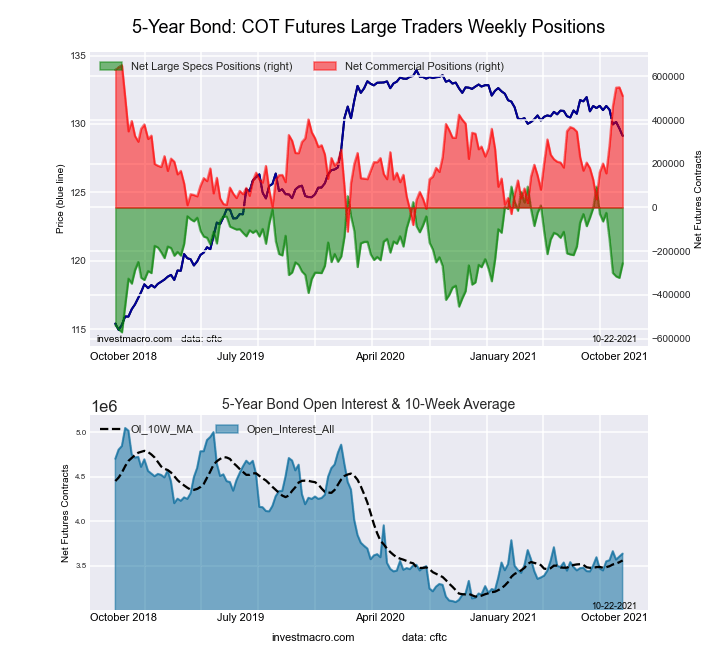 The 5-Year Treasury Note large speculator standing this week resulted in a net position of -255,211 contracts in the data reported through Tuesday. This was a weekly lift of 66,208 contracts from the previous week which had a total of -321,419 net contracts.
This week’s current strength score (the trader positioning range over the past three years, measured from 0 to 100) shows the speculators are currently Bearish with a score of 47.4 percent. The commercials are Bullish-Extreme with a score of 81.5 percent and the small traders (not shown in chart) are Bearish-Extreme with a score of 0.0 percent.
| 5-Year Treasury Note Statistics | SPECULATORS | COMMERCIALS | SMALL TRADERS |
| – Percent of Open Interest Longs: | 11.4 | 77.7 | 7.0 |
| – Percent of Open Interest Shorts: | 18.4 | 63.7 | 14.0 |
| – Net Position: | -255,211 | 510,373 | -255,162 |
| – Gross Longs: | 414,711 | 2,827,556 | 253,812 |
| – Gross Shorts: | 669,922 | 2,317,183 | 508,974 |
| – Long to Short Ratio: | 0.6 to 1 | 1.2 to 1 | 0.5 to 1 |
| NET POSITION TREND: | |||
| – COT Index Score (3 Year Range Pct): | 47.4 | 81.5 | 0.0 |
| – COT Index Reading (3 Year Range): | Bearish | Bullish-Extreme | Bearish-Extreme |
| NET POSITION MOVEMENT INDEX: | |||
| – 6-Week Change in Strength Index: | -28.8 | 40.6 | -36.1 |
10-Year Treasury Note Futures:
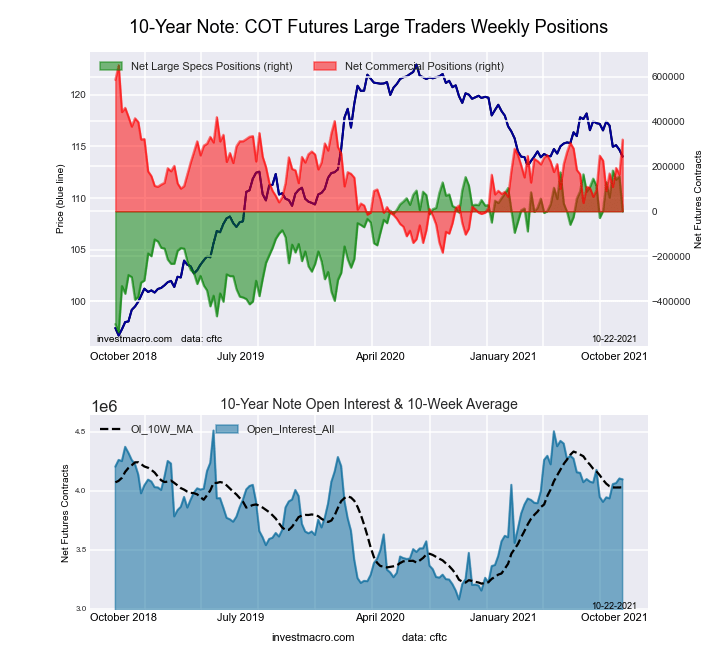 The 10-Year Treasury Note large speculator standing this week resulted in a net position of -544 contracts in the data reported through Tuesday. This was a weekly fall of -156,586 contracts from the previous week which had a total of 156,042 net contracts.
This week’s current strength score (the trader positioning range over the past three years, measured from 0 to 100) shows the speculators are currently Bullish with a score of 74.8 percent. The commercials are Bullish with a score of 60.3 percent and the small traders (not shown in chart) are Bearish-Extreme with a score of 3.6 percent.
| 10-Year Treasury Note Statistics | SPECULATORS | COMMERCIALS | SMALL TRADERS |
| – Percent of Open Interest Longs: | 18.2 | 71.4 | 7.2 |
| – Percent of Open Interest Shorts: | 18.2 | 63.6 | 15.0 |
| – Net Position: | -544 | 319,388 | -318,844 |
| – Gross Longs: | 743,719 | 2,922,085 | 295,191 |
| – Gross Shorts: | 744,263 | 2,602,697 | 614,035 |
| – Long to Short Ratio: | 1.0 to 1 | 1.1 to 1 | 0.5 to 1 |
| NET POSITION TREND: | |||
| – COT Index Score (3 Year Range Pct): | 74.8 | 60.3 | 3.6 |
| – COT Index Reading (3 Year Range): | Bullish | Bullish | Bearish-Extreme |
| NET POSITION MOVEMENT INDEX: | |||
| – 6-Week Change in Strength Index: | -0.2 | 11.2 | -21.7 |
Ultra 10-Year Notes Futures:
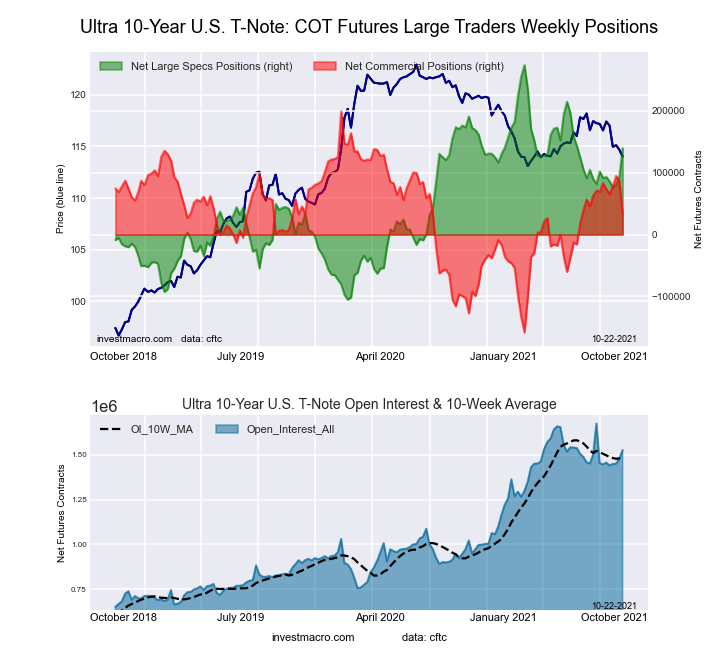 The Ultra 10-Year Notes large speculator standing this week resulted in a net position of 139,559 contracts in the data reported through Tuesday. This was a weekly increase of 45,454 contracts from the previous week which had a total of 94,105 net contracts.
This week’s current strength score (the trader positioning range over the past three years, measured from 0 to 100) shows the speculators are currently Bullish with a score of 64.6 percent. The commercials are Bullish with a score of 53.3 percent and the small traders (not shown in chart) are Bearish-Extreme with a score of 5.6 percent.
| Ultra 10-Year Notes Statistics | SPECULATORS | COMMERCIALS | SMALL TRADERS |
| – Percent of Open Interest Longs: | 19.7 | 72.8 | 7.1 |
| – Percent of Open Interest Shorts: | 10.6 | 70.7 | 18.4 |
| – Net Position: | 139,559 | 32,149 | -171,708 |
| – Gross Longs: | 301,286 | 1,110,821 | 108,529 |
| – Gross Shorts: | 161,727 | 1,078,672 | 280,237 |
| – Long to Short Ratio: | 1.9 to 1 | 1.0 to 1 | 0.4 to 1 |
| NET POSITION TREND: | |||
| – COT Index Score (3 Year Range Pct): | 64.6 | 53.3 | 5.6 |
| – COT Index Reading (3 Year Range): | Bullish | Bullish | Bearish-Extreme |
| NET POSITION MOVEMENT INDEX: | |||
| – 6-Week Change in Strength Index: | 12.7 | -14.3 | 1.9 |
US Treasury Bonds Futures:
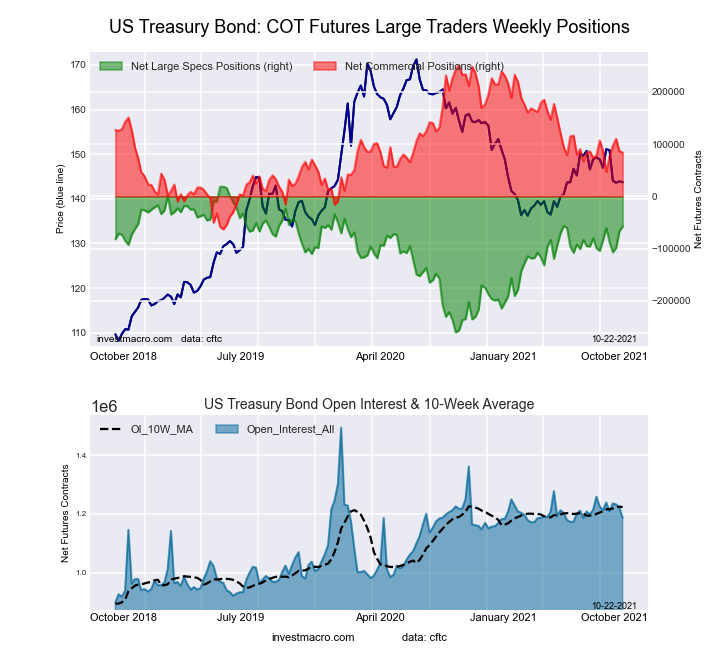 The US Treasury Bonds large speculator standing this week resulted in a net position of -57,571 contracts in the data reported through Tuesday. This was a weekly boost of 8,980 contracts from the previous week which had a total of -66,551 net contracts.
This week’s current strength score (the trader positioning range over the past three years, measured from 0 to 100) shows the speculators are currently Bullish with a score of 72.7 percent. The commercials are Bearish with a score of 46.8 percent and the small traders (not shown in chart) are Bearish with a score of 31.8 percent.
| US Treasury Bonds Statistics | SPECULATORS | COMMERCIALS | SMALL TRADERS |
| – Percent of Open Interest Longs: | 9.9 | 74.8 | 13.6 |
| – Percent of Open Interest Shorts: | 14.8 | 67.7 | 15.8 |
| – Net Position: | -57,571 | 83,737 | -26,166 |
| – Gross Longs: | 117,543 | 887,561 | 161,202 |
| – Gross Shorts: | 175,114 | 803,824 | 187,368 |
| – Long to Short Ratio: | 0.7 to 1 | 1.1 to 1 | 0.9 to 1 |
| NET POSITION TREND: | |||
| – COT Index Score (3 Year Range Pct): | 72.7 | 46.8 | 31.8 |
| – COT Index Reading (3 Year Range): | Bullish | Bearish | Bearish |
| NET POSITION MOVEMENT INDEX: | |||
| – 6-Week Change in Strength Index: | 9.3 | -0.9 | -18.4 |
Ultra US Treasury Bonds Futures:
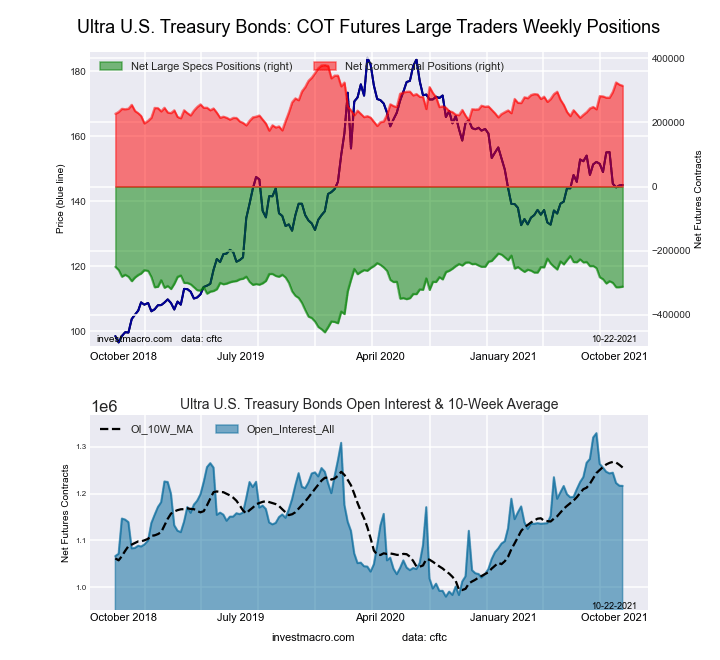 The Ultra US Treasury Bonds large speculator standing this week resulted in a net position of -311,777 contracts in the data reported through Tuesday. This was a weekly boost of 1,637 contracts from the previous week which had a total of -313,414 net contracts.
This week’s current strength score (the trader positioning range over the past three years, measured from 0 to 100) shows the speculators are currently Bullish with a score of 58.0 percent. The commercials are Bullish with a score of 68.5 percent and the small traders (not shown in chart) are Bearish with a score of 26.8 percent.
| Ultra US Treasury Bonds Statistics | SPECULATORS | COMMERCIALS | SMALL TRADERS |
| – Percent of Open Interest Longs: | 5.0 | 81.4 | 12.6 |
| – Percent of Open Interest Shorts: | 30.6 | 55.6 | 12.7 |
| – Net Position: | -311,777 | 313,784 | -2,007 |
| – Gross Longs: | 60,848 | 989,707 | 152,699 |
| – Gross Shorts: | 372,625 | 675,923 | 154,706 |
| – Long to Short Ratio: | 0.2 to 1 | 1.5 to 1 | 1.0 to 1 |
| NET POSITION TREND: | |||
| – COT Index Score (3 Year Range Pct): | 58.0 | 68.5 | 26.8 |
| – COT Index Reading (3 Year Range): | Bullish | Bullish | Bearish |
| NET POSITION MOVEMENT INDEX: | |||
| – 6-Week Change in Strength Index: | -9.5 | 16.2 | -7.1 |
Article By InvestMacro – Receive our weekly COT Reports by Email
*COT Report: The COT data, released weekly to the public each Friday, is updated through the most recent Tuesday (data is 3 days old) and shows a quick view of how large speculators or non-commercials (for-profit traders) were positioned in the futures markets.
The CFTC categorizes trader positions according to commercial hedgers (traders who use futures contracts for hedging as part of the business), non-commercials (large traders who speculate to realize trading profits) and nonreportable traders (usually small traders/speculators) as well as their open interest (contracts open in the market at time of reporting).
Find CFTC criteria here: (http://www.cftc.gov/MarketReports/CommitmentsofTraders/ExplanatoryNotes/index.htm).

- The Bank of Canada kept its interest rate unchanged. Platinum prices reached a three‑week high Jul 16, 2026
- Stock indices rose after the release of US inflation data. China’s GDP slowed sharply Jul 15, 2026
- GBP/USD Awaits Political News: What Will Happen Next Jul 15, 2026
- USD/JPY Holds at Highs: Pressure Lingers on Yen Jul 14, 2026
- Oil prices jumped 4% amid a new wave of escalation between the US and Iran Jul 13, 2026
- EUR/USD: US Inflation Will Determine Everything Jul 13, 2026
- COT Metals Charts: Weekly Speculator Bets see small gains for Silver & Gold Jul 12, 2026
- COT Bonds Charts: Speculator Bets led by SOFR 3-Months & 2-Year Bonds Jul 12, 2026
- COT Energy Charts: Weekly Speculator Changes led by Brent Oil Jul 12, 2026
- COT Soft Commodities Charts: Weekly Speculator Changes led by Sugar, Corn & Soybeans Jul 12, 2026