
By InvestMacro | COT Home | Data Tables | Data Downloads | Newsletter
Here are the latest charts and statistics for the Commitment of Traders (COT) data published by the Commodities Futures Trading Commission (CFTC).
The latest COT data is updated through Tuesday October 12th 2021 and shows a quick view of how large traders (for-profit speculators and commercial entities) were positioned in the futures markets.
Highlighting this week’s COT Bonds data is the 10-Year Treasury Note which has seen its weekly speculator position rise for four out of the past six weeks. The 10-Year had a negative net contract position as recently as August 31st before speculators boosted their positions by almost 200,000 net contracts from September 7th to October 12th. Interestingly, at the current moment, both the speculators and the commercial traders (163,158 net contracts) are bullish on the 10-Year, according to their net contracts. On the other side of the bet are the small traders which are net bearish with a total of -319,200 contracts as well as an extremely bearish strength index score.
| Oct-12-2021 | OI | OI-Index | Spec-Net | Spec-Index | Com-Net | COM-Index | Smalls-Net | Smalls-Index |
|---|---|---|---|---|---|---|---|---|
| Eurodollar | 12,837,299 | 71 | -863,600 | 34 | 1,133,791 | 60 | -270,191 | 68 |
| FedFunds | 1,190,212 | 16 | -69,085 | 31 | 79,999 | 70 | -10,914 | 42 |
| 2-Year | 1,845,270 | 3 | -40,946 | 83 | 60,855 | 29 | -19,909 | 14 |
| Long T-Bond | 1,222,493 | 54 | -66,551 | 70 | 86,248 | 48 | -19,697 | 37 |
| 10-Year | 4,102,714 | 72 | 156,042 | 97 | 163,158 | 42 | -319,200 | 3 |
| 5-Year | 3,604,864 | 26 | -321,419 | 52 | 549,713 | 66 | -228,294 | 2 |
3-Month Eurodollars Futures:
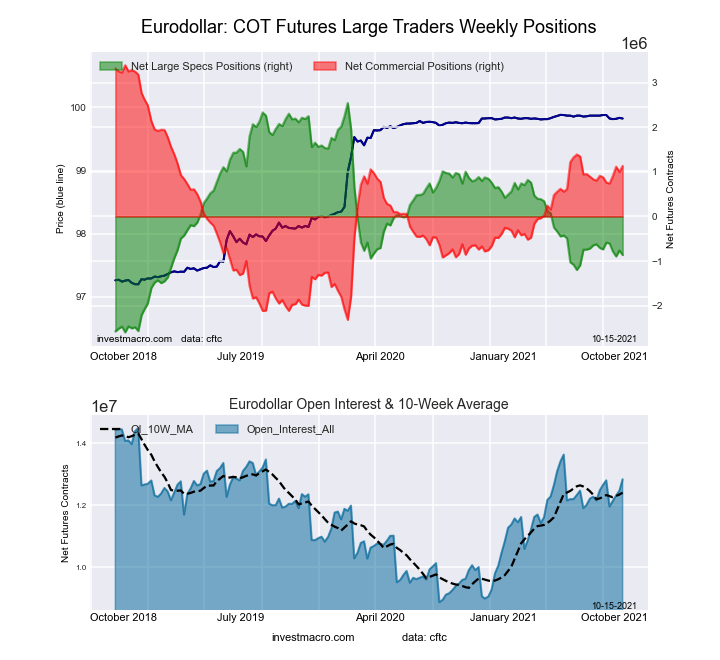 The 3-Month Eurodollars large speculator standing this week recorded a net position of -863,600 contracts in the data reported through Tuesday. This was a weekly decrease of -102,757 contracts from the previous week which had a total of -760,843 net contracts.
Free Reports:
 Download Our Metatrader 4 Indicators – Put Our Free MetaTrader 4 Custom Indicators on your charts when you join our Weekly Newsletter
 Get our Weekly Commitment of Traders Reports - See where the biggest traders (Hedge Funds and Commercial Hedgers) are positioned in the futures markets on a weekly basis.
This week’s current strength score (the trader positioning range over the past three years, measured from 0 to 100) shows the speculators are currently Bearish with a score of 33.7 percent. The commercials are Bullish with a score of 60.5 percent and the small traders (not shown in chart) are Bullish with a score of 67.7 percent.
| 3-Month Eurodollars Statistics | SPECULATORS | COMMERCIALS | SMALL TRADERS |
| – Percent of Open Interest Longs: | 13.2 | 61.8 | 4.4 |
| – Percent of Open Interest Shorts: | 19.9 | 53.0 | 6.5 |
| – Net Position: | -863,600 | 1,133,791 | -270,191 |
| – Gross Longs: | 1,691,897 | 7,936,364 | 566,490 |
| – Gross Shorts: | 2,555,497 | 6,802,573 | 836,681 |
| – Long to Short Ratio: | 0.7 to 1 | 1.2 to 1 | 0.7 to 1 |
| NET POSITION TREND: | |||
| – COT Index Score (3 Year Range Pct): | 33.7 | 60.5 | 67.7 |
| – COT Index Reading (3 Year Range): | Bearish | Bullish | Bullish |
| NET POSITION MOVEMENT INDEX: | |||
| – 6-Week Change in Strength Index: | -2.5 | 4.4 | -16.1 |
30-Day Federal Funds Futures:
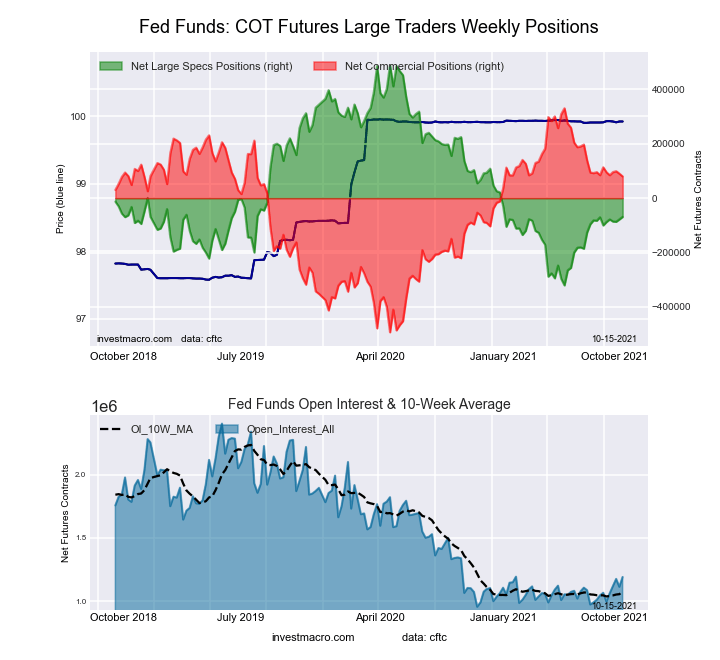 The 30-Day Federal Funds large speculator standing this week recorded a net position of -69,085 contracts in the data reported through Tuesday. This was a weekly gain of 9,263 contracts from the previous week which had a total of -78,348 net contracts.
This week’s current strength score (the trader positioning range over the past three years, measured from 0 to 100) shows the speculators are currently Bearish with a score of 31.1 percent. The commercials are Bullish with a score of 69.6 percent and the small traders (not shown in chart) are Bearish with a score of 41.7 percent.
| 30-Day Federal Funds Statistics | SPECULATORS | COMMERCIALS | SMALL TRADERS |
| – Percent of Open Interest Longs: | 5.7 | 77.2 | 1.8 |
| – Percent of Open Interest Shorts: | 11.5 | 70.5 | 2.7 |
| – Net Position: | -69,085 | 79,999 | -10,914 |
| – Gross Longs: | 68,061 | 918,640 | 20,954 |
| – Gross Shorts: | 137,146 | 838,641 | 31,868 |
| – Long to Short Ratio: | 0.5 to 1 | 1.1 to 1 | 0.7 to 1 |
| NET POSITION TREND: | |||
| – COT Index Score (3 Year Range Pct): | 31.1 | 69.6 | 41.7 |
| – COT Index Reading (3 Year Range): | Bearish | Bullish | Bearish |
| NET POSITION MOVEMENT INDEX: | |||
| – 6-Week Change in Strength Index: | 3.9 | -4.1 | 5.0 |
2-Year Treasury Note Futures:
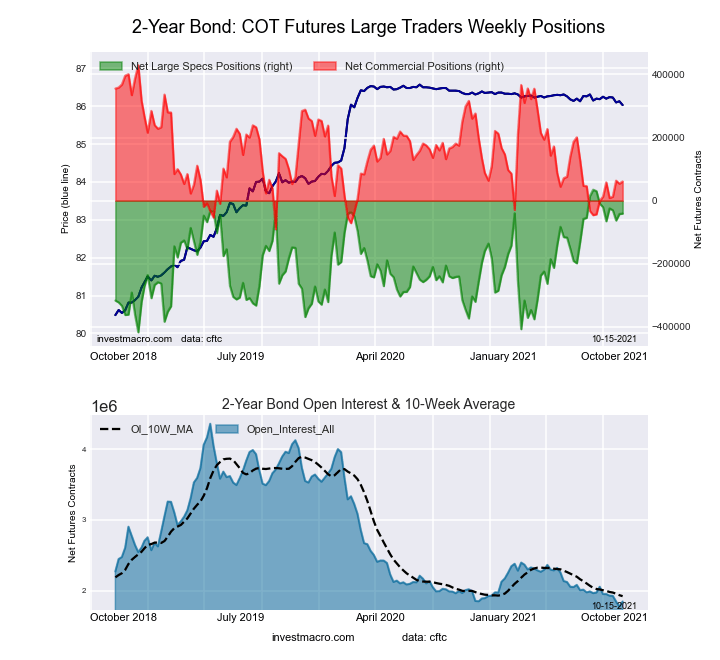 The 2-Year Treasury Note large speculator standing this week recorded a net position of -40,946 contracts in the data reported through Tuesday. This was a weekly boost of 1,581 contracts from the previous week which had a total of -42,527 net contracts.
This week’s current strength score (the trader positioning range over the past three years, measured from 0 to 100) shows the speculators are currently Bullish-Extreme with a score of 83.3 percent. The commercials are Bearish with a score of 29.1 percent and the small traders (not shown in chart) are Bearish-Extreme with a score of 14.1 percent.
| 2-Year Treasury Note Statistics | SPECULATORS | COMMERCIALS | SMALL TRADERS |
| – Percent of Open Interest Longs: | 17.8 | 71.7 | 7.0 |
| – Percent of Open Interest Shorts: | 20.0 | 68.4 | 8.1 |
| – Net Position: | -40,946 | 60,855 | -19,909 |
| – Gross Longs: | 328,329 | 1,322,378 | 128,740 |
| – Gross Shorts: | 369,275 | 1,261,523 | 148,649 |
| – Long to Short Ratio: | 0.9 to 1 | 1.0 to 1 | 0.9 to 1 |
| NET POSITION TREND: | |||
| – COT Index Score (3 Year Range Pct): | 83.3 | 29.1 | 14.1 |
| – COT Index Reading (3 Year Range): | Bullish-Extreme | Bearish | Bearish-Extreme |
| NET POSITION MOVEMENT INDEX: | |||
| – 6-Week Change in Strength Index: | -4.5 | 9.3 | -16.7 |
5-Year Treasury Note Futures:
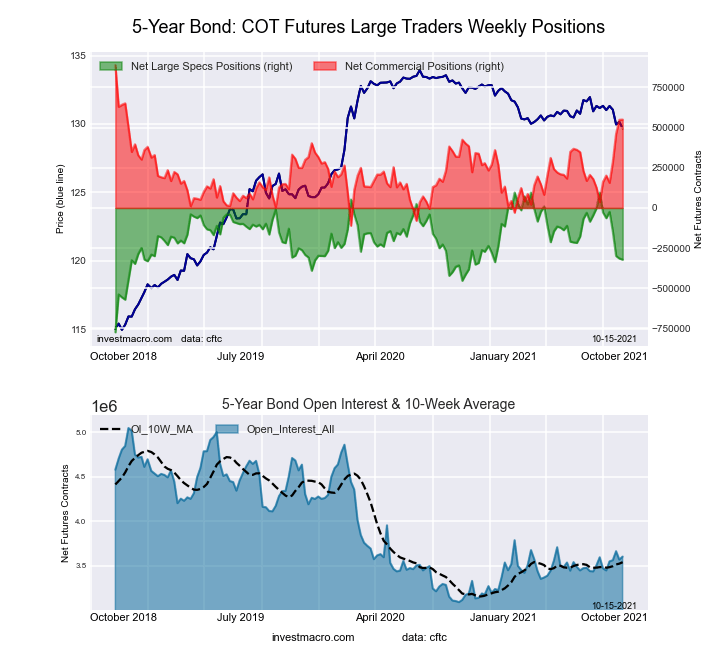 The 5-Year Treasury Note large speculator standing this week recorded a net position of -321,419 contracts in the data reported through Tuesday. This was a weekly decline of -6,595 contracts from the previous week which had a total of -314,824 net contracts.
This week’s current strength score (the trader positioning range over the past three years, measured from 0 to 100) shows the speculators are currently Bullish with a score of 52.0 percent. The commercials are Bullish with a score of 66.1 percent and the small traders (not shown in chart) are Bearish-Extreme with a score of 1.6 percent.
| 5-Year Treasury Note Statistics | SPECULATORS | COMMERCIALS | SMALL TRADERS |
| – Percent of Open Interest Longs: | 10.0 | 79.2 | 7.2 |
| – Percent of Open Interest Shorts: | 18.9 | 64.0 | 13.5 |
| – Net Position: | -321,419 | 549,713 | -228,294 |
| – Gross Longs: | 360,916 | 2,855,878 | 258,857 |
| – Gross Shorts: | 682,335 | 2,306,165 | 487,151 |
| – Long to Short Ratio: | 0.5 to 1 | 1.2 to 1 | 0.5 to 1 |
| NET POSITION TREND: | |||
| – COT Index Score (3 Year Range Pct): | 52.0 | 66.1 | 1.6 |
| – COT Index Reading (3 Year Range): | Bullish | Bullish | Bearish-Extreme |
| NET POSITION MOVEMENT INDEX: | |||
| – 6-Week Change in Strength Index: | -33.7 | 38.9 | -31.3 |
10-Year Treasury Note Futures:
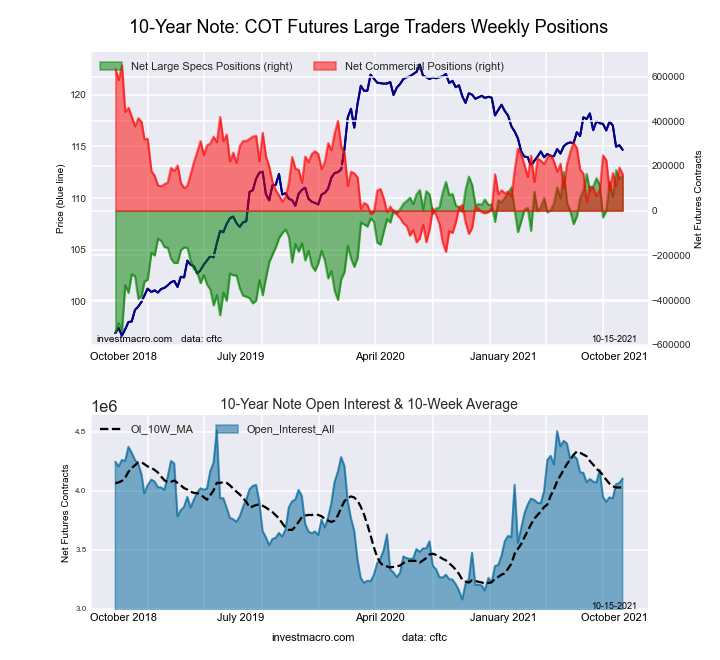 The 10-Year Treasury Note large speculator standing this week recorded a net position of 156,042 contracts in the data reported through Tuesday. This was a weekly rise of 14,709 contracts from the previous week which had a total of 141,333 net contracts.
This week’s current strength score (the trader positioning range over the past three years, measured from 0 to 100) shows the speculators are currently Bullish-Extreme with a score of 96.5 percent. The commercials are Bearish with a score of 41.6 percent and the small traders (not shown in chart) are Bearish-Extreme with a score of 3.5 percent.
| 10-Year Treasury Note Statistics | SPECULATORS | COMMERCIALS | SMALL TRADERS |
| – Percent of Open Interest Longs: | 21.5 | 68.1 | 7.3 |
| – Percent of Open Interest Shorts: | 17.7 | 64.2 | 15.1 |
| – Net Position: | 156,042 | 163,158 | -319,200 |
| – Gross Longs: | 883,621 | 2,795,156 | 300,686 |
| – Gross Shorts: | 727,579 | 2,631,998 | 619,886 |
| – Long to Short Ratio: | 1.2 to 1 | 1.1 to 1 | 0.5 to 1 |
| NET POSITION TREND: | |||
| – COT Index Score (3 Year Range Pct): | 96.5 | 41.6 | 3.5 |
| – COT Index Reading (3 Year Range): | Bullish-Extreme | Bearish | Bearish-Extreme |
| NET POSITION MOVEMENT INDEX: | |||
| – 6-Week Change in Strength Index: | 25.6 | -10.1 | -23.8 |
Ultra 10-Year Notes Futures:
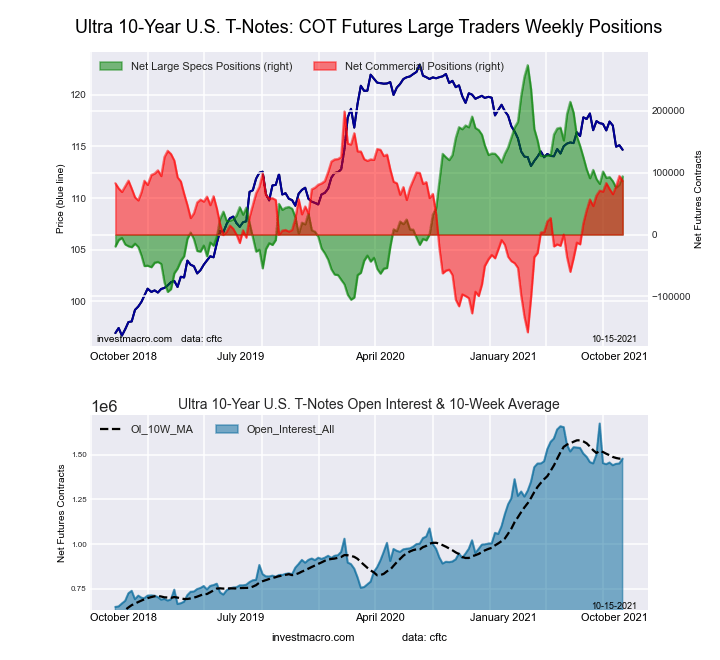 The Ultra 10-Year Notes large speculator standing this week recorded a net position of 94,105 contracts in the data reported through Tuesday. This was a weekly advance of 13,226 contracts from the previous week which had a total of 80,879 net contracts.
This week’s current strength score (the trader positioning range over the past three years, measured from 0 to 100) shows the speculators are currently Bullish with a score of 52.6 percent. The commercials are Bullish with a score of 68.5 percent and the small traders (not shown in chart) are Bearish-Extreme with a score of 0.0 percent.
| Ultra 10-Year Notes Statistics | SPECULATORS | COMMERCIALS | SMALL TRADERS |
| – Percent of Open Interest Longs: | 17.7 | 74.4 | 7.2 |
| – Percent of Open Interest Shorts: | 11.4 | 68.5 | 19.4 |
| – Net Position: | 94,105 | 86,315 | -180,420 |
| – Gross Longs: | 262,156 | 1,099,485 | 106,966 |
| – Gross Shorts: | 168,051 | 1,013,170 | 287,386 |
| – Long to Short Ratio: | 1.6 to 1 | 1.1 to 1 | 0.4 to 1 |
| NET POSITION TREND: | |||
| – COT Index Score (3 Year Range Pct): | 52.6 | 68.5 | 0.0 |
| – COT Index Reading (3 Year Range): | Bullish | Bullish | Bearish-Extreme |
| NET POSITION MOVEMENT INDEX: | |||
| – 6-Week Change in Strength Index: | -2.1 | 4.7 | -5.9 |
US Treasury Bonds Futures:
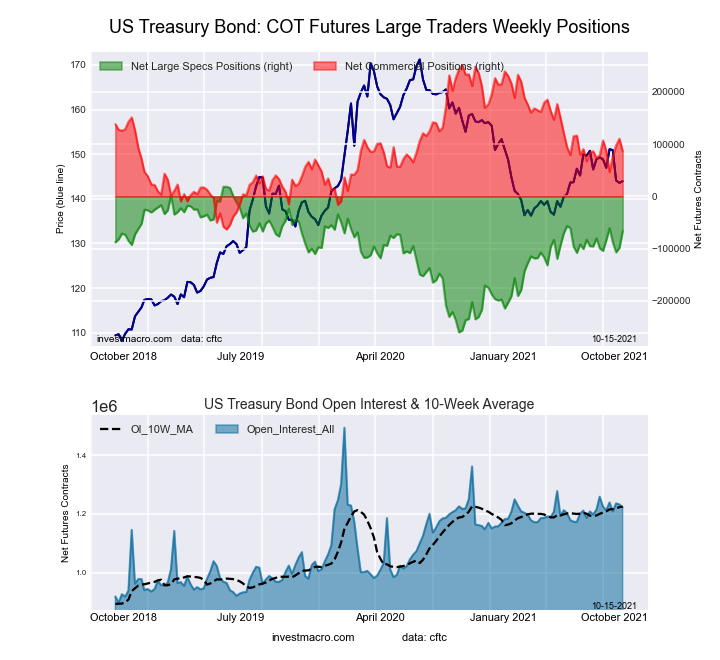 The US Treasury Bonds large speculator standing this week recorded a net position of -66,551 contracts in the data reported through Tuesday. This was a weekly advance of 32,098 contracts from the previous week which had a total of -98,649 net contracts.
This week’s current strength score (the trader positioning range over the past three years, measured from 0 to 100) shows the speculators are currently Bullish with a score of 69.5 percent. The commercials are Bearish with a score of 47.6 percent and the small traders (not shown in chart) are Bearish with a score of 37.0 percent.
| US Treasury Bonds Statistics | SPECULATORS | COMMERCIALS | SMALL TRADERS |
| – Percent of Open Interest Longs: | 9.9 | 74.3 | 13.7 |
| – Percent of Open Interest Shorts: | 15.3 | 67.2 | 15.3 |
| – Net Position: | -66,551 | 86,248 | -19,697 |
| – Gross Longs: | 120,942 | 908,174 | 167,921 |
| – Gross Shorts: | 187,493 | 821,926 | 187,618 |
| – Long to Short Ratio: | 0.6 to 1 | 1.1 to 1 | 0.9 to 1 |
| NET POSITION TREND: | |||
| – COT Index Score (3 Year Range Pct): | 69.5 | 47.6 | 37.0 |
| – COT Index Reading (3 Year Range): | Bullish | Bearish | Bearish |
| NET POSITION MOVEMENT INDEX: | |||
| – 6-Week Change in Strength Index: | 13.5 | -6.5 | -13.6 |
Ultra US Treasury Bonds Futures:
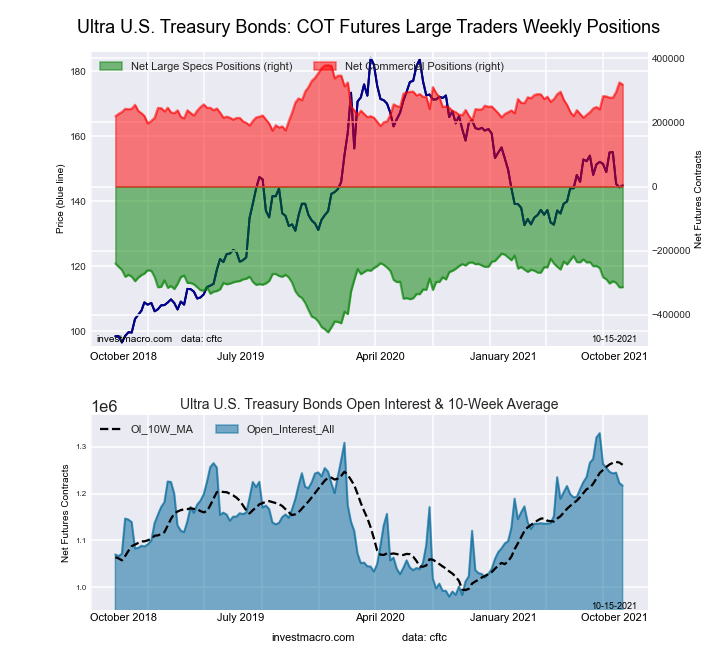 The Ultra US Treasury Bonds large speculator standing this week recorded a net position of -313,414 contracts in the data reported through Tuesday. This was a weekly rise of 220 contracts from the previous week which had a total of -313,634 net contracts.
This week’s current strength score (the trader positioning range over the past three years, measured from 0 to 100) shows the speculators are currently Bullish with a score of 57.4 percent. The commercials are Bullish with a score of 70.3 percent and the small traders (not shown in chart) are Bearish with a score of 25.4 percent.
| Ultra US Treasury Bonds Statistics | SPECULATORS | COMMERCIALS | SMALL TRADERS |
| – Percent of Open Interest Longs: | 4.5 | 82.1 | 12.4 |
| – Percent of Open Interest Shorts: | 30.3 | 56.0 | 12.8 |
| – Net Position: | -313,414 | 317,409 | -3,995 |
| – Gross Longs: | 54,907 | 998,802 | 151,411 |
| – Gross Shorts: | 368,321 | 681,393 | 155,406 |
| – Long to Short Ratio: | 0.1 to 1 | 1.5 to 1 | 1.0 to 1 |
| NET POSITION TREND: | |||
| – COT Index Score (3 Year Range Pct): | 57.4 | 70.3 | 25.4 |
| – COT Index Reading (3 Year Range): | Bullish | Bullish | Bearish |
| NET POSITION MOVEMENT INDEX: | |||
| – 6-Week Change in Strength Index: | -12.7 | 17.5 | -3.4 |
Article By InvestMacro – Receive our weekly COT Reports by Email
*COT Report: The COT data, released weekly to the public each Friday, is updated through the most recent Tuesday (data is 3 days old) and shows a quick view of how large speculators or non-commercials (for-profit traders) were positioned in the futures markets.
The CFTC categorizes trader positions according to commercial hedgers (traders who use futures contracts for hedging as part of the business), non-commercials (large traders who speculate to realize trading profits) and nonreportable traders (usually small traders/speculators) as well as their open interest (contracts open in the market at time of reporting).
Find CFTC criteria here: (http://www.cftc.gov/MarketReports/CommitmentsofTraders/ExplanatoryNotes/index.htm).

- COT Metals Charts: Weekly Speculator Bets led by Copper & Steel Jul 18, 2026
- COT Bonds Charts: Weekly Speculator Bets led by 2-Year, SOFR 3M & 5-Year Bonds Jul 18, 2026
- COT Energy Charts: Weekly Speculator Bets led by Brent Oil & Heating Oil Jul 18, 2026
- COT Soft Commodities Charts: Weekly Speculator Bets led by Wheat, Corn & Soybean Meal Jul 18, 2026
- The Bank of Canada kept its interest rate unchanged. Platinum prices reached a three‑week high Jul 16, 2026
- Stock indices rose after the release of US inflation data. China’s GDP slowed sharply Jul 15, 2026
- GBP/USD Awaits Political News: What Will Happen Next Jul 15, 2026
- USD/JPY Holds at Highs: Pressure Lingers on Yen Jul 14, 2026
- Oil prices jumped 4% amid a new wave of escalation between the US and Iran Jul 13, 2026
- EUR/USD: US Inflation Will Determine Everything Jul 13, 2026