
By InvestMacro.com COT Home | Data Tables | Data Downloads | Newsletter
Here are the latest charts and statistics for the Commitment of Traders (COT) data published by the Commodities Futures Trading Commission (CFTC).
The latest COT data is updated through Tuesday October 12th 2021 and shows a quick view of how large traders (for-profit speculators and commercial entities) were positioned in the futures markets.
Highlighting this week’s COT Metals data is the Palladium speculator contracts which are now in their eighth straight week of bearish levels. Palladium has seen its fortunes fall in the second half of 2021 after a multi-year uptrend brought prices to all-time high levels in May of 2021. Palladium prices have now cooled off by approximately 30 percent since May and has prompted speculators to take on bearish positions (negative net contracts). Amazingly, when spec contracts went negative on August 24th, this marked the first negative net speculator position since February 25th of 2003, according to the CFTC data, a span of more than eighteen years.
| Oct-12-2021 | OI | OI-Index | Spec-Net | Spec-Index | Com-Net | COM-Index | Smalls-Net | Smalls-Index |
|---|---|---|---|---|---|---|---|---|
| WTI Crude | 2,231,227 | 48 | 404,776 | 41 | -453,684 | 46 | 48,908 | 84 |
| Gold | 484,382 | 21 | 185,539 | 54 | -207,614 | 46 | 22,075 | 33 |
| Silver | 139,403 | 6 | 17,987 | 40 | -30,292 | 69 | 12,305 | 11 |
| Copper | 194,817 | 23 | 22,481 | 59 | -25,867 | 42 | 3,386 | 45 |
| Palladium | 9,296 | 13 | -2,496 | 4 | 2,625 | 95 | -129 | 37 |
| Platinum | 59,344 | 21 | 10,919 | 18 | -16,756 | 85 | 5,837 | 43 |
| Natural Gas | 1,314,022 | 40 | -130,902 | 39 | 91,201 | 60 | 39,701 | 79 |
| Brent | 205,521 | 44 | -34,924 | 57 | 29,563 | 37 | 5,361 | 82 |
| Heating Oil | 429,908 | 68 | 39,137 | 100 | -65,644 | 1 | 26,507 | 90 |
| Soybeans | 759,101 | 35 | 41,990 | 41 | -9,665 | 64 | -32,325 | 18 |
| Corn | 1,400,377 | 4 | 279,288 | 66 | -223,336 | 40 | -55,952 | 11 |
| Coffee | 305,141 | 62 | 69,085 | 99 | -73,808 | 2 | 4,723 | 21 |
| Sugar | 891,672 | 25 | 246,188 | 87 | -294,674 | 12 | 48,486 | 68 |
| Wheat | 385,204 | 23 | -4,534 | 43 | 12,969 | 53 | -8,435 | 61 |
Gold Comex Futures:
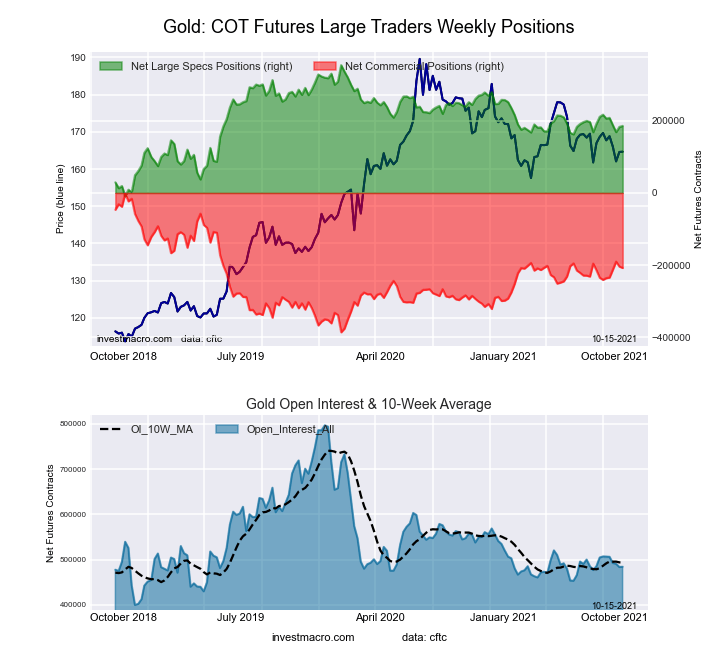 The Gold Comex Futures large speculator standing this week reached a net position of 185,539 contracts in the data reported through Tuesday. This was a weekly gain of 2,957 contracts from the previous week which had a total of 182,582 net contracts.
Free Reports:
 Get our Weekly Commitment of Traders Reports - See where the biggest traders (Hedge Funds and Commercial Hedgers) are positioned in the futures markets on a weekly basis.
 Download Our Metatrader 4 Indicators – Put Our Free MetaTrader 4 Custom Indicators on your charts when you join our Weekly Newsletter
This week’s current strength score (the trader positioning range over the past three years, measured from 0 to 100) shows the speculators are currently Bullish with a score of 53.7 percent. The commercials are Bearish with a score of 46.4 percent and the small traders (not shown in chart) are Bearish with a score of 33.2 percent.
| Gold Futures Statistics | SPECULATORS | COMMERCIALS | SMALL TRADERS |
| – Percent of Open Interest Longs: | 61.6 | 22.9 | 9.0 |
| – Percent of Open Interest Shorts: | 23.3 | 65.7 | 4.5 |
| – Net Position: | 185,539 | -207,614 | 22,075 |
| – Gross Longs: | 298,503 | 110,697 | 43,819 |
| – Gross Shorts: | 112,964 | 318,311 | 21,744 |
| – Long to Short Ratio: | 2.6 to 1 | 0.3 to 1 | 2.0 to 1 |
| NET POSITION TREND: | |||
| – COT Index Score (3 Year Range Pct): | 53.7 | 46.4 | 33.2 |
| – COT Index Reading (3 Year Range): | Bullish | Bearish | Bearish |
| NET POSITION MOVEMENT INDEX: | |||
| – 6-Week Change in Strength Index: | -8.5 | 8.6 | -4.9 |
Silver Comex Futures:
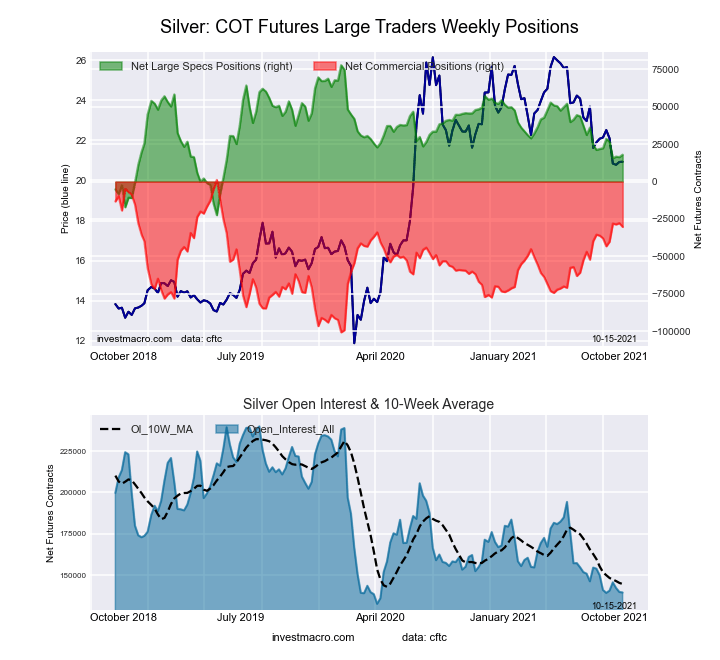 The Silver Comex Futures large speculator standing this week reached a net position of 17,987 contracts in the data reported through Tuesday. This was a weekly lift of 1,608 contracts from the previous week which had a total of 16,379 net contracts.
This week’s current strength score (the trader positioning range over the past three years, measured from 0 to 100) shows the speculators are currently Bearish with a score of 40.3 percent. The commercials are Bullish with a score of 69.2 percent and the small traders (not shown in chart) are Bearish-Extreme with a score of 11.4 percent.
| Silver Futures Statistics | SPECULATORS | COMMERCIALS | SMALL TRADERS |
| – Percent of Open Interest Longs: | 45.5 | 30.9 | 18.0 |
| – Percent of Open Interest Shorts: | 32.6 | 52.6 | 9.2 |
| – Net Position: | 17,987 | -30,292 | 12,305 |
| – Gross Longs: | 63,488 | 43,055 | 25,151 |
| – Gross Shorts: | 45,501 | 73,347 | 12,846 |
| – Long to Short Ratio: | 1.4 to 1 | 0.6 to 1 | 2.0 to 1 |
| NET POSITION TREND: | |||
| – COT Index Score (3 Year Range Pct): | 40.3 | 69.2 | 11.4 |
| – COT Index Reading (3 Year Range): | Bearish | Bullish | Bearish-Extreme |
| NET POSITION MOVEMENT INDEX: | |||
| – 6-Week Change in Strength Index: | -4.3 | 7.5 | -20.1 |
Copper Grade #1 Futures:
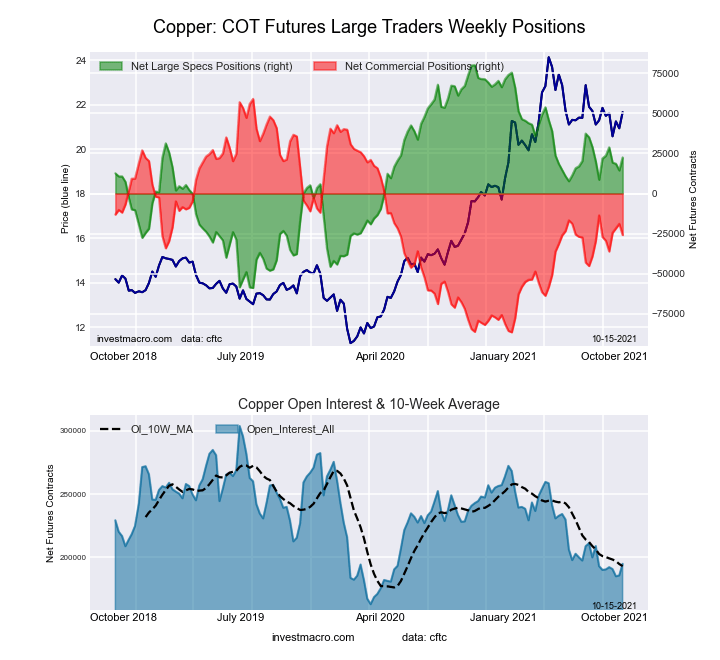 The Copper Grade #1 Futures large speculator standing this week reached a net position of 22,481 contracts in the data reported through Tuesday. This was a weekly increase of 8,064 contracts from the previous week which had a total of 14,417 net contracts.
This week’s current strength score (the trader positioning range over the past three years, measured from 0 to 100) shows the speculators are currently Bullish with a score of 58.6 percent. The commercials are Bearish with a score of 41.7 percent and the small traders (not shown in chart) are Bearish with a score of 44.9 percent.
| Copper Futures Statistics | SPECULATORS | COMMERCIALS | SMALL TRADERS |
| – Percent of Open Interest Longs: | 43.0 | 38.4 | 8.0 |
| – Percent of Open Interest Shorts: | 31.5 | 51.7 | 6.3 |
| – Net Position: | 22,481 | -25,867 | 3,386 |
| – Gross Longs: | 83,816 | 74,878 | 15,582 |
| – Gross Shorts: | 61,335 | 100,745 | 12,196 |
| – Long to Short Ratio: | 1.4 to 1 | 0.7 to 1 | 1.3 to 1 |
| NET POSITION TREND: | |||
| – COT Index Score (3 Year Range Pct): | 58.6 | 41.7 | 44.9 |
| – COT Index Reading (3 Year Range): | Bullish | Bearish | Bearish |
| NET POSITION MOVEMENT INDEX: | |||
| – 6-Week Change in Strength Index: | 0.4 | 0.8 | -10.4 |
Platinum Futures:
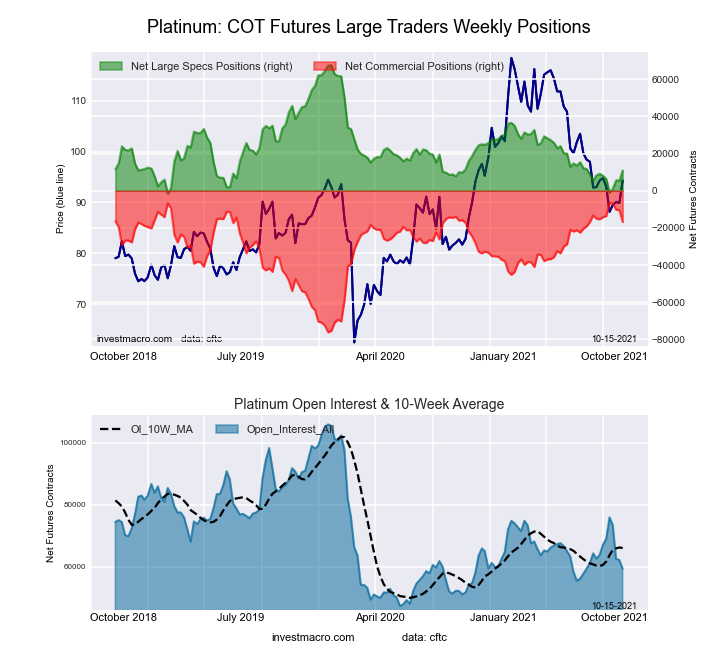 The Platinum Futures large speculator standing this week reached a net position of 10,919 contracts in the cot data reported through Tuesday. This was a weekly advance of 5,404 contracts from the previous week which had a total of 5,515 net contracts.
This week’s current strength score (the trader positioning range over the past three years, measured from 0 to 100) shows the speculators are currently Bearish-Extreme with a score of 18.1 percent. The commercials are Bullish-Extreme with a score of 85.1 percent and the small traders (not shown in chart) are Bearish with a score of 43.4 percent.
| Platinum Futures Statistics | SPECULATORS | COMMERCIALS | SMALL TRADERS |
| – Percent of Open Interest Longs: | 53.4 | 28.5 | 15.2 |
| – Percent of Open Interest Shorts: | 35.0 | 56.8 | 5.4 |
| – Net Position: | 10,919 | -16,756 | 5,837 |
| – Gross Longs: | 31,711 | 16,942 | 9,038 |
| – Gross Shorts: | 20,792 | 33,698 | 3,201 |
| – Long to Short Ratio: | 1.5 to 1 | 0.5 to 1 | 2.8 to 1 |
| NET POSITION TREND: | |||
| – COT Index Score (3 Year Range Pct): | 18.1 | 85.1 | 43.4 |
| – COT Index Reading (3 Year Range): | Bearish-Extreme | Bullish-Extreme | Bearish |
| NET POSITION MOVEMENT INDEX: | |||
| – 6-Week Change in Strength Index: | 4.1 | -3.8 | -2.9 |
Palladium Futures:
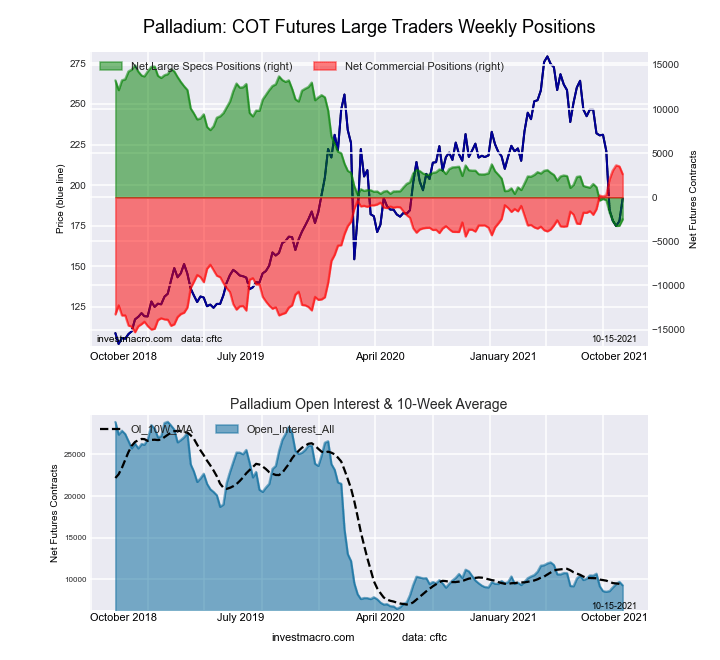 The Palladium Futures large speculator standing this week reached a net position of -2,496 contracts in the data reported through Tuesday. This was a weekly lift of 734 contracts from the previous week which had a total of -3,230 net contracts.
This week’s current strength score (the trader positioning range over the past three years, measured from 0 to 100) shows the speculators are currently Bearish-Extreme with a score of 4.1 percent. The commercials are Bullish-Extreme with a score of 94.8 percent and the small traders (not shown in chart) are Bearish with a score of 37.0 percent.
| Palladium Futures Statistics | SPECULATORS | COMMERCIALS | SMALL TRADERS |
| – Percent of Open Interest Longs: | 31.4 | 51.8 | 13.7 |
| – Percent of Open Interest Shorts: | 58.3 | 23.6 | 15.1 |
| – Net Position: | -2,496 | 2,625 | -129 |
| – Gross Longs: | 2,920 | 4,815 | 1,272 |
| – Gross Shorts: | 5,416 | 2,190 | 1,401 |
| – Long to Short Ratio: | 0.5 to 1 | 2.2 to 1 | 0.9 to 1 |
| NET POSITION TREND: | |||
| – COT Index Score (3 Year Range Pct): | 4.1 | 94.8 | 37.0 |
| – COT Index Reading (3 Year Range): | Bearish-Extreme | Bullish-Extreme | Bearish |
| NET POSITION MOVEMENT INDEX: | |||
| – 6-Week Change in Strength Index: | -12.7 | 13.4 | -13.0 |
Article By InvestMacro.com – Receive our weekly COT Reports by Email
*COT Report: The COT data, released weekly to the public each Friday, is updated through the most recent Tuesday (data is 3 days old) and shows a quick view of how large speculators or non-commercials (for-profit traders) were positioned in the futures markets.
The CFTC categorizes trader positions according to commercial hedgers (traders who use futures contracts for hedging as part of the business), non-commercials (large traders who speculate to realize trading profits) and nonreportable traders (usually small traders/speculators).
Find CFTC criteria here: (http://www.cftc.gov/MarketReports/CommitmentsofTraders/ExplanatoryNotes/index.htm).

- COT Metals Charts: Weekly Speculator Bets led by Copper & Steel Jul 18, 2026
- COT Bonds Charts: Weekly Speculator Bets led by 2-Year, SOFR 3M & 5-Year Bonds Jul 18, 2026
- COT Energy Charts: Weekly Speculator Bets led by Brent Oil & Heating Oil Jul 18, 2026
- COT Soft Commodities Charts: Weekly Speculator Bets led by Wheat, Corn & Soybean Meal Jul 18, 2026
- The Bank of Canada kept its interest rate unchanged. Platinum prices reached a three‑week high Jul 16, 2026
- Stock indices rose after the release of US inflation data. China’s GDP slowed sharply Jul 15, 2026
- GBP/USD Awaits Political News: What Will Happen Next Jul 15, 2026
- USD/JPY Holds at Highs: Pressure Lingers on Yen Jul 14, 2026
- Oil prices jumped 4% amid a new wave of escalation between the US and Iran Jul 13, 2026
- EUR/USD: US Inflation Will Determine Everything Jul 13, 2026