
By InvestMacro | COT Home | Data Tables | Data Downloads | Newsletter
Here are the latest charts and statistics for the Commitment of Traders (COT) data published by the Commodities Futures Trading Commission (CFTC).
The latest COT data is updated through Tuesday October 12th 2021 and shows a quick view of how large traders (for-profit speculators and commercial entities) were positioned in the futures markets. All currency positions are in direct relation to the US dollar where, for example, a bet for the euro is a bet that the euro will rise versus the dollar while a bet against the euro will be a bet that the euro will decline versus the dollar.
Highlighting this week’s COT Currency data is the speculator’s US Dollar Index bullish bets which have risen to the highest level in 104 weeks. Speculator wagers in favor of the Dollar Index have now increased for eight straight weeks and have climbed higher for sixteen out of the past seventeen weeks. This pushes the current position (35,062 contracts) to the most bullish standing dating back to October 15th of 2019 when net positions totaled 37,436 contracts. The speculator strength index score (current levels compared to past three years) also shows that spec sentiment has now moved into an extreme bullish position (86 percent score) for a second week.
| Oct-12-2021 | OI | OI-Index | Spec-Net | Spec-Index | Com-Net | COM-Index | Smalls-Net | Smalls-Index |
|---|---|---|---|---|---|---|---|---|
| USD Index | 62,836 | 95 | 35,062 | 86 | -42,692 | 4 | 7,630 | 100 |
| EUR | 695,329 | 82 | -18,398 | 29 | -8,953 | 73 | 27,351 | 23 |
| GBP | 172,829 | 21 | -11,979 | 65 | 20,191 | 42 | -8,212 | 39 |
| JPY | 243,617 | 100 | -76,634 | 21 | 95,092 | 84 | -18,458 | 12 |
| CHF | 57,341 | 38 | -12,972 | 47 | 29,963 | 65 | -16,991 | 13 |
| CAD | 127,827 | 15 | -27,860 | 32 | 11,728 | 59 | 16,132 | 71 |
| AUD | 177,932 | 66 | -87,608 | 2 | 102,000 | 95 | -14,392 | 20 |
| NZD | 37,340 | 19 | 8,748 | 86 | -8,151 | 18 | -597 | 45 |
| MXN | 171,754 | 34 | -39,634 | 0 | 37,759 | 100 | 1,875 | 51 |
| RUB | 54,771 | 61 | 19,308 | 59 | -21,718 | 36 | 2,410 | 100 |
| BRL | 27,338 | 26 | -373 | 68 | -107 | 33 | 480 | 73 |
| Bitcoin | 10,918 | 69 | -1,426 | 64 | 555 | 0 | 871 | 18 |
US Dollar Index Futures:
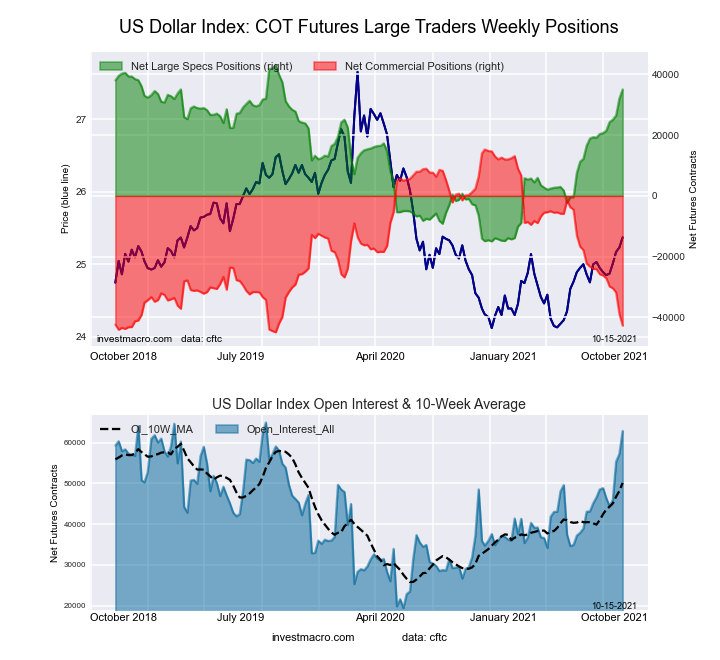 The US Dollar Index large speculator standing this week resulted in a net position of 35,062 contracts in the data reported through Tuesday. This was a weekly gain of 3,036 contracts from the previous week which had a total of 32,026 net contracts.
Free Reports:
 Get our Weekly Commitment of Traders Reports - See where the biggest traders (Hedge Funds and Commercial Hedgers) are positioned in the futures markets on a weekly basis.
 Sign Up for Our Stock Market Newsletter – Get updated on News, Charts & Rankings of Public Companies when you join our Stocks Newsletter
This week’s current strength score (the trader positioning range over the past three years, measured from 0 to 100) shows the speculators are currently Bullish-Extreme with a score of 86.3 percent. The commercials are Bearish-Extreme with a score of 3.7 percent and the small traders (not shown in chart) are Bullish-Extreme with a score of 100.0 percent.
| US DOLLAR INDEX Statistics | SPECULATORS | COMMERCIALS | SMALL TRADERS |
| – Percent of Open Interest Longs: | 78.6 | 3.4 | 14.5 |
| – Percent of Open Interest Shorts: | 22.8 | 71.3 | 2.4 |
| – Net Position: | 35,062 | -42,692 | 7,630 |
| – Gross Longs: | 49,394 | 2,131 | 9,108 |
| – Gross Shorts: | 14,332 | 44,823 | 1,478 |
| – Long to Short Ratio: | 3.4 to 1 | 0.0 to 1 | 6.2 to 1 |
| NET POSITION TREND: | |||
| – COT Index Score (3 Year Range Pct): | 86.3 | 3.7 | 100.0 |
| – COT Index Reading (3 Year Range): | Bullish-Extreme | Bearish-Extreme | Bullish-Extreme |
| NET POSITION MOVEMENT INDEX: | |||
| – 6-Week Change in Strength Index: | 24.8 | -27.4 | 23.4 |
Euro Currency Futures:
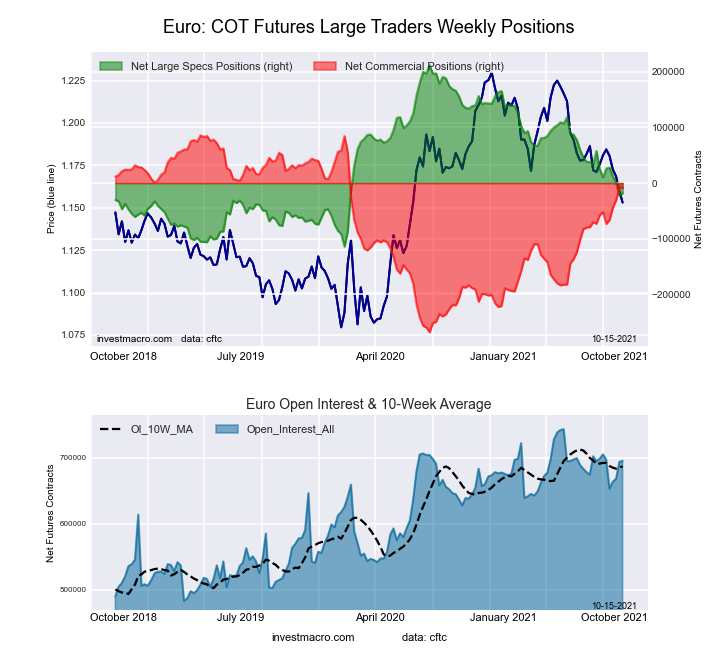 The Euro Currency large speculator standing this week resulted in a net position of -18,398 contracts in the data reported through Tuesday. This was a weekly rise of 3,936 contracts from the previous week which had a total of -22,334 net contracts.
This week’s current strength score (the trader positioning range over the past three years, measured from 0 to 100) shows the speculators are currently Bearish with a score of 29.4 percent. The commercials are Bullish with a score of 73.2 percent and the small traders (not shown in chart) are Bearish with a score of 23.3 percent.
| EURO Currency Statistics | SPECULATORS | COMMERCIALS | SMALL TRADERS |
| – Percent of Open Interest Longs: | 29.1 | 57.0 | 12.8 |
| – Percent of Open Interest Shorts: | 31.8 | 58.3 | 8.8 |
| – Net Position: | -18,398 | -8,953 | 27,351 |
| – Gross Longs: | 202,512 | 396,224 | 88,733 |
| – Gross Shorts: | 220,910 | 405,177 | 61,382 |
| – Long to Short Ratio: | 0.9 to 1 | 1.0 to 1 | 1.4 to 1 |
| NET POSITION TREND: | |||
| – COT Index Score (3 Year Range Pct): | 29.4 | 73.2 | 23.3 |
| – COT Index Reading (3 Year Range): | Bearish | Bullish | Bearish |
| NET POSITION MOVEMENT INDEX: | |||
| – 6-Week Change in Strength Index: | -8.9 | 12.2 | -22.7 |
British Pound Sterling Futures:
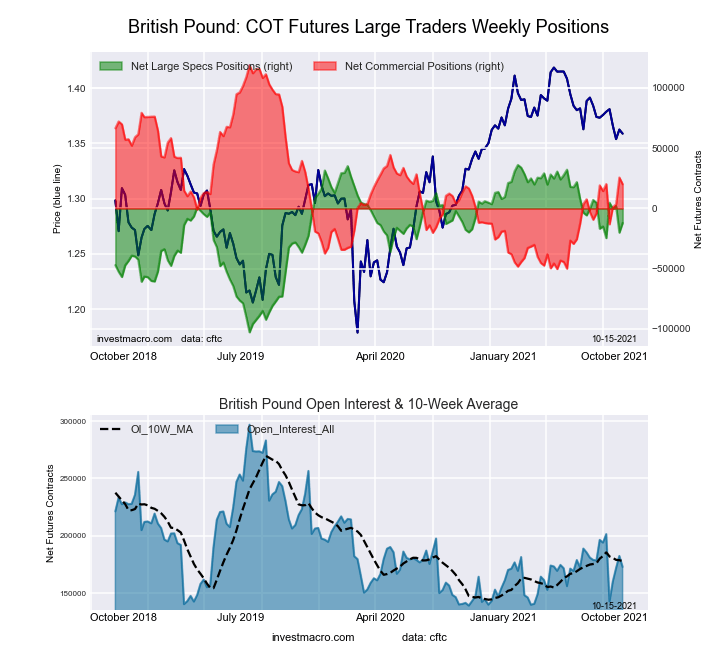 The British Pound Sterling large speculator standing this week resulted in a net position of -11,979 contracts in the data reported through Tuesday. This was a weekly increase of 8,039 contracts from the previous week which had a total of -20,018 net contracts.
This week’s current strength score (the trader positioning range over the past three years, measured from 0 to 100) shows the speculators are currently Bullish with a score of 65.4 percent. The commercials are Bearish with a score of 41.6 percent and the small traders (not shown in chart) are Bearish with a score of 38.6 percent.
| BRITISH POUND Statistics | SPECULATORS | COMMERCIALS | SMALL TRADERS |
| – Percent of Open Interest Longs: | 27.1 | 57.0 | 14.3 |
| – Percent of Open Interest Shorts: | 34.0 | 45.3 | 19.1 |
| – Net Position: | -11,979 | 20,191 | -8,212 |
| – Gross Longs: | 46,794 | 98,512 | 24,778 |
| – Gross Shorts: | 58,773 | 78,321 | 32,990 |
| – Long to Short Ratio: | 0.8 to 1 | 1.3 to 1 | 0.8 to 1 |
| NET POSITION TREND: | |||
| – COT Index Score (3 Year Range Pct): | 65.4 | 41.6 | 38.6 |
| – COT Index Reading (3 Year Range): | Bullish | Bearish | Bearish |
| NET POSITION MOVEMENT INDEX: | |||
| – 6-Week Change in Strength Index: | 2.1 | 3.4 | -18.0 |
Japanese Yen Futures:
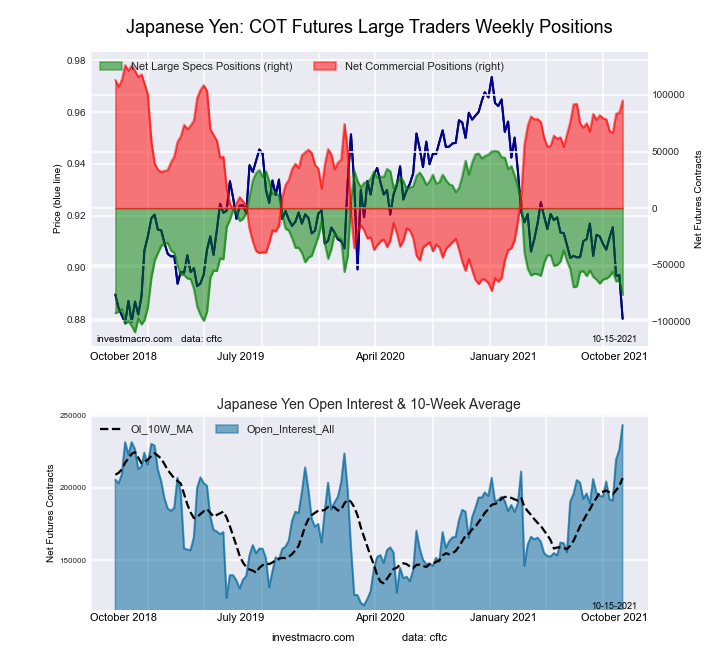 The Japanese Yen large speculator standing this week resulted in a net position of -76,634 contracts in the data reported through Tuesday. This was a weekly reduction of -12,940 contracts from the previous week which had a total of -63,694 net contracts.
This week’s current strength score (the trader positioning range over the past three years, measured from 0 to 100) shows the speculators are currently Bearish with a score of 20.7 percent. The commercials are Bullish-Extreme with a score of 84.3 percent and the small traders (not shown in chart) are Bearish-Extreme with a score of 12.4 percent.
| JAPANESE YEN Statistics | SPECULATORS | COMMERCIALS | SMALL TRADERS |
| – Percent of Open Interest Longs: | 14.7 | 76.2 | 8.5 |
| – Percent of Open Interest Shorts: | 46.2 | 37.1 | 16.1 |
| – Net Position: | -76,634 | 95,092 | -18,458 |
| – Gross Longs: | 35,810 | 185,560 | 20,735 |
| – Gross Shorts: | 112,444 | 90,468 | 39,193 |
| – Long to Short Ratio: | 0.3 to 1 | 2.1 to 1 | 0.5 to 1 |
| NET POSITION TREND: | |||
| – COT Index Score (3 Year Range Pct): | 20.7 | 84.3 | 12.4 |
| – COT Index Reading (3 Year Range): | Bearish | Bullish-Extreme | Bearish-Extreme |
| NET POSITION MOVEMENT INDEX: | |||
| – 6-Week Change in Strength Index: | -8.4 | 7.9 | -4.6 |
Swiss Franc Futures:
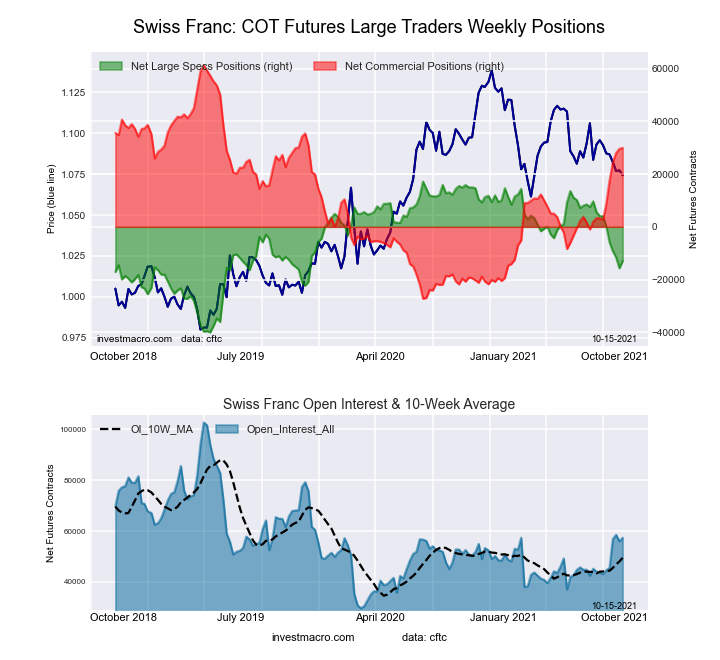 The Swiss Franc large speculator standing this week resulted in a net position of -12,972 contracts in the data reported through Tuesday. This was a weekly boost of 2,707 contracts from the previous week which had a total of -15,679 net contracts.
This week’s current strength score (the trader positioning range over the past three years, measured from 0 to 100) shows the speculators are currently Bearish with a score of 47.3 percent. The commercials are Bullish with a score of 64.6 percent and the small traders (not shown in chart) are Bearish-Extreme with a score of 13.5 percent.
| SWISS FRANC Statistics | SPECULATORS | COMMERCIALS | SMALL TRADERS |
| – Percent of Open Interest Longs: | 6.2 | 79.0 | 14.7 |
| – Percent of Open Interest Shorts: | 28.8 | 26.8 | 44.3 |
| – Net Position: | -12,972 | 29,963 | -16,991 |
| – Gross Longs: | 3,560 | 45,327 | 8,435 |
| – Gross Shorts: | 16,532 | 15,364 | 25,426 |
| – Long to Short Ratio: | 0.2 to 1 | 3.0 to 1 | 0.3 to 1 |
| NET POSITION TREND: | |||
| – COT Index Score (3 Year Range Pct): | 47.3 | 64.6 | 13.5 |
| – COT Index Reading (3 Year Range): | Bearish | Bullish | Bearish-Extreme |
| NET POSITION MOVEMENT INDEX: | |||
| – 6-Week Change in Strength Index: | -29.6 | 30.7 | -30.1 |
Canadian Dollar Futures:
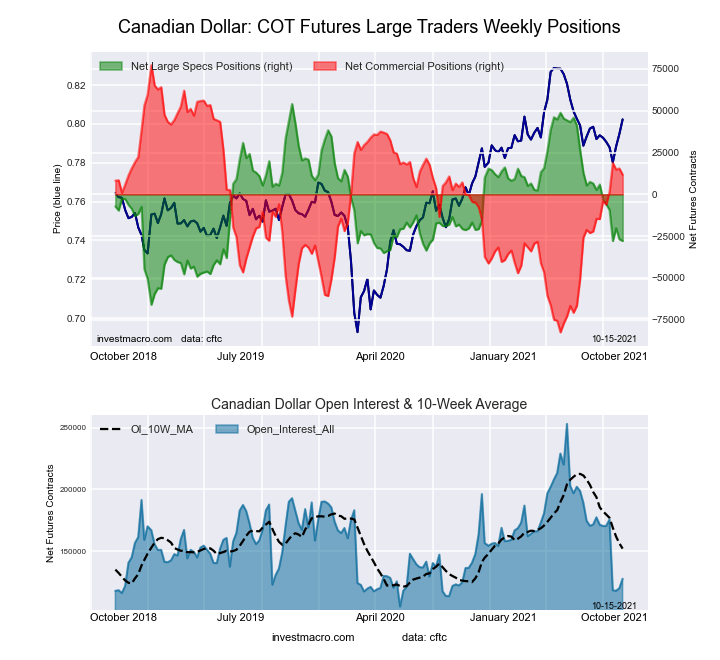 The Canadian Dollar large speculator standing this week resulted in a net position of -27,860 contracts in the data reported through Tuesday. This was a weekly decline of -994 contracts from the previous week which had a total of -26,866 net contracts.
This week’s current strength score (the trader positioning range over the past three years, measured from 0 to 100) shows the speculators are currently Bearish with a score of 31.8 percent. The commercials are Bullish with a score of 59.0 percent and the small traders (not shown in chart) are Bullish with a score of 71.1 percent.
| CANADIAN DOLLAR Statistics | SPECULATORS | COMMERCIALS | SMALL TRADERS |
| – Percent of Open Interest Longs: | 17.5 | 52.3 | 29.1 |
| – Percent of Open Interest Shorts: | 39.3 | 43.1 | 16.5 |
| – Net Position: | -27,860 | 11,728 | 16,132 |
| – Gross Longs: | 22,382 | 66,803 | 37,224 |
| – Gross Shorts: | 50,242 | 55,075 | 21,092 |
| – Long to Short Ratio: | 0.4 to 1 | 1.2 to 1 | 1.8 to 1 |
| NET POSITION TREND: | |||
| – COT Index Score (3 Year Range Pct): | 31.8 | 59.0 | 71.1 |
| – COT Index Reading (3 Year Range): | Bearish | Bullish | Bullish |
| NET POSITION MOVEMENT INDEX: | |||
| – 6-Week Change in Strength Index: | -20.8 | 9.9 | 13.9 |
Australian Dollar Futures:
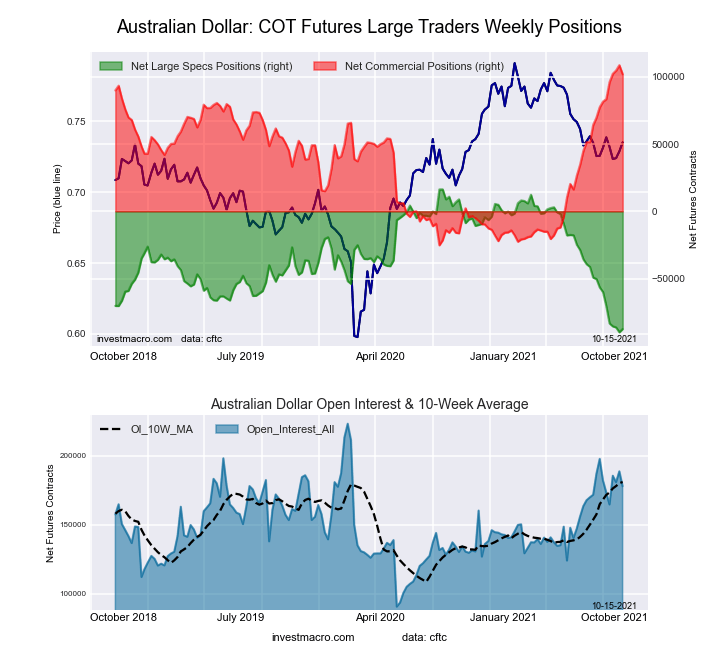 The Australian Dollar large speculator standing this week resulted in a net position of -87,608 contracts in the data reported through Tuesday. This was a weekly gain of 2,371 contracts from the previous week which had a total of -89,979 net contracts.
This week’s current strength score (the trader positioning range over the past three years, measured from 0 to 100) shows the speculators are currently Bearish-Extreme with a score of 2.2 percent. The commercials are Bullish-Extreme with a score of 95.0 percent and the small traders (not shown in chart) are Bearish with a score of 20.2 percent.
| AUSTRALIAN DOLLAR Statistics | SPECULATORS | COMMERCIALS | SMALL TRADERS |
| – Percent of Open Interest Longs: | 6.3 | 82.2 | 9.2 |
| – Percent of Open Interest Shorts: | 55.5 | 24.8 | 17.3 |
| – Net Position: | -87,608 | 102,000 | -14,392 |
| – Gross Longs: | 11,193 | 146,176 | 16,345 |
| – Gross Shorts: | 98,801 | 44,176 | 30,737 |
| – Long to Short Ratio: | 0.1 to 1 | 3.3 to 1 | 0.5 to 1 |
| NET POSITION TREND: | |||
| – COT Index Score (3 Year Range Pct): | 2.2 | 95.0 | 20.2 |
| – COT Index Reading (3 Year Range): | Bearish-Extreme | Bullish-Extreme | Bearish |
| NET POSITION MOVEMENT INDEX: | |||
| – 6-Week Change in Strength Index: | -25.9 | 15.2 | 16.7 |
New Zealand Dollar Futures:
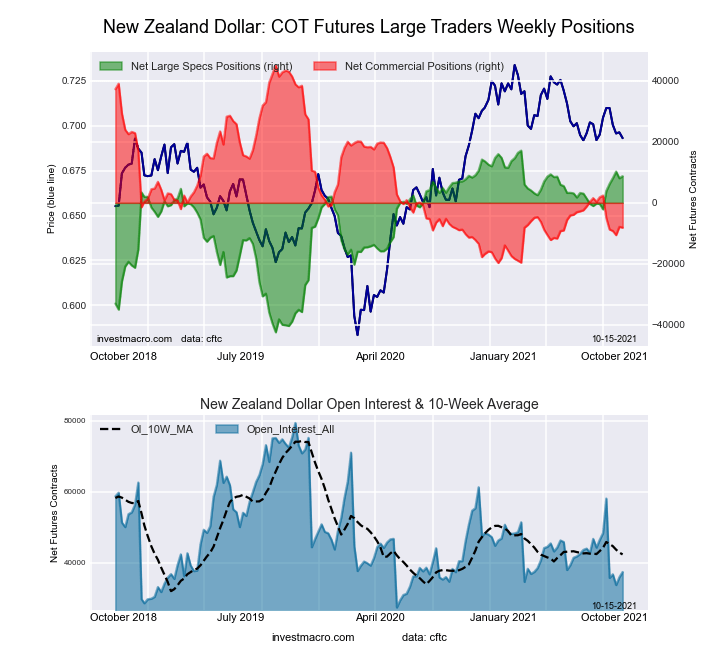 The New Zealand Dollar large speculator standing this week resulted in a net position of 8,748 contracts in the data reported through Tuesday. This was a weekly gain of 692 contracts from the previous week which had a total of 8,056 net contracts.
This week’s current strength score (the trader positioning range over the past three years, measured from 0 to 100) shows the speculators are currently Bullish-Extreme with a score of 85.9 percent. The commercials are Bearish-Extreme with a score of 17.8 percent and the small traders (not shown in chart) are Bearish with a score of 45.0 percent.
| NEW ZEALAND DOLLAR Statistics | SPECULATORS | COMMERCIALS | SMALL TRADERS |
| – Percent of Open Interest Longs: | 54.8 | 33.7 | 9.8 |
| – Percent of Open Interest Shorts: | 31.4 | 55.5 | 11.4 |
| – Net Position: | 8,748 | -8,151 | -597 |
| – Gross Longs: | 20,467 | 12,586 | 3,646 |
| – Gross Shorts: | 11,719 | 20,737 | 4,243 |
| – Long to Short Ratio: | 1.7 to 1 | 0.6 to 1 | 0.9 to 1 |
| NET POSITION TREND: | |||
| – COT Index Score (3 Year Range Pct): | 85.9 | 17.8 | 45.0 |
| – COT Index Reading (3 Year Range): | Bullish-Extreme | Bearish-Extreme | Bearish |
| NET POSITION MOVEMENT INDEX: | |||
| – 6-Week Change in Strength Index: | 18.3 | -16.2 | -4.2 |
Mexican Peso Futures:
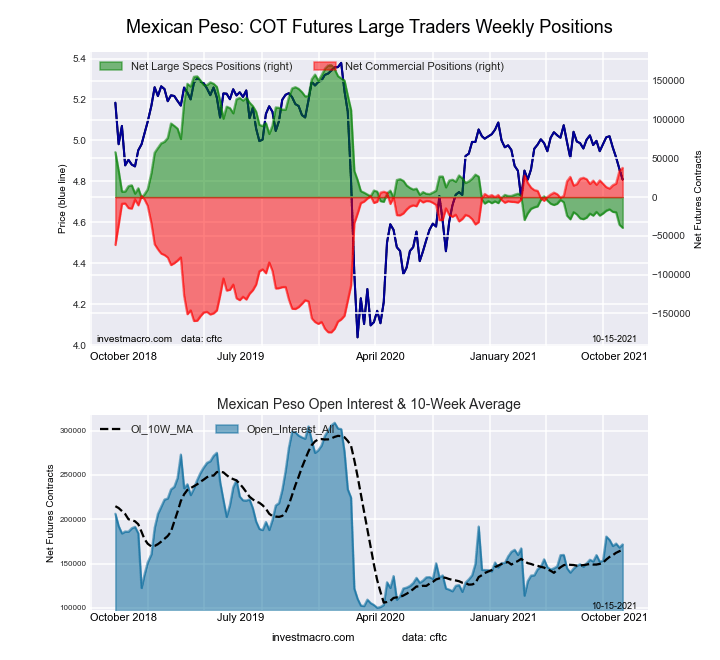 The Mexican Peso large speculator standing this week resulted in a net position of -39,634 contracts in the data reported through Tuesday. This was a weekly decline of -4,055 contracts from the previous week which had a total of -35,579 net contracts.
This week’s current strength score (the trader positioning range over the past three years, measured from 0 to 100) shows the speculators are currently Bearish-Extreme with a score of 0.0 percent. The commercials are Bullish-Extreme with a score of 100.0 percent and the small traders (not shown in chart) are Bullish with a score of 51.0 percent.
| MEXICAN PESO Statistics | SPECULATORS | COMMERCIALS | SMALL TRADERS |
| – Percent of Open Interest Longs: | 43.2 | 52.6 | 3.2 |
| – Percent of Open Interest Shorts: | 66.2 | 30.6 | 2.2 |
| – Net Position: | -39,634 | 37,759 | 1,875 |
| – Gross Longs: | 74,129 | 90,283 | 5,577 |
| – Gross Shorts: | 113,763 | 52,524 | 3,702 |
| – Long to Short Ratio: | 0.7 to 1 | 1.7 to 1 | 1.5 to 1 |
| NET POSITION TREND: | |||
| – COT Index Score (3 Year Range Pct): | 0.0 | 100.0 | 51.0 |
| – COT Index Reading (3 Year Range): | Bearish-Extreme | Bullish-Extreme | Bullish |
| NET POSITION MOVEMENT INDEX: | |||
| – 6-Week Change in Strength Index: | -8.9 | 9.7 | -8.5 |
Brazilian Real Futures:
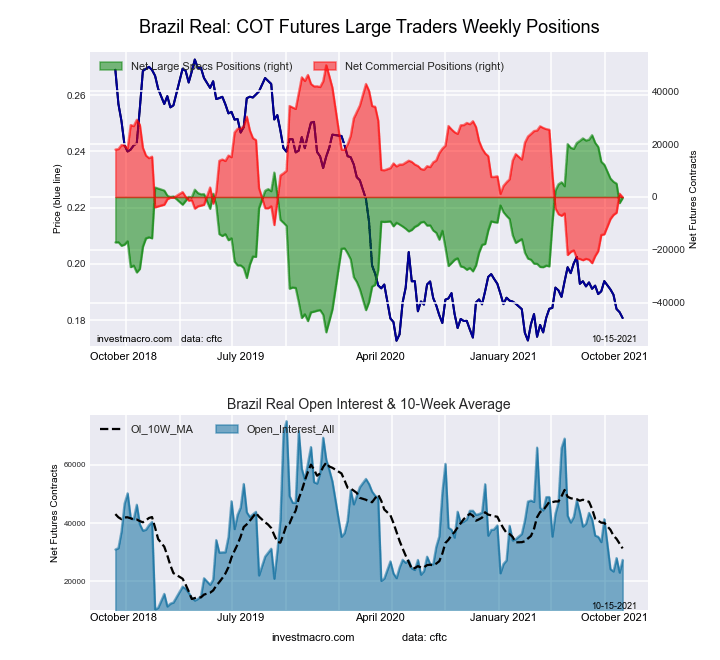 The Brazilian Real large speculator standing this week resulted in a net position of -373 contracts in the market data reported through Tuesday. This was a weekly advance of 1,917 contracts from the previous week which had a total of -2,290 net contracts.
This week’s current strength score (the trader positioning range over the past three years, measured from 0 to 100) shows the speculators are currently Bullish with a score of 68.1 percent. The commercials are Bearish with a score of 33.3 percent and the small traders (not shown in chart) are Bullish with a score of 72.6 percent.
| BRAZIL REAL Statistics | SPECULATORS | COMMERCIALS | SMALL TRADERS |
| – Percent of Open Interest Longs: | 52.9 | 35.1 | 11.5 |
| – Percent of Open Interest Shorts: | 54.2 | 35.5 | 9.8 |
| – Net Position: | -373 | -107 | 480 |
| – Gross Longs: | 14,449 | 9,600 | 3,154 |
| – Gross Shorts: | 14,822 | 9,707 | 2,674 |
| – Long to Short Ratio: | 1.0 to 1 | 1.0 to 1 | 1.2 to 1 |
| NET POSITION TREND: | |||
| – COT Index Score (3 Year Range Pct): | 68.1 | 33.3 | 72.6 |
| – COT Index Reading (3 Year Range): | Bullish | Bearish | Bullish |
| NET POSITION MOVEMENT INDEX: | |||
| – 6-Week Change in Strength Index: | -16.9 | 18.7 | -16.7 |
Russian Ruble Futures:
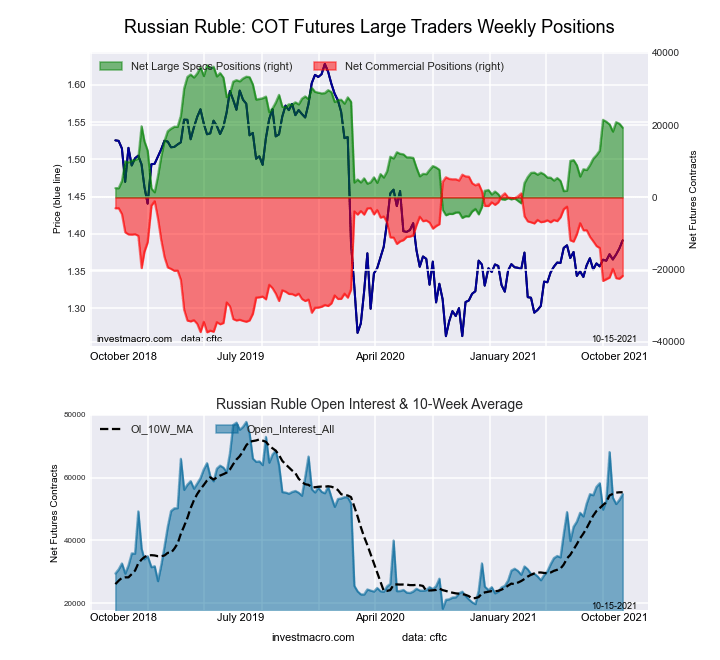 The Russian Ruble large speculator standing this week resulted in a net position of 19,308 contracts in the data reported through Tuesday. This was a weekly fall of -1,101 contracts from the previous week which had a total of 20,409 net contracts.
This week’s current strength score (the trader positioning range over the past three years, measured from 0 to 100) shows the speculators are currently Bullish with a score of 59.1 percent. The commercials are Bearish with a score of 35.8 percent and the small traders (not shown in chart) are Bullish-Extreme with a score of 100.0 percent.
| RUSSIAN RUBLE Statistics | SPECULATORS | COMMERCIALS | SMALL TRADERS |
| – Percent of Open Interest Longs: | 55.1 | 39.0 | 5.8 |
| – Percent of Open Interest Shorts: | 19.9 | 78.7 | 1.4 |
| – Net Position: | 19,308 | -21,718 | 2,410 |
| – Gross Longs: | 30,193 | 21,388 | 3,190 |
| – Gross Shorts: | 10,885 | 43,106 | 780 |
| – Long to Short Ratio: | 2.8 to 1 | 0.5 to 1 | 4.1 to 1 |
| NET POSITION TREND: | |||
| – COT Index Score (3 Year Range Pct): | 59.1 | 35.8 | 100.0 |
| – COT Index Reading (3 Year Range): | Bullish | Bearish | Bullish-Extreme |
| NET POSITION MOVEMENT INDEX: | |||
| – 6-Week Change in Strength Index: | -5.1 | 3.1 | 21.7 |
Bitcoin Futures:
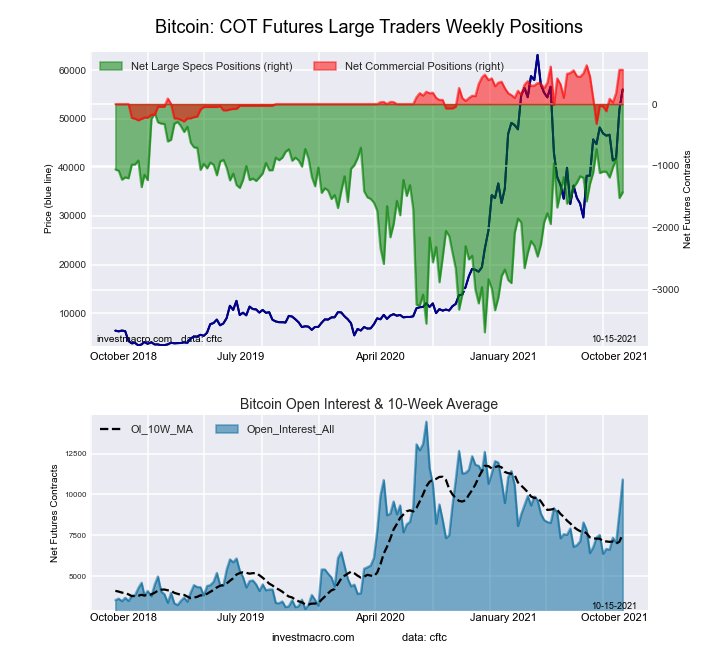 The Bitcoin large speculator standing this week resulted in a net position of -1,426 contracts in the data reported through Tuesday. This was a weekly lift of 92 contracts from the previous week which had a total of -1,518 net contracts.
This week’s current strength score (the trader positioning range over the past three years, measured from 0 to 100) shows the speculators are currently Bullish with a score of 63.8 percent. The commercials are Bullish-Extreme with a score of 92.3 percent and the small traders (not shown in chart) are Bearish-Extreme with a score of 18.3 percent.
| BITCOIN Statistics | SPECULATORS | COMMERCIALS | SMALL TRADERS |
| – Percent of Open Interest Longs: | 62.7 | 6.3 | 16.0 |
| – Percent of Open Interest Shorts: | 75.7 | 1.2 | 8.1 |
| – Net Position: | -1,426 | 555 | 871 |
| – Gross Longs: | 6,844 | 689 | 1,751 |
| – Gross Shorts: | 8,270 | 134 | 880 |
| – Long to Short Ratio: | 0.8 to 1 | 5.1 to 1 | 2.0 to 1 |
| NET POSITION TREND: | |||
| – COT Index Score (3 Year Range Pct): | 63.8 | 92.3 | 18.3 |
| – COT Index Reading (3 Year Range): | Bullish | Bullish-Extreme | Bearish-Extreme |
| NET POSITION MOVEMENT INDEX: | |||
| – 6-Week Change in Strength Index: | -9.4 | 62.4 | -8.5 |
Article By InvestMacro.com – Receive our weekly COT Reports by Email
*COT Report: The COT data, released weekly to the public each Friday, is updated through the most recent Tuesday (data is 3 days old) and shows a quick view of how large speculators or non-commercials (for-profit traders) were positioned in the futures markets.
The CFTC categorizes trader positions according to commercial hedgers (traders who use futures contracts for hedging as part of the business), non-commercials (large traders who speculate to realize trading profits) and nonreportable traders (usually small traders/speculators).
Find CFTC criteria here: (http://www.cftc.gov/MarketReports/CommitmentsofTraders/ExplanatoryNotes/index.htm).

- COT Metals Charts: Weekly Speculator Bets led by Copper & Steel Jul 18, 2026
- COT Bonds Charts: Weekly Speculator Bets led by 2-Year, SOFR 3M & 5-Year Bonds Jul 18, 2026
- COT Energy Charts: Weekly Speculator Bets led by Brent Oil & Heating Oil Jul 18, 2026
- COT Soft Commodities Charts: Weekly Speculator Bets led by Wheat, Corn & Soybean Meal Jul 18, 2026
- The Bank of Canada kept its interest rate unchanged. Platinum prices reached a three‑week high Jul 16, 2026
- Stock indices rose after the release of US inflation data. China’s GDP slowed sharply Jul 15, 2026
- GBP/USD Awaits Political News: What Will Happen Next Jul 15, 2026
- USD/JPY Holds at Highs: Pressure Lingers on Yen Jul 14, 2026
- Oil prices jumped 4% amid a new wave of escalation between the US and Iran Jul 13, 2026
- EUR/USD: US Inflation Will Determine Everything Jul 13, 2026