Archive for CountingPips Forex Blog – Page 22

COT Speculators boost Corn bullish bets to best level of past 22-weeks

By InvestMacro | COT | Data Tables | COT Leaders | Downloads | COT Newsletter

Here are the latest charts and statistics for the Commitment of Traders (COT) data published by the Commodities Futures Trading Commission (CFTC).

The latest COT data is updated through Tuesday November 16th 2021 and shows a quick view of how large traders (for-profit speculators and commercial entities) were positioned in the futures markets.

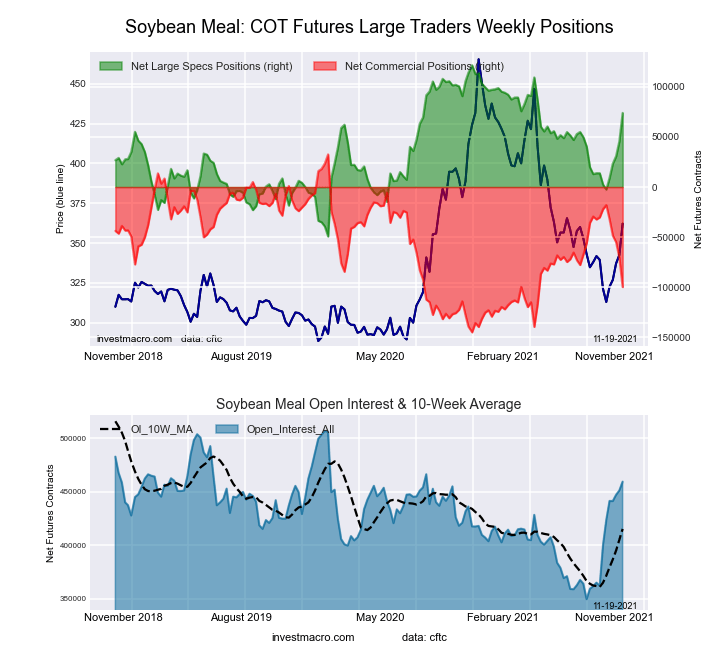
Highlighting the COT Soft Commodities data this week is the gains almost across the board in these markets. This week’s positive data changes in nominal speculator contracts saw soft commodities take five out of the top seven places of all the markets we track. Soybean Meal speculators added 28,354 contracts to their standings this week while Corn specs added 23,888 contracts, Soybeans bets rose by 19,333 contracts, Wheat wagers increased by 17,558 contracts and Sugar tacked on 15,358 contracts to its overall net position.

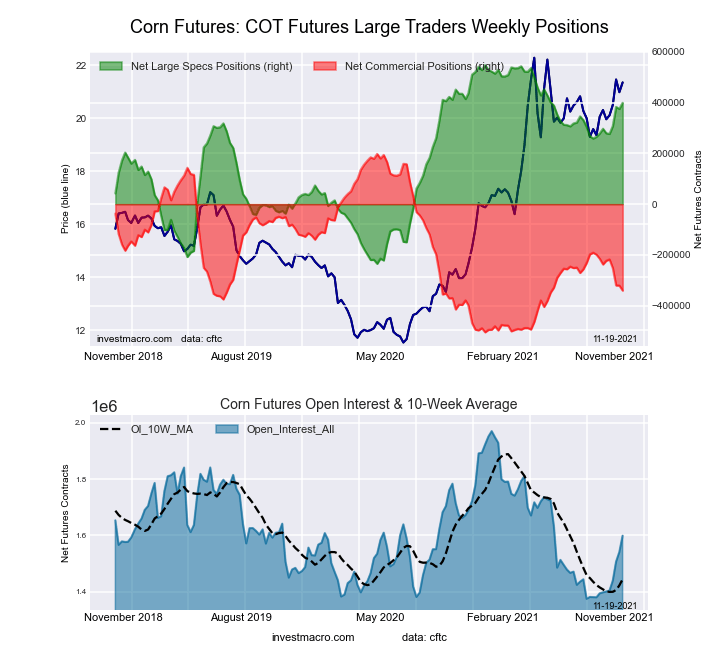
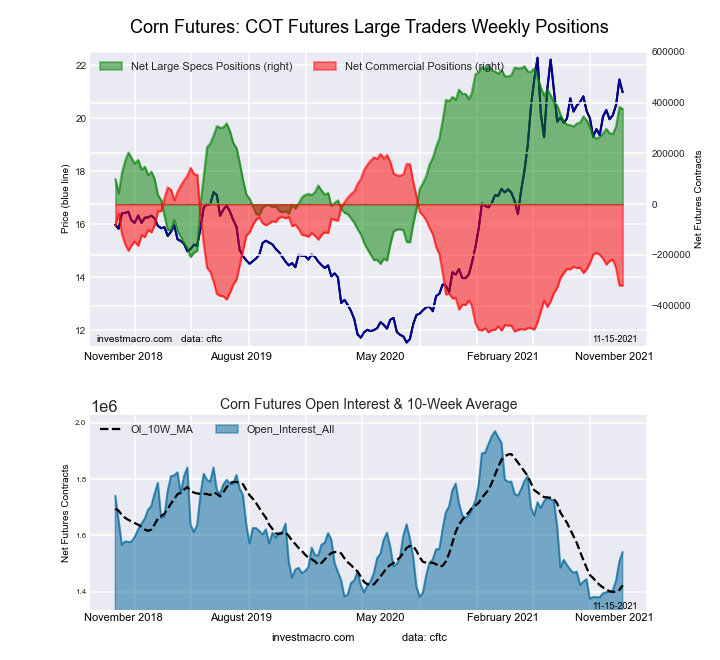
Corn positions, in particular, are seeing rising bullish sentiment and have jumped by a total of 122,157 contracts over just the past four weeks. The Corn speculative net positions is now at its highest level of the past twenty-two weeks, dating back to June 15th.


Data Snapshot of Commodity Market Traders | Columns Legend
Nov-16-2021OIOI-IndexSpec-NetSpec-IndexCom-NetCOM-IndexSmalls-NetSmalls-Index
WTI Crude2,057,63318415,78544-470,3244154,53992
Gold612,61254259,78073-287,5392727,75948
Silver152,4041845,62568-66,1483420,52361
Copper208,0663220,33757-30,8053810,46886
Palladium11,84024-2,03871,976916248
Platinum62,2842621,01333-28,225697,21263
Natural Gas1,308,70845-144,6203598,4156246,20596
Brent199,93039-12,900987,41205,48894
Heating Oil380,8872617,02967-37,0103219,98168
Soybeans662,9721346,91742-4,92765-41,9902
Corn1,598,92638399,18681-340,67223-58,5149
Coffee286,3434866,08197-70,07553,99416
Sugar906,38521227,38983-276,1851648,79668
Wheat427,7864936,76178-27,99914-8,76260


CORN Futures:

Federal Funds 30-Day Bonds Futures COT ChartThe CORN large speculator standing this week reached a net position of 399,186 contracts in the data reported through Tuesday. This was a weekly increase of 23,888 contracts from the previous week which had a total of 375,298 net contracts.

This week’s current strength score (the trader positioning range over the past three years, measured from 0 to 100) shows the speculators are currently Bullish-Extreme with a score of 81.0 percent. The commercials are Bearish with a score of 23.4 percent and the small traders (not shown in chart) are Bearish-Extreme with a score of 9.4 percent.

CORN Futures StatisticsSPECULATORSCOMMERCIALSSMALL TRADERS
– Percent of Open Interest Longs:31.645.38.5
– Percent of Open Interest Shorts:6.666.612.1
– Net Position:399,186-340,672-58,514
– Gross Longs:504,851724,785135,589
– Gross Shorts:105,6651,065,457194,103
– Long to Short Ratio:4.8 to 10.7 to 10.7 to 1
NET POSITION TREND:
– COT Index Score (3 Year Range Pct):81.023.49.4
– COT Index Reading (3 Year Range):Bullish-ExtremeBearishBearish-Extreme
NET POSITION MOVEMENT INDEX:
– 6-Week Change in Strength Index:13.1-14.70.5


SUGAR Futures:

2-Year Treasury Bonds Futures COT ChartThe SUGAR large speculator standing this week reached a net position of 227,389 contracts in the data reported through Tuesday. This was a weekly lift of 15,358 contracts from the previous week which had a total of 212,031 net contracts.

This week’s current strength score (the trader positioning range over the past three years, measured from 0 to 100) shows the speculators are currently Bullish-Extreme with a score of 83.3 percent. The commercials are Bearish-Extreme with a score of 15.8 percent and the small traders (not shown in chart) are Bullish with a score of 68.2 percent.

SUGAR Futures StatisticsSPECULATORSCOMMERCIALSSMALL TRADERS
– Percent of Open Interest Longs:30.842.810.7
– Percent of Open Interest Shorts:5.773.35.3
– Net Position:227,389-276,18548,796
– Gross Longs:278,893388,33496,952
– Gross Shorts:51,504664,51948,156
– Long to Short Ratio:5.4 to 10.6 to 12.0 to 1
NET POSITION TREND:
– COT Index Score (3 Year Range Pct):83.315.868.2
– COT Index Reading (3 Year Range):Bullish-ExtremeBearish-ExtremeBullish
NET POSITION MOVEMENT INDEX:
– 6-Week Change in Strength Index:-4.13.23.8


COFFEE Futures:

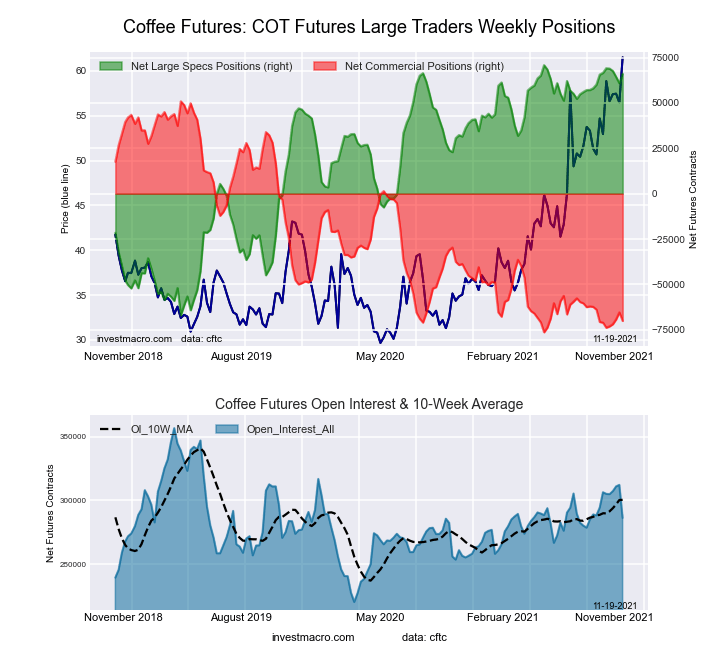
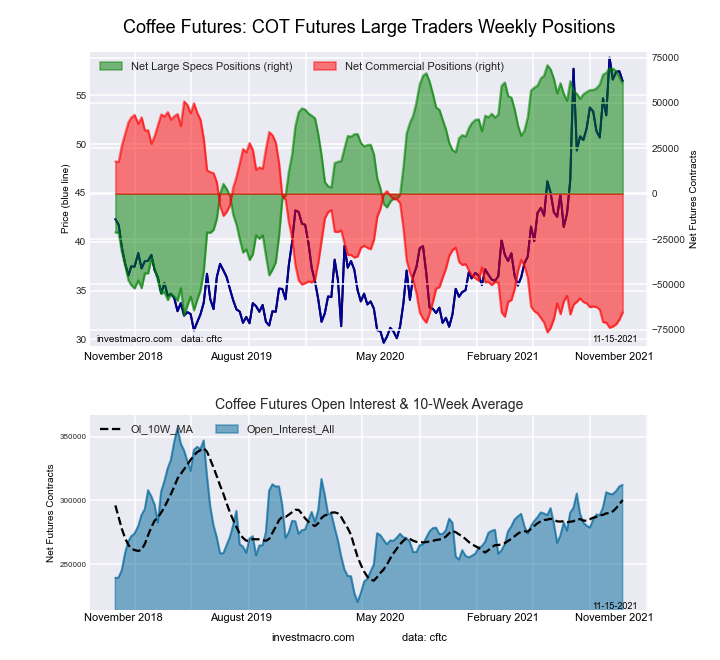
5-Year Treasury Bonds Futures COT ChartThe COFFEE large speculator standing this week reached a net position of 66,081 contracts in the data reported through Tuesday. This was a weekly increase of 5,261 contracts from the previous week which had a total of 60,820 net contracts.

This week’s current strength score (the trader positioning range over the past three years, measured from 0 to 100) shows the speculators are currently Bullish-Extreme with a score of 96.6 percent. The commercials are Bearish-Extreme with a score of 4.9 percent and the small traders (not shown in chart) are Bearish-Extreme with a score of 16.0 percent.

COFFEE Futures StatisticsSPECULATORSCOMMERCIALSSMALL TRADERS
– Percent of Open Interest Longs:27.842.83.9
– Percent of Open Interest Shorts:4.767.32.6
– Net Position:66,081-70,0753,994
– Gross Longs:79,550122,59411,308
– Gross Shorts:13,469192,6697,314
– Long to Short Ratio:5.9 to 10.6 to 11.5 to 1
NET POSITION TREND:
– COT Index Score (3 Year Range Pct):96.64.916.0
– COT Index Reading (3 Year Range):Bullish-ExtremeBearish-ExtremeBearish-Extreme
NET POSITION MOVEMENT INDEX:
– 6-Week Change in Strength Index:-0.40.7-3.2


SOYBEANS Futures:

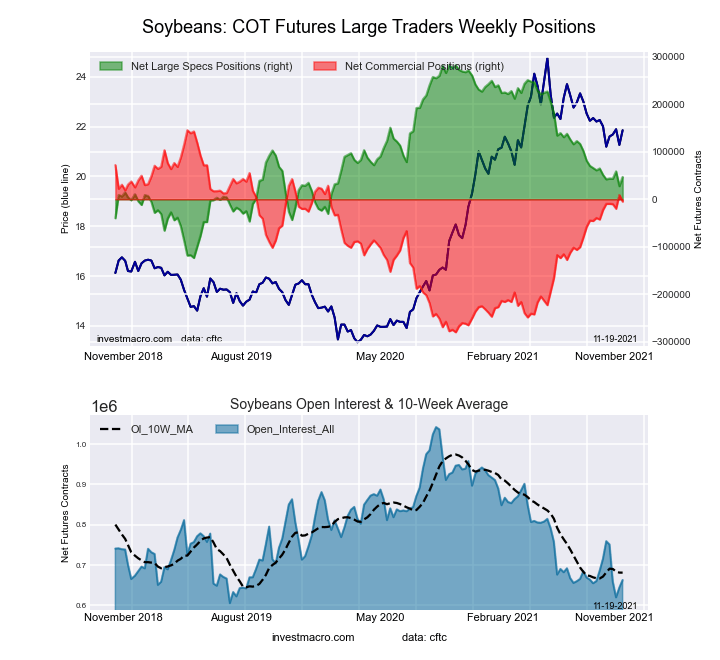
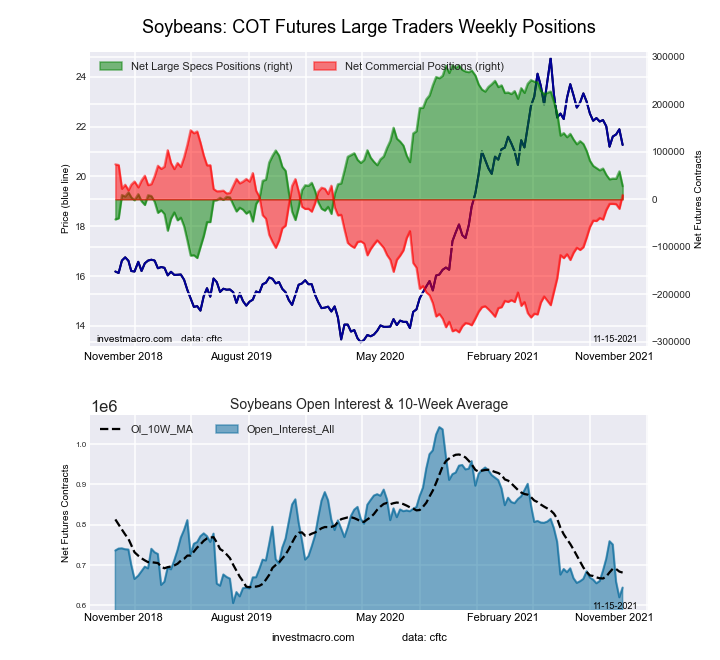
10-Year Treasury Notes Bonds Futures COT ChartThe SOYBEANS large speculator standing this week reached a net position of 46,917 contracts in the data reported through Tuesday. This was a weekly boost of 19,333 contracts from the previous week which had a total of 27,584 net contracts.

This week’s current strength score (the trader positioning range over the past three years, measured from 0 to 100) shows the speculators are currently Bearish with a score of 42.0 percent. The commercials are Bullish with a score of 64.7 percent and the small traders (not shown in chart) are Bearish-Extreme with a score of 2.0 percent.

SOYBEANS Futures StatisticsSPECULATORSCOMMERCIALSSMALL TRADERS
– Percent of Open Interest Longs:20.059.06.9
– Percent of Open Interest Shorts:12.959.813.3
– Net Position:46,917-4,927-41,990
– Gross Longs:132,364391,21745,975
– Gross Shorts:85,447396,14487,965
– Long to Short Ratio:1.5 to 11.0 to 10.5 to 1
NET POSITION TREND:
– COT Index Score (3 Year Range Pct):42.064.72.0
– COT Index Reading (3 Year Range):BearishBullishBearish-Extreme
NET POSITION MOVEMENT INDEX:
– 6-Week Change in Strength Index:-1.14.2-21.9


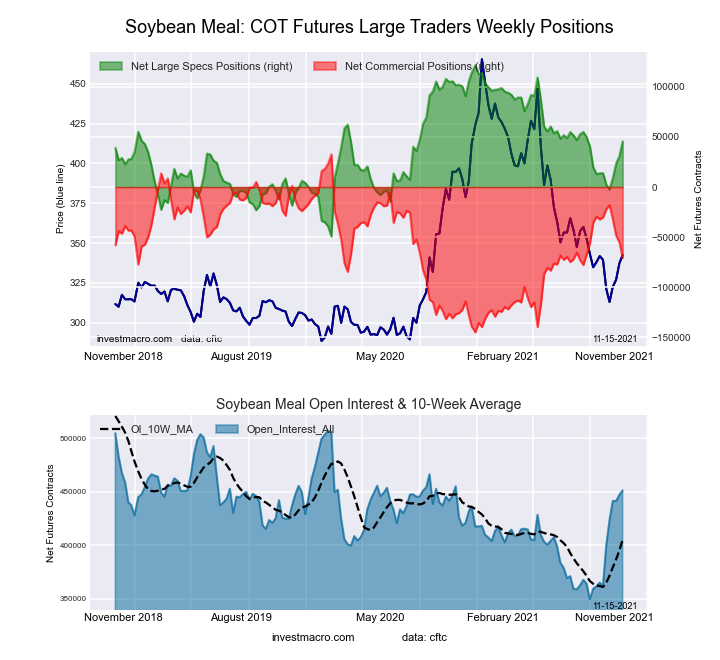
SOYBEAN MEAL Futures:

US Year Treasury Notes Long Bonds Futures COT ChartThe SOYBEAN MEAL large speculator standing this week reached a net position of 73,989 contracts in the data reported through Tuesday. This was a weekly boost of 28,354 contracts from the previous week which had a total of 45,635 net contracts.

This week’s current strength score (the trader positioning range over the past three years, measured from 0 to 100) shows the speculators are currently Bullish with a score of 72.1 percent. The commercials are Bearish with a score of 25.4 percent and the small traders (not shown in chart) are Bullish with a score of 74.3 percent.

SOYBEAN MEAL Futures StatisticsSPECULATORSCOMMERCIALSSMALL TRADERS
– Percent of Open Interest Longs:22.644.211.9
– Percent of Open Interest Shorts:6.566.06.3
– Net Position:73,989-99,86625,877
– Gross Longs:103,903203,23954,734
– Gross Shorts:29,914303,10528,857
– Long to Short Ratio:3.5 to 10.7 to 11.9 to 1
NET POSITION TREND:
– COT Index Score (3 Year Range Pct):72.125.474.3
– COT Index Reading (3 Year Range):BullishBearishBullish
NET POSITION MOVEMENT INDEX:
– 6-Week Change in Strength Index:41.8-43.824.8


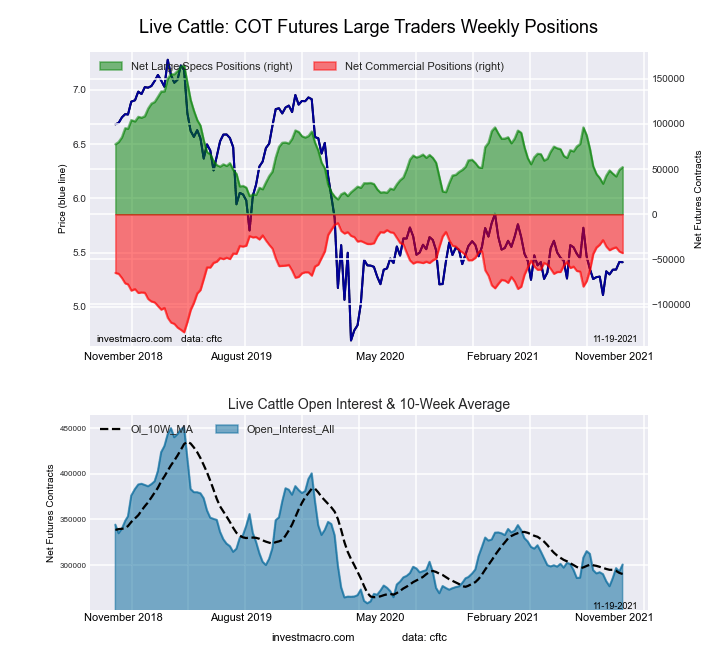
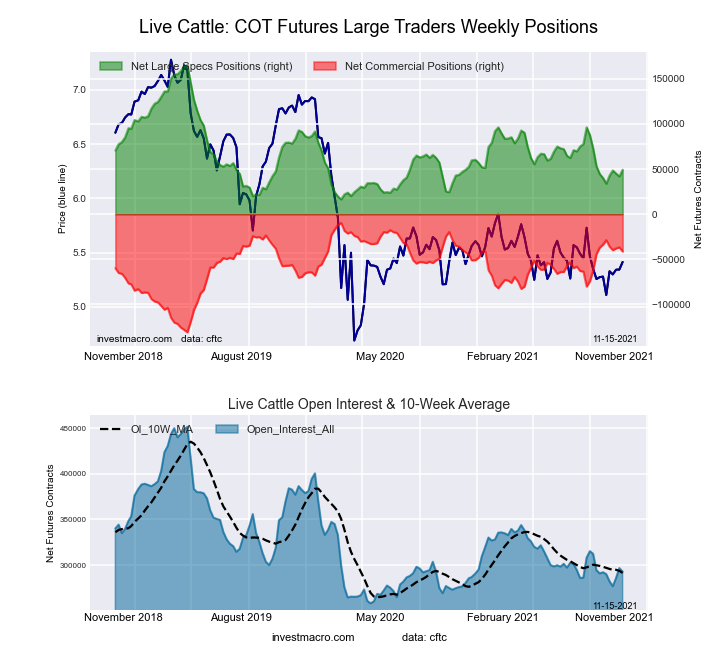
LIVE CATTLE Futures:

Ultra US Year Treasury Notes Long Bonds Futures COT ChartThe LIVE CATTLE large speculator standing this week reached a net position of 52,226 contracts in the data reported through Tuesday. This was a weekly lift of 3,023 contracts from the previous week which had a total of 49,203 net contracts.

This week’s current strength score (the trader positioning range over the past three years, measured from 0 to 100) shows the speculators are currently Bearish with a score of 24.1 percent. The commercials are Bullish with a score of 72.5 percent and the small traders (not shown in chart) are Bullish with a score of 64.7 percent.

LIVE CATTLE Futures StatisticsSPECULATORSCOMMERCIALSSMALL TRADERS
– Percent of Open Interest Longs:34.139.49.9
– Percent of Open Interest Shorts:16.753.713.0
– Net Position:52,226-43,034-9,192
– Gross Longs:102,550118,41029,742
– Gross Shorts:50,324161,44438,934
– Long to Short Ratio:2.0 to 10.7 to 10.8 to 1
NET POSITION TREND:
– COT Index Score (3 Year Range Pct):24.172.564.7
– COT Index Reading (3 Year Range):BearishBullishBullish
NET POSITION MOVEMENT INDEX:
– 6-Week Change in Strength Index:12.4-11.8-9.9


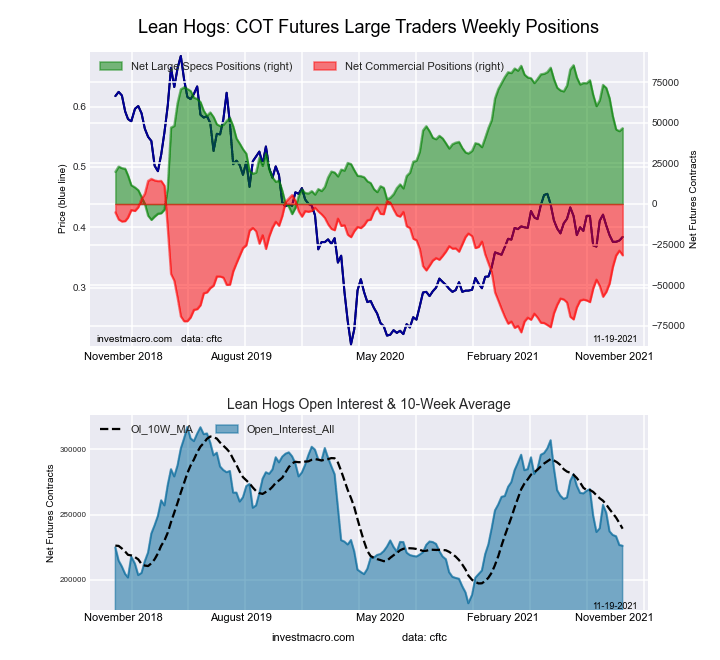
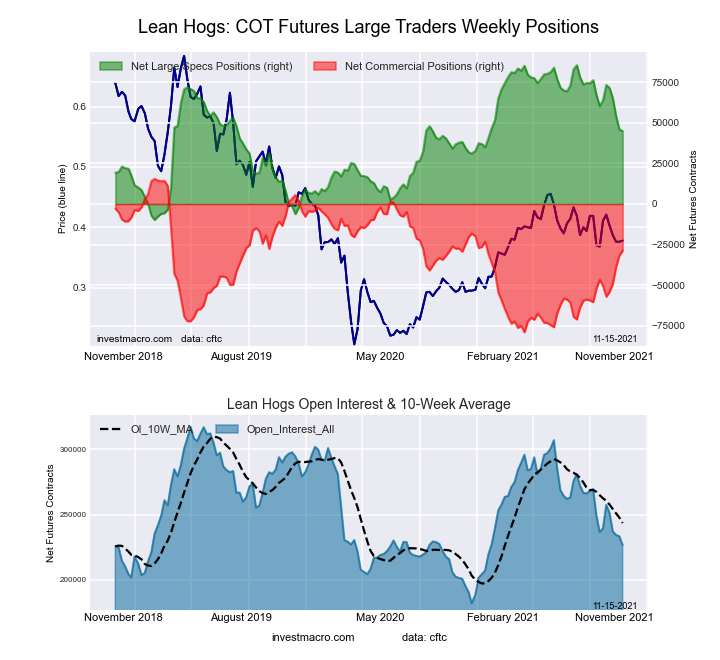
LEAN HOGS Futures:

Eurodollar Bonds Futures COT ChartThe LEAN HOGS large speculator standing this week reached a net position of 46,764 contracts in the data reported through Tuesday. This was a weekly lift of 1,827 contracts from the previous week which had a total of 44,937 net contracts.

This week’s current strength score (the trader positioning range over the past three years, measured from 0 to 100) shows the speculators are currently Bullish with a score of 59.3 percent. The commercials are Bullish with a score of 50.2 percent and the small traders (not shown in chart) are Bearish-Extreme with a score of 10.2 percent.

LEAN HOGS Futures StatisticsSPECULATORSCOMMERCIALSSMALL TRADERS
– Percent of Open Interest Longs:39.134.97.8
– Percent of Open Interest Shorts:18.448.814.4
– Net Position:46,764-31,629-15,135
– Gross Longs:88,45578,85517,531
– Gross Shorts:41,691110,48432,666
– Long to Short Ratio:2.1 to 10.7 to 10.5 to 1
NET POSITION TREND:
– COT Index Score (3 Year Range Pct):59.350.210.2
– COT Index Reading (3 Year Range):BullishBullishBearish-Extreme
NET POSITION MOVEMENT INDEX:
– 6-Week Change in Strength Index:-28.027.05.2


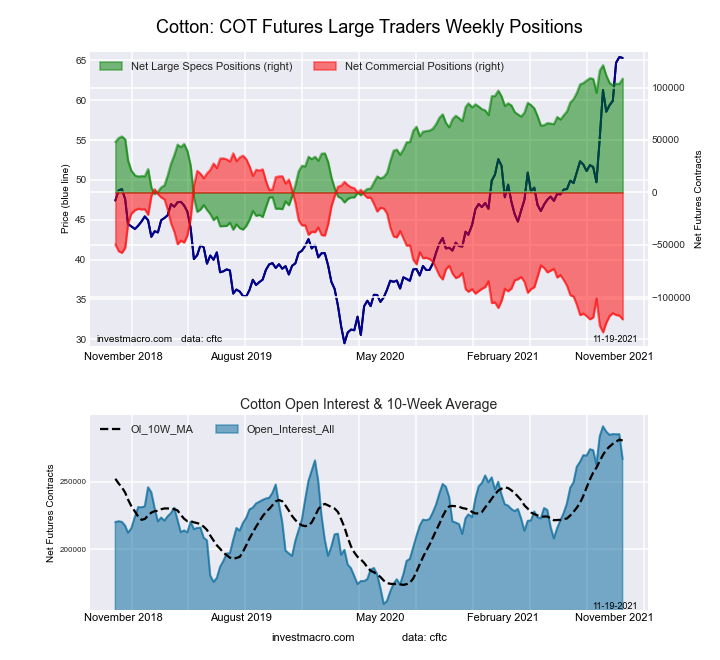
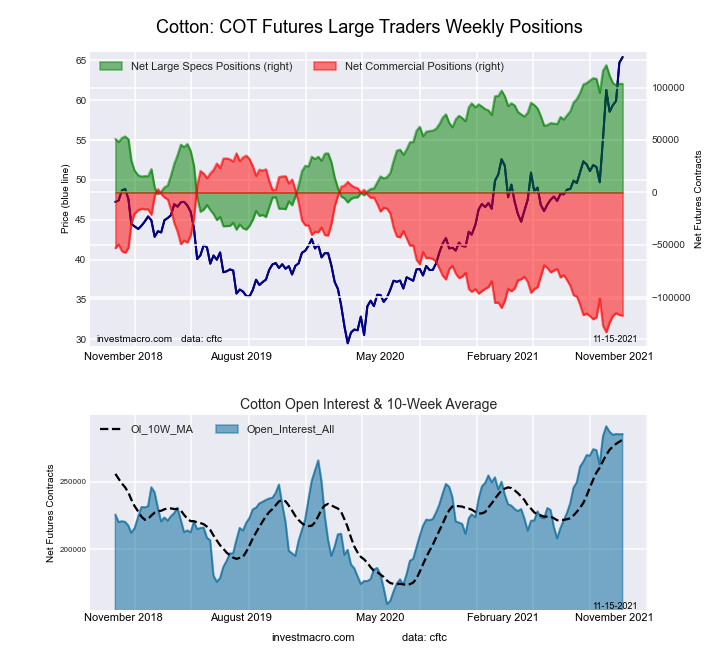
COTTON Futures:

Ultra 10-Year Treasury Notes Bonds Futures COT ChartThe COTTON large speculator standing this week reached a net position of 108,441 contracts in the data reported through Tuesday. This was a weekly boost of 4,928 contracts from the previous week which had a total of 103,513 net contracts.

This week’s current strength score (the trader positioning range over the past three years, measured from 0 to 100) shows the speculators are currently Bullish-Extreme with a score of 91.8 percent. The commercials are Bearish-Extreme with a score of 7.2 percent and the small traders (not shown in chart) are Bullish-Extreme with a score of 91.6 percent.

COTTON Futures StatisticsSPECULATORSCOMMERCIALSSMALL TRADERS
– Percent of Open Interest Longs:44.835.38.1
– Percent of Open Interest Shorts:4.180.63.4
– Net Position:108,441-120,94512,504
– Gross Longs:119,40394,05521,485
– Gross Shorts:10,962215,0008,981
– Long to Short Ratio:10.9 to 10.4 to 12.4 to 1
NET POSITION TREND:
– COT Index Score (3 Year Range Pct):91.87.291.6
– COT Index Reading (3 Year Range):Bullish-ExtremeBearish-ExtremeBullish-Extreme
NET POSITION MOVEMENT INDEX:
– 6-Week Change in Strength Index:-8.27.23.2


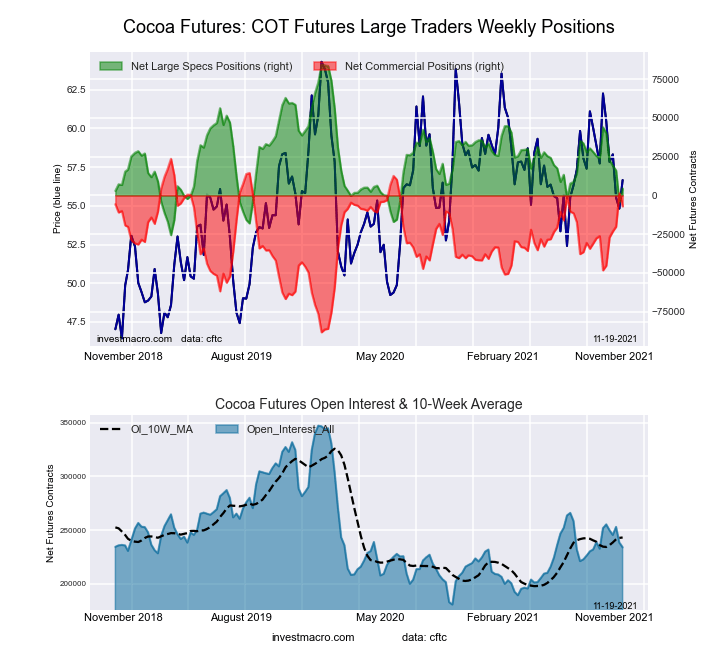
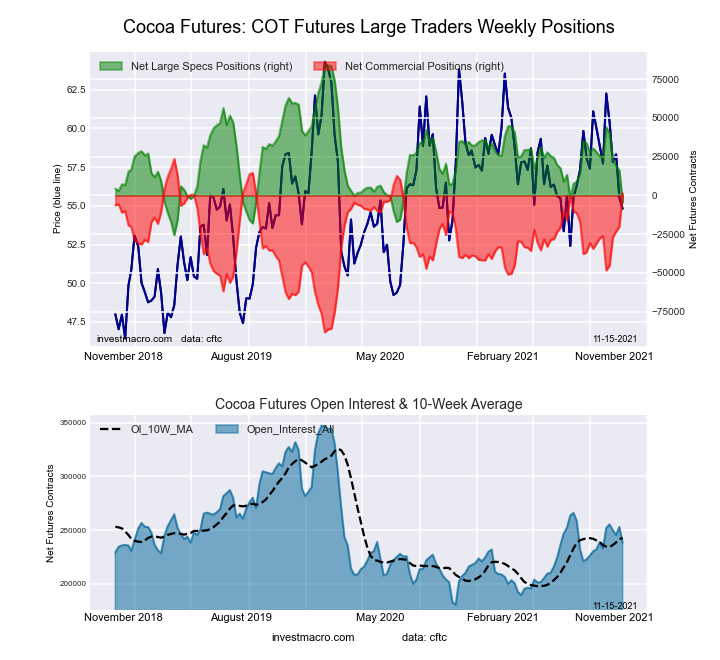
COCOA Futures:

US Year Treasury Notes Long Bonds Futures COT ChartThe COCOA large speculator standing this week reached a net position of 4,521 contracts in the data reported through Tuesday. This was a weekly rise of 9,142 contracts from the previous week which had a total of -4,621 net contracts.

This week’s current strength score (the trader positioning range over the past three years, measured from 0 to 100) shows the speculators are currently Bearish with a score of 27.4 percent. The commercials are Bullish with a score of 72.6 percent and the small traders (not shown in chart) are Bearish with a score of 37.3 percent.

COCOA Futures StatisticsSPECULATORSCOMMERCIALSSMALL TRADERS
– Percent of Open Interest Longs:26.953.34.7
– Percent of Open Interest Shorts:25.056.33.6
– Net Position:4,521-7,0532,532
– Gross Longs:63,037124,69910,926
– Gross Shorts:58,516131,7528,394
– Long to Short Ratio:1.1 to 10.9 to 11.3 to 1
NET POSITION TREND:
– COT Index Score (3 Year Range Pct):27.472.637.3
– COT Index Reading (3 Year Range):BearishBullishBearish
NET POSITION MOVEMENT INDEX:
– 6-Week Change in Strength Index:-36.036.9-20.2


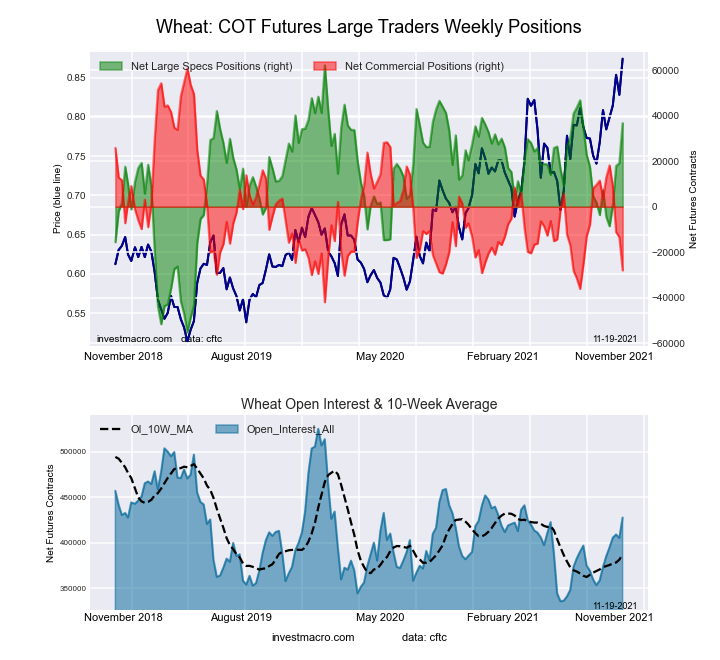
WHEAT Futures:

Ultra US Year Treasury Notes Long Bonds Futures COT ChartThe WHEAT large speculator standing this week reached a net position of 36,761 contracts in the data reported through Tuesday. This was a weekly advance of 17,558 contracts from the previous week which had a total of 19,203 net contracts.

This week’s current strength score (the trader positioning range over the past three years, measured from 0 to 100) shows the speculators are currently Bullish with a score of 78.3 percent. The commercials are Bearish-Extreme with a score of 13.6 percent and the small traders (not shown in chart) are Bullish with a score of 59.7 percent.

WHEAT Futures StatisticsSPECULATORSCOMMERCIALSSMALL TRADERS
– Percent of Open Interest Longs:30.935.18.0
– Percent of Open Interest Shorts:22.341.610.1
– Net Position:36,761-27,999-8,762
– Gross Longs:132,167150,05534,249
– Gross Shorts:95,406178,05443,011
– Long to Short Ratio:1.4 to 10.8 to 10.8 to 1
NET POSITION TREND:
– COT Index Score (3 Year Range Pct):78.313.659.7
– COT Index Reading (3 Year Range):BullishBearish-ExtremeBullish
NET POSITION MOVEMENT INDEX:
– 6-Week Change in Strength Index:25.1-30.910.7


Article By InvestMacroReceive our weekly COT Reports by Email

*COT Report: The COT data, released weekly to the public each Friday, is updated through the most recent Tuesday (data is 3 days old) and shows a quick view of how large speculators or non-commercials (for-profit traders) were positioned in the futures markets.

The CFTC categorizes trader positions according to commercial hedgers (traders who use futures contracts for hedging as part of the business), non-commercials (large traders who speculate to realize trading profits) and nonreportable traders (usually small traders/speculators) as well as their open interest (contracts open in the market at time of reporting).See CFTC criteria here.

Speculators boost RBOB Gasoline bullish bets to 20-week high

By InvestMacro | COT | Data Tables | COT Leaders | Downloads | COT Newsletter

Here are the latest charts and statistics for the Commitment of Traders (COT) data published by the Commodities Futures Trading Commission (CFTC).

The latest COT data is updated through Tuesday November 16th 2021 and shows a quick view of how large traders (for-profit speculators and commercial entities) were positioned in the futures markets.

Highlighting the COT Energy data this week is the gains in RBOB Gasoline speculative positions. Gasoline speculator bets jumped this week by the largest one-week gain (+9,145 contracts) of the past fifty-three weeks and rose for the sixth time in ten weeks. These gains have pushed the current speculative net standing (+54,214 contracts) to its highest level of the past twenty weeks, dating back to June 29th. RBOB Gasoline futures prices, like many energy markets, have been on a strong uptrend since bottoming in early 2020 and recently hit the highest level since 2014 in October.


Data Snapshot of Commodity Market Traders | Columns Legend
Nov-16-2021OIOI-IndexSpec-NetSpec-IndexCom-NetCOM-IndexSmalls-NetSmalls-Index
WTI Crude2,057,63318415,78544-470,3244154,53992
Gold612,61254259,78073-287,5392727,75948
Silver152,4041845,62568-66,1483420,52361
Copper208,0663220,33757-30,8053810,46886
Palladium11,84024-2,03871,976916248
Platinum62,2842621,01333-28,225697,21263
Natural Gas1,308,70845-144,6203598,4156246,20596
Brent199,93039-12,900987,41205,48894
Heating Oil380,8872617,02967-37,0103219,98168
Soybeans662,9721346,91742-4,92765-41,9902
Corn1,598,92638399,18681-340,67223-58,5149
Coffee286,3434866,08197-70,07553,99416
Sugar906,38521227,38983-276,1851648,79668
Wheat427,7864936,76178-27,99914-8,76260


WTI Crude Oil Futures:

WTI Crude Oil Futures COT ChartThe WTI Crude Oil Futures large speculator standing this week resulted in a net position of 415,785 contracts in the data reported through Tuesday. This was a weekly decrease of -5,527 contracts from the previous week which had a total of 421,312 net contracts.

This week’s current strength score (the trader positioning range over the past three years, measured from 0 to 100) shows the speculators are currently Bearish with a score of 44.4 percent. The commercials are Bearish with a score of 41.5 percent and the small traders (not shown in chart) are Bullish-Extreme with a score of 91.9 percent.

WTI Crude Oil Futures StatisticsSPECULATORSCOMMERCIALSSMALL TRADERS
– Percent of Open Interest Longs:24.834.65.0
– Percent of Open Interest Shorts:4.657.42.4
– Net Position:415,785-470,32454,539
– Gross Longs:510,169711,066103,722
– Gross Shorts:94,3841,181,39049,183
– Long to Short Ratio:5.4 to 10.6 to 12.1 to 1
NET POSITION TREND:
– COT Index Score (3 Year Range Pct):44.441.591.9
– COT Index Reading (3 Year Range):BearishBearishBullish-Extreme
NET POSITION MOVEMENT INDEX:
– 6-Week Change in Strength Index:5.6-8.113.5


Brent Crude Oil Futures:

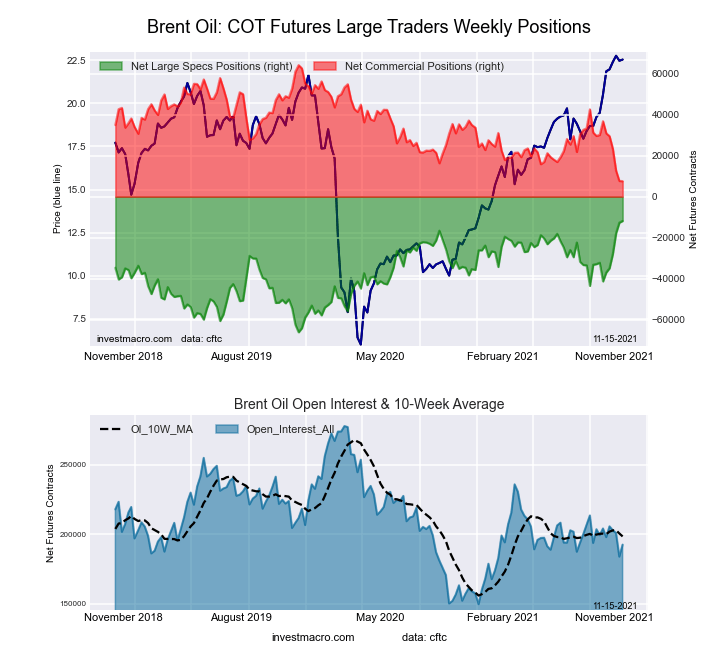
Brent Last Day Crude Oil Futures COT ChartThe Brent Crude Oil Futures large speculator standing this week resulted in a net position of -12,900 contracts in the data reported through Tuesday. This was a weekly reduction of -1,049 contracts from the previous week which had a total of -11,851 net contracts.

This week’s current strength score (the trader positioning range over the past three years, measured from 0 to 100) shows the speculators are currently Bullish-Extreme with a score of 98.1 percent. The commercials are Bearish-Extreme with a score of 0.0 percent and the small traders (not shown in chart) are Bullish-Extreme with a score of 94.1 percent.

Brent Crude Oil Futures StatisticsSPECULATORSCOMMERCIALSSMALL TRADERS
– Percent of Open Interest Longs:22.640.84.4
– Percent of Open Interest Shorts:29.137.11.7
– Net Position:-12,9007,4125,488
– Gross Longs:45,20181,6088,790
– Gross Shorts:58,10174,1963,302
– Long to Short Ratio:0.8 to 11.1 to 12.7 to 1
NET POSITION TREND:
– COT Index Score (3 Year Range Pct):98.10.094.1
– COT Index Reading (3 Year Range):Bullish-ExtremeBearish-ExtremeBullish-Extreme
NET POSITION MOVEMENT INDEX:
– 6-Week Change in Strength Index:44.4-41.4-5.9


Natural Gas Futures:

Natural Gas Futures COT ChartThe Natural Gas Futures large speculator standing this week resulted in a net position of -144,620 contracts in the data reported through Tuesday. This was a weekly fall of -2,429 contracts from the previous week which had a total of -142,191 net contracts.

This week’s current strength score (the trader positioning range over the past three years, measured from 0 to 100) shows the speculators are currently Bearish with a score of 35.2 percent. The commercials are Bullish with a score of 61.9 percent and the small traders (not shown in chart) are Bullish-Extreme with a score of 95.9 percent.

Natural Gas Futures StatisticsSPECULATORSCOMMERCIALSSMALL TRADERS
– Percent of Open Interest Longs:19.243.85.1
– Percent of Open Interest Shorts:30.336.21.6
– Net Position:-144,62098,41546,205
– Gross Longs:251,501572,76167,164
– Gross Shorts:396,121474,34620,959
– Long to Short Ratio:0.6 to 11.2 to 13.2 to 1
NET POSITION TREND:
– COT Index Score (3 Year Range Pct):35.261.995.9
– COT Index Reading (3 Year Range):BearishBullishBullish-Extreme
NET POSITION MOVEMENT INDEX:
– 6-Week Change in Strength Index:-3.30.623.1


Gasoline Blendstock Futures:

RBOB Gasoline Energy Futures COT ChartThe Gasoline Blendstock Futures large speculator standing this week resulted in a net position of 54,214 contracts in the data reported through Tuesday. This was a weekly increase of 9,145 contracts from the previous week which had a total of 45,069 net contracts.

This week’s current strength score (the trader positioning range over the past three years, measured from 0 to 100) shows the speculators are currently Bearish with a score of 25.3 percent. The commercials are Bullish with a score of 74.9 percent and the small traders (not shown in chart) are Bullish with a score of 58.8 percent.

Nasdaq Mini Futures StatisticsSPECULATORSCOMMERCIALSSMALL TRADERS
– Percent of Open Interest Longs:32.145.76.6
– Percent of Open Interest Shorts:16.064.24.2
– Net Position:54,214-62,1147,900
– Gross Longs:108,162153,83322,091
– Gross Shorts:53,948215,94714,191
– Long to Short Ratio:2.0 to 10.7 to 11.6 to 1
NET POSITION TREND:
– COT Index Score (3 Year Range Pct):25.374.958.8
– COT Index Reading (3 Year Range):BearishBullishBullish
NET POSITION MOVEMENT INDEX:
– 6-Week Change in Strength Index:3.2-3.30.7


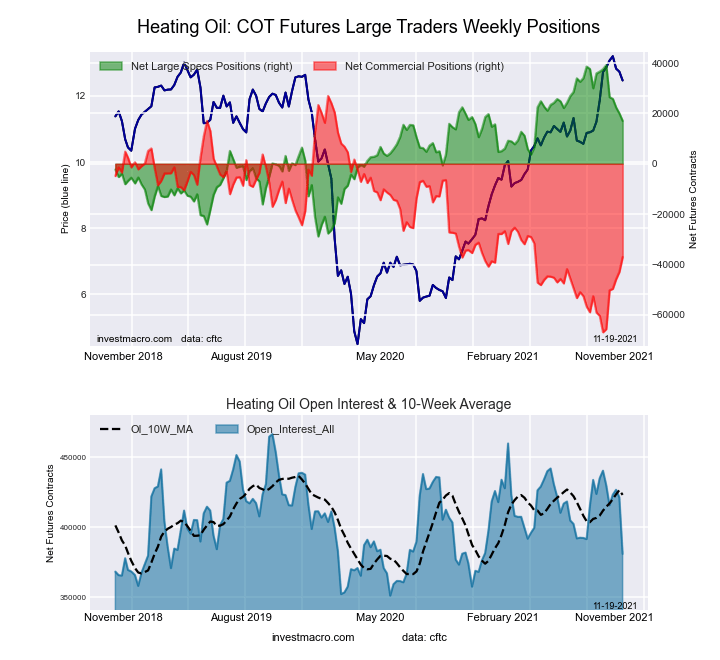
#2 Heating Oil NY-Harbor Futures:

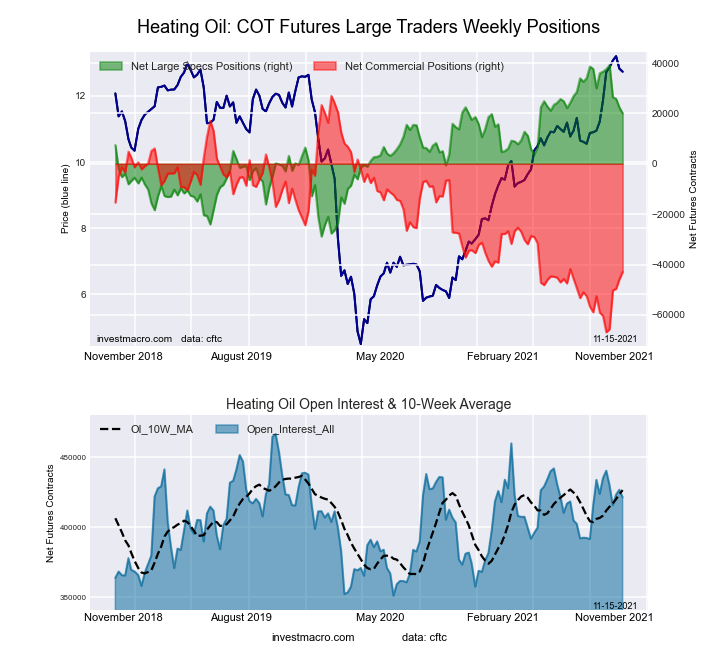
NY Harbor Heating Oil Energy Futures COT ChartThe #2 Heating Oil NY-Harbor Futures large speculator standing this week resulted in a net position of 17,029 contracts in the data reported through Tuesday. This was a weekly lowering of -2,993 contracts from the previous week which had a total of 20,022 net contracts.

This week’s current strength score (the trader positioning range over the past three years, measured from 0 to 100) shows the speculators are currently Bullish with a score of 67.5 percent. The commercials are Bearish with a score of 31.8 percent and the small traders (not shown in chart) are Bullish with a score of 67.6 percent.

Heating Oil Futures StatisticsSPECULATORSCOMMERCIALSSMALL TRADERS
– Percent of Open Interest Longs:14.052.312.3
– Percent of Open Interest Shorts:9.662.07.1
– Net Position:17,029-37,01019,981
– Gross Longs:53,501199,25246,852
– Gross Shorts:36,472236,26226,871
– Long to Short Ratio:1.5 to 10.8 to 11.7 to 1
NET POSITION TREND:
– COT Index Score (3 Year Range Pct):67.531.867.6
– COT Index Reading (3 Year Range):BullishBearishBullish
NET POSITION MOVEMENT INDEX:
– 6-Week Change in Strength Index:-30.231.8-32.4


Bloomberg Commodity Index Futures:

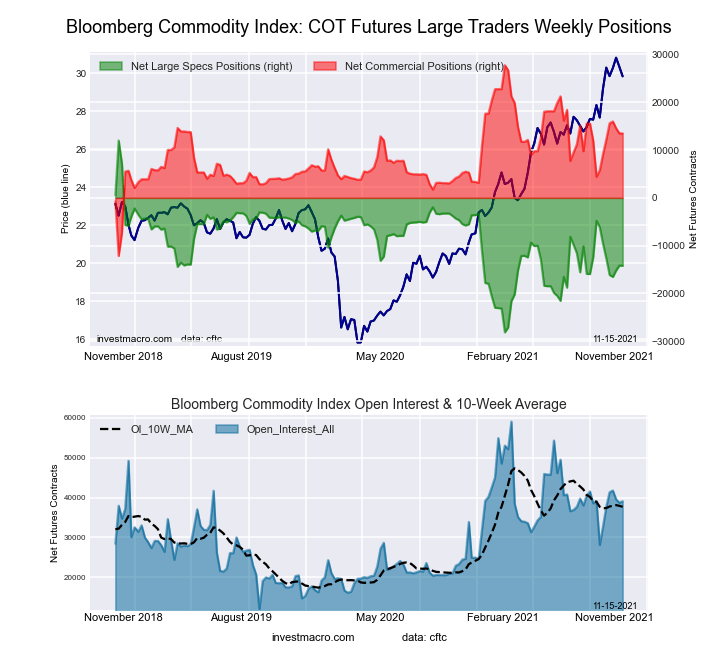
Bloomberg Commodity Index Futures COT ChartThe Bloomberg Commodity Index Futures large speculator standing this week resulted in a net position of -13,973 contracts in the data reported through Tuesday. This was a weekly increase of 218 contracts from the previous week which had a total of -14,191 net contracts.

This week’s current strength score (the trader positioning range over the past three years, measured from 0 to 100) shows the speculators are currently Bearish with a score of 35.2 percent. The commercials are Bullish with a score of 63.7 percent and the small traders (not shown in chart) are Bullish with a score of 56.0 percent.

Bloomberg Index Futures StatisticsSPECULATORSCOMMERCIALSSMALL TRADERS
– Percent of Open Interest Longs:55.737.91.9
– Percent of Open Interest Shorts:90.45.00.1
– Net Position:-13,97313,252721
– Gross Longs:22,47115,268772
– Gross Shorts:36,4442,01651
– Long to Short Ratio:0.6 to 17.6 to 115.1 to 1
NET POSITION TREND:
– COT Index Score (3 Year Range Pct):35.263.756.0
– COT Index Reading (3 Year Range):BearishBullishBullish
NET POSITION MOVEMENT INDEX:
– 6-Week Change in Strength Index:-3.22.612.3


Article By InvestMacroReceive our weekly COT Reports by Email

*COT Report: The COT data, released weekly to the public each Friday, is updated through the most recent Tuesday (data is 3 days old) and shows a quick view of how large speculators or non-commercials (for-profit traders) were positioned in the futures markets.

The CFTC categorizes trader positions according to commercial hedgers (traders who use futures contracts for hedging as part of the business), non-commercials (large traders who speculate to realize trading profits) and nonreportable traders (usually small traders/speculators) as well as their open interest (contracts open in the market at time of reporting).See CFTC criteria here.
COT Speculators lift US Dollar bullish bets higher for 19th out of 21 weeks

By InvestMacro | COT | Data Tables | COT Leaders | Downloads | COT Newsletter

Here are the latest charts and statistics for the Commitment of Traders (COT) data published by the Commodities Futures Trading Commission (CFTC). This week’s reports are delayed due to last week’s Veteran’s Day holiday.

The latest COT data is updated through Tuesday November 9th 2021 and shows a quick view of how large traders (for-profit speculators and commercial entities) were positioned in the futures markets. All currency positions are in direct relation to the US dollar where, for example, a bet for the euro is a bet that the euro will rise versus the dollar while a bet against the euro will be a bet that the euro will decline versus the dollar.

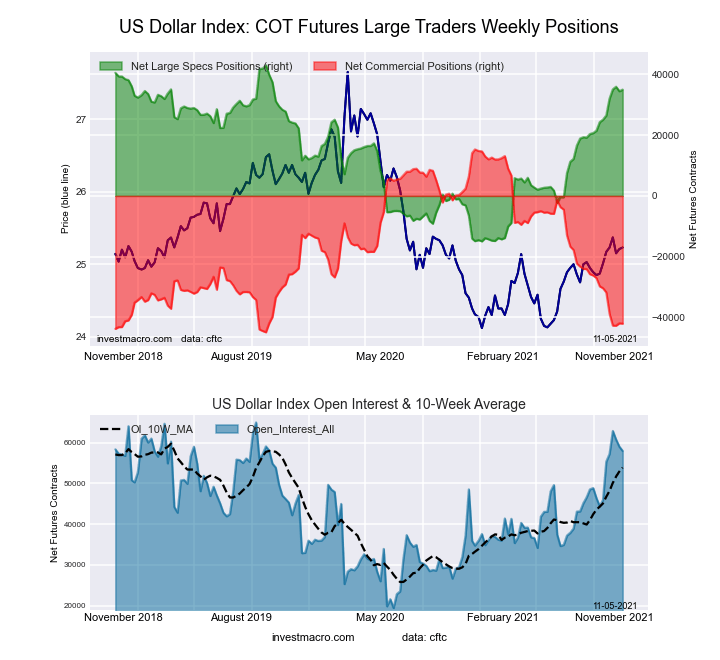
Highlighting the COT Currency data this week is the US Dollar Index which continued to creep up a little higher in the past few weeks. The dollar index speculative positions edged up higher by 466 contracts this week following an increase by just 525 contracts the previous week on November 2nd. The speculator positioning had fallen for the first time in ten weeks on October 26th before these past two small bullish increases. The USD positions have been on such a roll that bullish bets have gained in nineteen out of the past twenty-one weeks (net total gains of +37,751 contracts) and reached an approximately two-year high-point on October 19th. Currently, the USD Index maintains a bullish-extreme strength index level.


Data Snapshot of Forex Market Traders | Columns Legend
Nov-09-2021OIOI-IndexSpec-NetSpec-IndexCom-NetCOM-IndexSmalls-NetSmalls-Index
USD Index57,7138435,44887-41,09565,64778
EUR678,368753,77336-32,0416728,26821
GBP186,89830-12,0936517,54840-5,45544
JPY243,08784-105,3513123,19997-17,84811
CHF51,54630-17,0434020,53454-3,49153
CAD154,720335,10459-26,6083521,50479
AUD157,26950-63,4242566,18568-2,76146
NZD43,4613112,88293-15,13972,25778
MXN164,15231-48,407145,684992,72355
RUB58,3496720,70362-22,797332,09491
BRL33,80836-15,4584815,94555-48761
Bitcoin13,82179-1,4676922301,24426


US Dollar Index Futures:

Federal Funds 30-Day Bonds Futures COT ChartThe US Dollar Index large speculator standing this week reached a net position of 35,448 contracts in the data reported through Tuesday. This was a weekly rise of 466 contracts from the previous week which had a total of 34,982 net contracts.

This week’s current strength score (the trader positioning range over the past three years, measured from 0 to 100) shows the speculators are currently Bullish-Extreme with a score of 86.9 percent. The commercials are Bearish-Extreme with a score of 6.3 percent and the small traders (not shown in chart) are Bullish with a score of 78.3 percent.

US DOLLAR INDEX StatisticsSPECULATORSCOMMERCIALSSMALL TRADERS
– Percent of Open Interest Longs:80.63.713.0
– Percent of Open Interest Shorts:19.274.93.2
– Net Position:35,448-41,0955,647
– Gross Longs:46,5212,1307,516
– Gross Shorts:11,07343,2251,869
– Long to Short Ratio:4.2 to 10.0 to 14.0 to 1
NET POSITION TREND:
– COT Index Score (3 Year Range Pct):86.96.378.3
– COT Index Reading (3 Year Range):Bullish-ExtremeBearish-ExtremeBullish
NET POSITION MOVEMENT INDEX:
– 6-Week Change in Strength Index:15.5-15.53.7


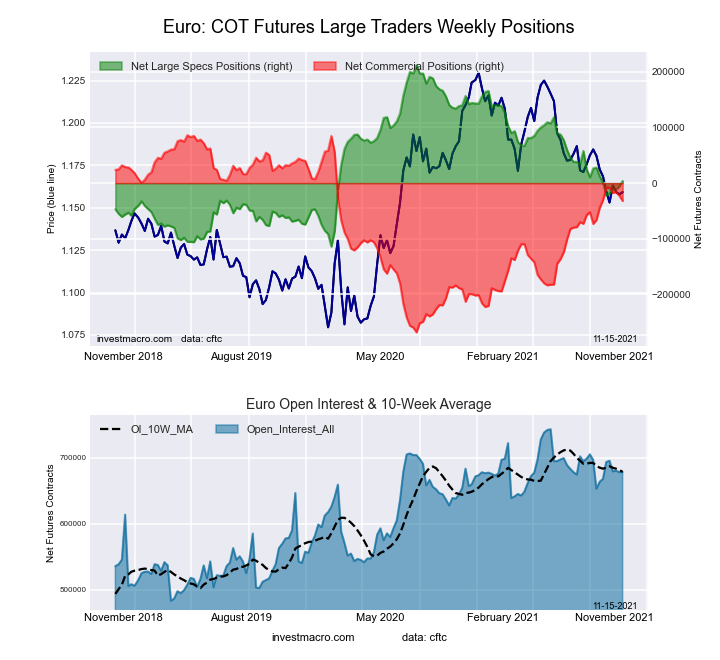
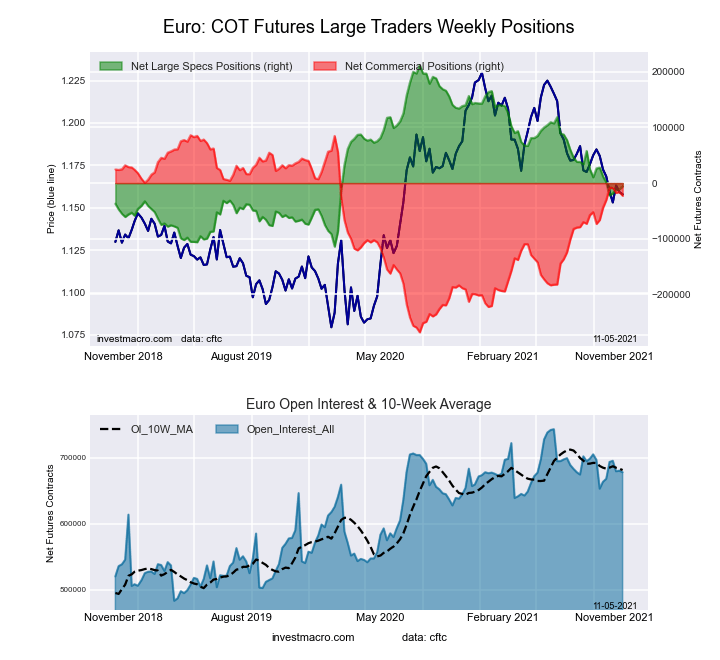
Euro Currency Futures:

2-Year Treasury Bonds Futures COT ChartThe Euro Currency large speculator standing this week reached a net position of 3,773 contracts in the data reported through Tuesday. This was a weekly rise of 9,911 contracts from the previous week which had a total of -6,138 net contracts.

This week’s current strength score (the trader positioning range over the past three years, measured from 0 to 100) shows the speculators are currently Bearish with a score of 36.2 percent. The commercials are Bullish with a score of 66.7 percent and the small traders (not shown in chart) are Bearish with a score of 21.2 percent.

EURO Currency StatisticsSPECULATORSCOMMERCIALSSMALL TRADERS
– Percent of Open Interest Longs:28.457.512.4
– Percent of Open Interest Shorts:27.862.28.2
– Net Position:3,773-32,04128,268
– Gross Longs:192,544389,82283,827
– Gross Shorts:188,771421,86355,559
– Long to Short Ratio:1.0 to 10.9 to 11.5 to 1
NET POSITION TREND:
– COT Index Score (3 Year Range Pct):36.266.721.2
– COT Index Reading (3 Year Range):BearishBullishBearish
NET POSITION MOVEMENT INDEX:
– 6-Week Change in Strength Index:0.9-0.5-2.1


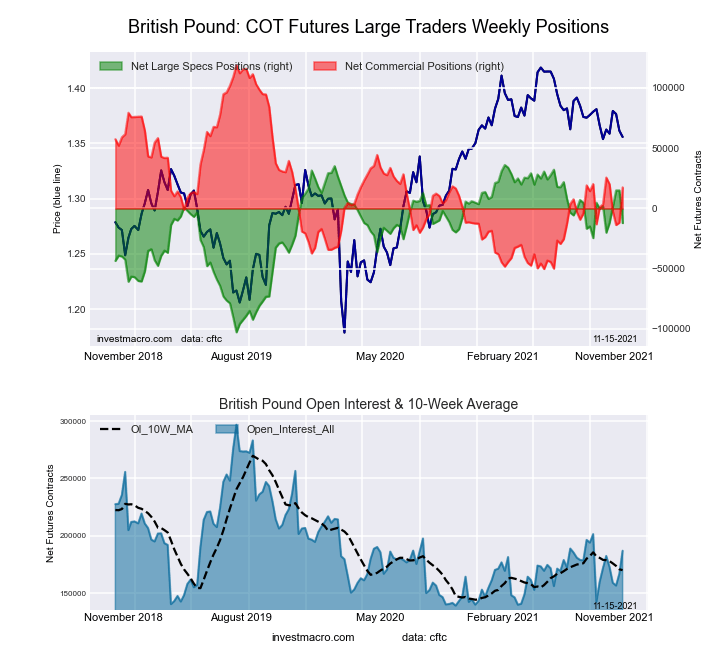
British Pound Sterling Futures:

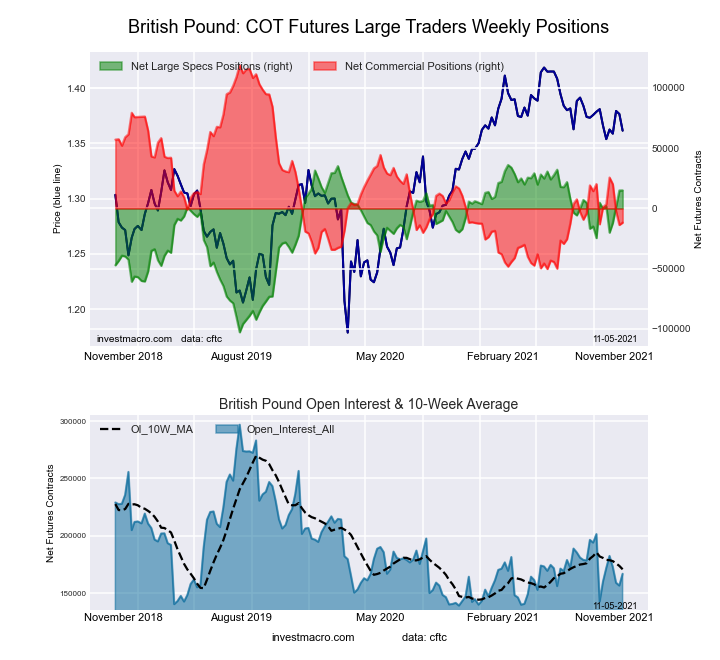
5-Year Treasury Bonds Futures COT ChartThe British Pound Sterling large speculator standing this week reached a net position of -12,093 contracts in the data reported through Tuesday. This was a weekly lowering of -27,140 contracts from the previous week which had a total of 15,047 net contracts.

This week’s current strength score (the trader positioning range over the past three years, measured from 0 to 100) shows the speculators are currently Bullish with a score of 65.3 percent. The commercials are Bearish with a score of 40.1 percent and the small traders (not shown in chart) are Bearish with a score of 44.3 percent.

BRITISH POUND StatisticsSPECULATORSCOMMERCIALSSMALL TRADERS
– Percent of Open Interest Longs:28.954.313.1
– Percent of Open Interest Shorts:35.444.916.0
– Net Position:-12,09317,548-5,455
– Gross Longs:54,004101,49224,510
– Gross Shorts:66,09783,94429,965
– Long to Short Ratio:0.8 to 11.2 to 10.8 to 1
NET POSITION TREND:
– COT Index Score (3 Year Range Pct):65.340.144.3
– COT Index Reading (3 Year Range):BullishBearishBearish
NET POSITION MOVEMENT INDEX:
– 6-Week Change in Strength Index:-10.18.4-0.2


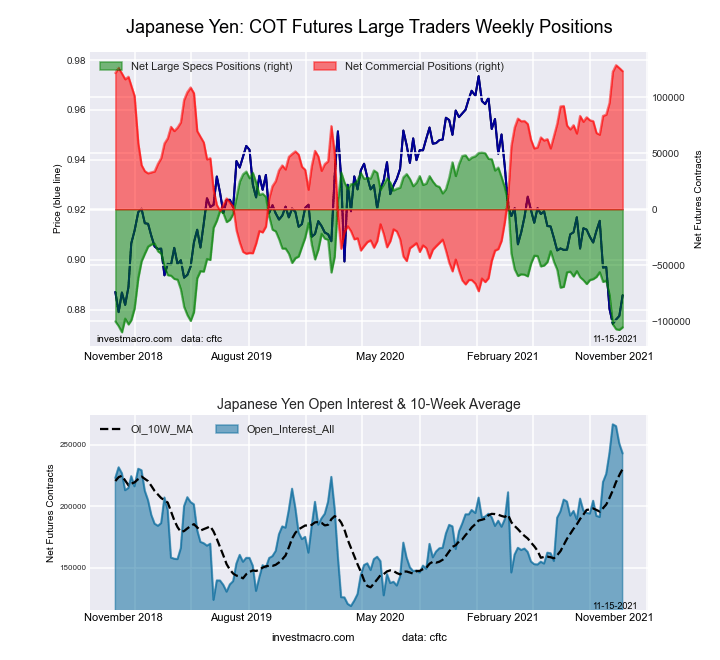
Japanese Yen Futures:

10-Year Treasury Notes Bonds Futures COT ChartThe Japanese Yen large speculator standing this week reached a net position of -105,351 contracts in the data reported through Tuesday. This was a weekly lift of 2,273 contracts from the previous week which had a total of -107,624 net contracts.

This week’s current strength score (the trader positioning range over the past three years, measured from 0 to 100) shows the speculators are currently Bearish-Extreme with a score of 2.8 percent. The commercials are Bullish-Extreme with a score of 97.3 percent and the small traders (not shown in chart) are Bearish-Extreme with a score of 11.2 percent.

JAPANESE YEN StatisticsSPECULATORSCOMMERCIALSSMALL TRADERS
– Percent of Open Interest Longs:6.883.58.8
– Percent of Open Interest Shorts:50.132.816.1
– Net Position:-105,351123,199-17,848
– Gross Longs:16,440203,04421,297
– Gross Shorts:121,79179,84539,145
– Long to Short Ratio:0.1 to 12.5 to 10.5 to 1
NET POSITION TREND:
– COT Index Score (3 Year Range Pct):2.897.311.2
– COT Index Reading (3 Year Range):Bearish-ExtremeBullish-ExtremeBearish-Extreme
NET POSITION MOVEMENT INDEX:
– 6-Week Change in Strength Index:-25.319.81.5


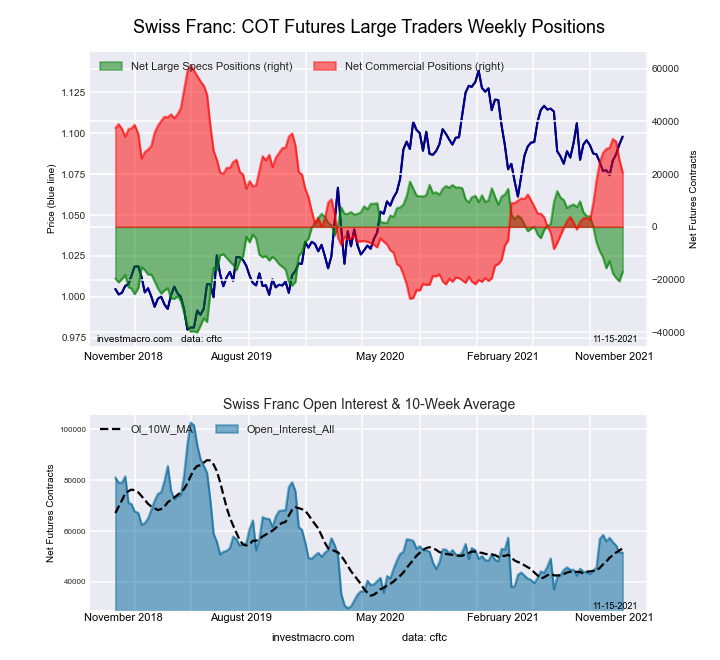
Swiss Franc Futures:

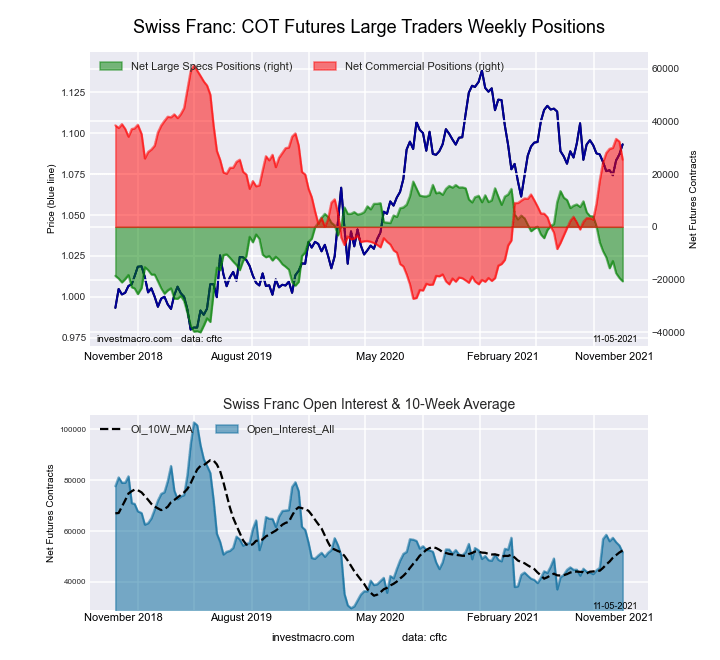
Ultra 10-Year Treasury Notes Bonds Futures COT ChartThe Swiss Franc large speculator standing this week reached a net position of -17,043 contracts in the data reported through Tuesday. This was a weekly gain of 3,605 contracts from the previous week which had a total of -20,648 net contracts.

This week’s current strength score (the trader positioning range over the past three years, measured from 0 to 100) shows the speculators are currently Bearish with a score of 40.2 percent. The commercials are Bullish with a score of 54.0 percent and the small traders (not shown in chart) are Bullish with a score of 53.0 percent.

SWISS FRANC StatisticsSPECULATORSCOMMERCIALSSMALL TRADERS
– Percent of Open Interest Longs:9.163.027.3
– Percent of Open Interest Shorts:42.223.234.1
– Net Position:-17,04320,534-3,491
– Gross Longs:4,69032,49914,095
– Gross Shorts:21,73311,96517,586
– Long to Short Ratio:0.2 to 12.7 to 10.8 to 1
NET POSITION TREND:
– COT Index Score (3 Year Range Pct):40.254.053.0
– COT Index Reading (3 Year Range):BearishBullishBullish
NET POSITION MOVEMENT INDEX:
– 6-Week Change in Strength Index:-9.5-8.538.0


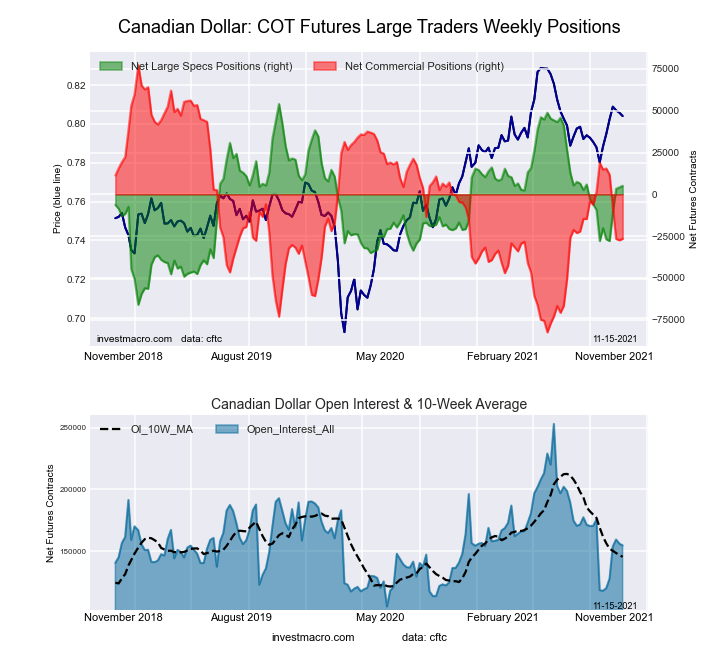
Canadian Dollar Futures:

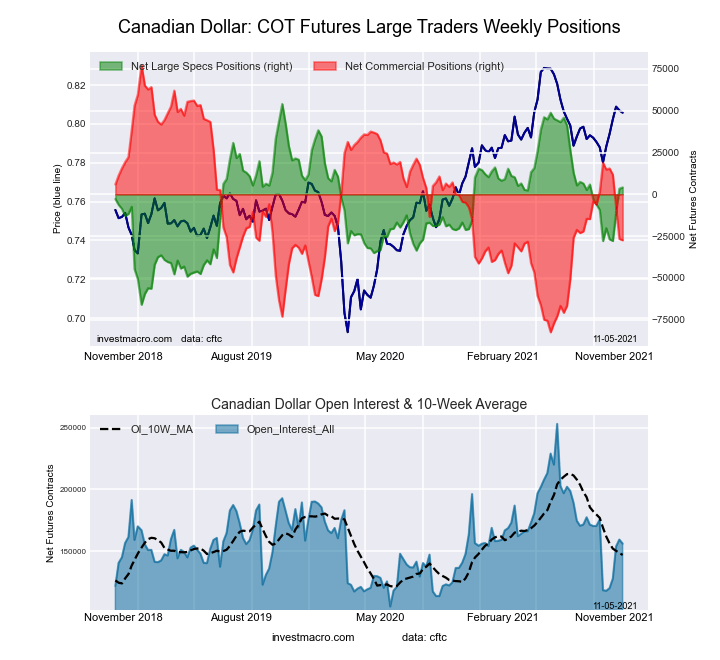
US Year Treasury Notes Long Bonds Futures COT ChartThe Canadian Dollar large speculator standing this week reached a net position of 5,104 contracts in the data reported through Tuesday. This was a weekly gain of 942 contracts from the previous week which had a total of 4,162 net contracts.

This week’s current strength score (the trader positioning range over the past three years, measured from 0 to 100) shows the speculators are currently Bullish with a score of 59.3 percent. The commercials are Bearish with a score of 35.0 percent and the small traders (not shown in chart) are Bullish with a score of 79.2 percent.

CANADIAN DOLLAR StatisticsSPECULATORSCOMMERCIALSSMALL TRADERS
– Percent of Open Interest Longs:28.443.327.8
– Percent of Open Interest Shorts:25.160.513.9
– Net Position:5,104-26,60821,504
– Gross Longs:43,96167,02142,935
– Gross Shorts:38,85793,62921,431
– Long to Short Ratio:1.1 to 10.7 to 12.0 to 1
NET POSITION TREND:
– COT Index Score (3 Year Range Pct):59.335.079.2
– COT Index Reading (3 Year Range):BullishBearishBullish
NET POSITION MOVEMENT INDEX:
– 6-Week Change in Strength Index:21.1-26.024.3


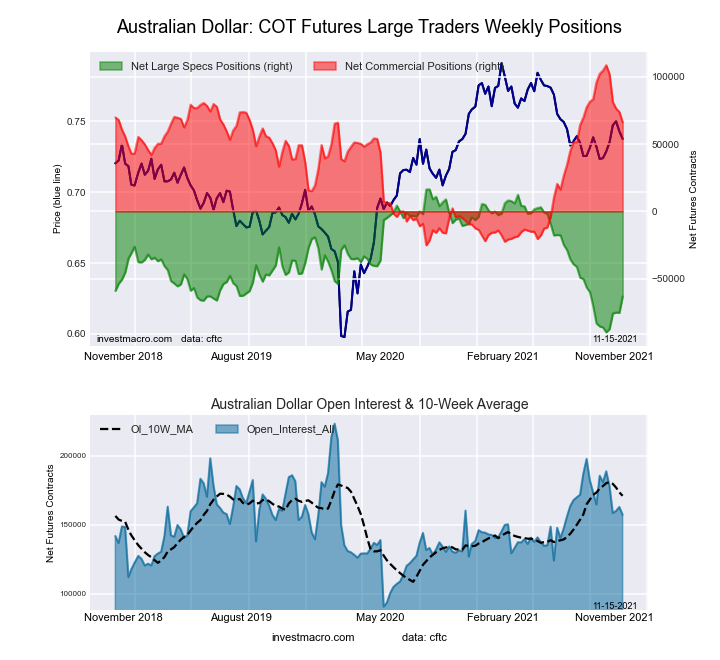
Australian Dollar Futures:

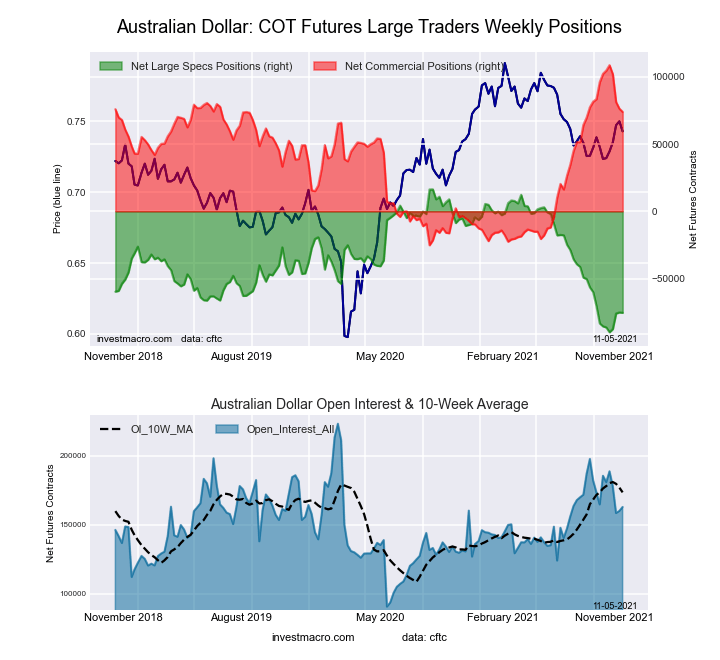
Ultra US Year Treasury Notes Long Bonds Futures COT ChartThe Australian Dollar large speculator standing this week reached a net position of -63,424 contracts in the data reported through Tuesday. This was a weekly advance of 12,072 contracts from the previous week which had a total of -75,496 net contracts.

This week’s current strength score (the trader positioning range over the past three years, measured from 0 to 100) shows the speculators are currently Bearish with a score of 25.0 percent. The commercials are Bullish with a score of 68.3 percent and the small traders (not shown in chart) are Bearish with a score of 45.7 percent.

AUSTRALIAN DOLLAR StatisticsSPECULATORSCOMMERCIALSSMALL TRADERS
– Percent of Open Interest Longs:15.269.214.4
– Percent of Open Interest Shorts:55.527.116.1
– Net Position:-63,42466,185-2,761
– Gross Longs:23,844108,88022,621
– Gross Shorts:87,26842,69525,382
– Long to Short Ratio:0.3 to 12.6 to 10.9 to 1
NET POSITION TREND:
– COT Index Score (3 Year Range Pct):25.068.345.7
– COT Index Reading (3 Year Range):BearishBullishBearish
NET POSITION MOVEMENT INDEX:
– 6-Week Change in Strength Index:21.6-28.837.9


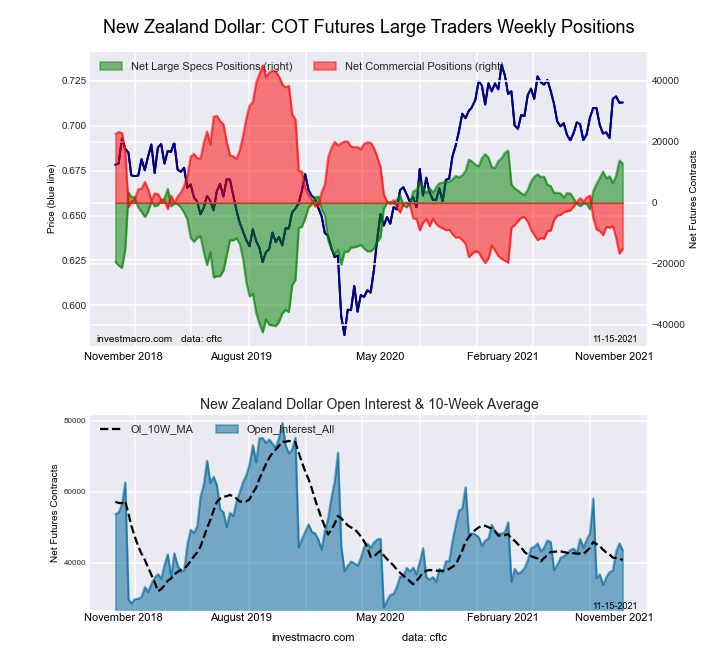
New Zealand Dollar Futures:

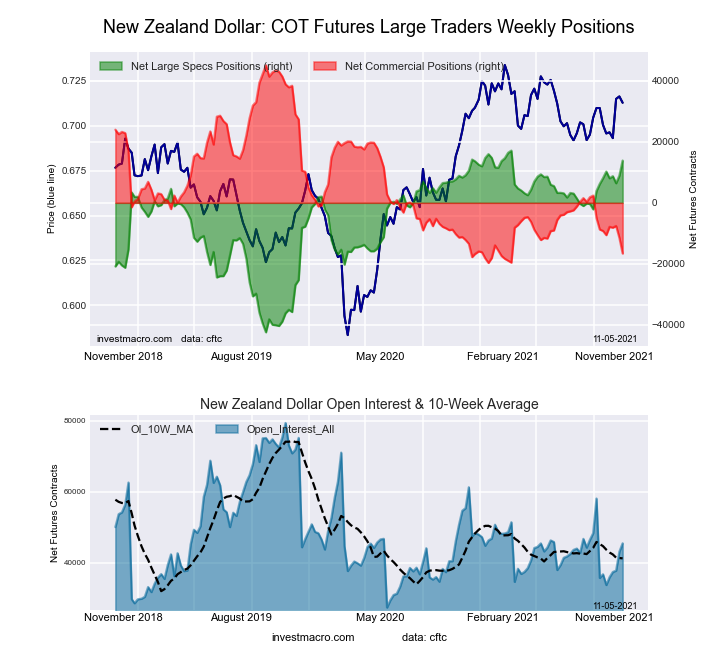
Eurodollar Bonds Futures COT ChartThe New Zealand Dollar large speculator standing this week reached a net position of 12,882 contracts in the data reported through Tuesday. This was a weekly fall of -979 contracts from the previous week which had a total of 13,861 net contracts.

This week’s current strength score (the trader positioning range over the past three years, measured from 0 to 100) shows the speculators are currently Bullish-Extreme with a score of 92.9 percent. The commercials are Bearish-Extreme with a score of 7.1 percent and the small traders (not shown in chart) are Bullish with a score of 77.7 percent.

NEW ZEALAND DOLLAR StatisticsSPECULATORSCOMMERCIALSSMALL TRADERS
– Percent of Open Interest Longs:58.226.412.4
– Percent of Open Interest Shorts:28.661.27.2
– Net Position:12,882-15,1392,257
– Gross Longs:25,31211,4675,405
– Gross Shorts:12,43026,6063,148
– Long to Short Ratio:2.0 to 10.4 to 11.7 to 1
NET POSITION TREND:
– COT Index Score (3 Year Range Pct):92.97.177.7
– COT Index Reading (3 Year Range):Bullish-ExtremeBearish-ExtremeBullish
NET POSITION MOVEMENT INDEX:
– 6-Week Change in Strength Index:4.4-7.021.8


Mexican Peso Futures:

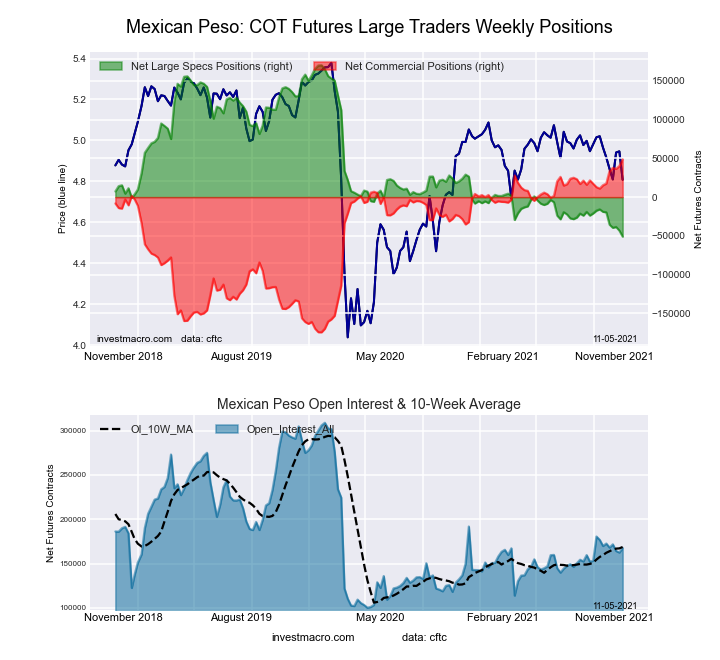
Ultra 10-Year Treasury Notes Bonds Futures COT ChartThe Mexican Peso large speculator standing this week reached a net position of -48,407 contracts in the data reported through Tuesday. This was a weekly boost of 2,611 contracts from the previous week which had a total of -51,018 net contracts.

This week’s current strength score (the trader positioning range over the past three years, measured from 0 to 100) shows the speculators are currently Bearish-Extreme with a score of 1.2 percent. The commercials are Bullish-Extreme with a score of 98.6 percent and the small traders (not shown in chart) are Bullish with a score of 54.6 percent.

MEXICAN PESO StatisticsSPECULATORSCOMMERCIALSSMALL TRADERS
– Percent of Open Interest Longs:37.657.93.6
– Percent of Open Interest Shorts:67.130.12.0
– Net Position:-48,40745,6842,723
– Gross Longs:61,79195,0745,976
– Gross Shorts:110,19849,3903,253
– Long to Short Ratio:0.6 to 11.9 to 11.8 to 1
NET POSITION TREND:
– COT Index Score (3 Year Range Pct):1.298.654.6
– COT Index Reading (3 Year Range):Bearish-ExtremeBullish-ExtremeBullish
NET POSITION MOVEMENT INDEX:
– 6-Week Change in Strength Index:-13.012.62.6


Brazilian Real Futures:

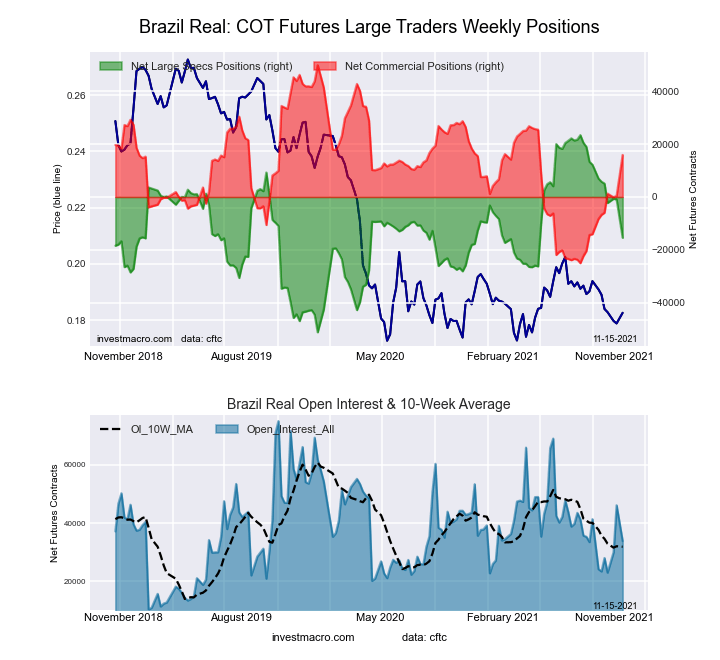
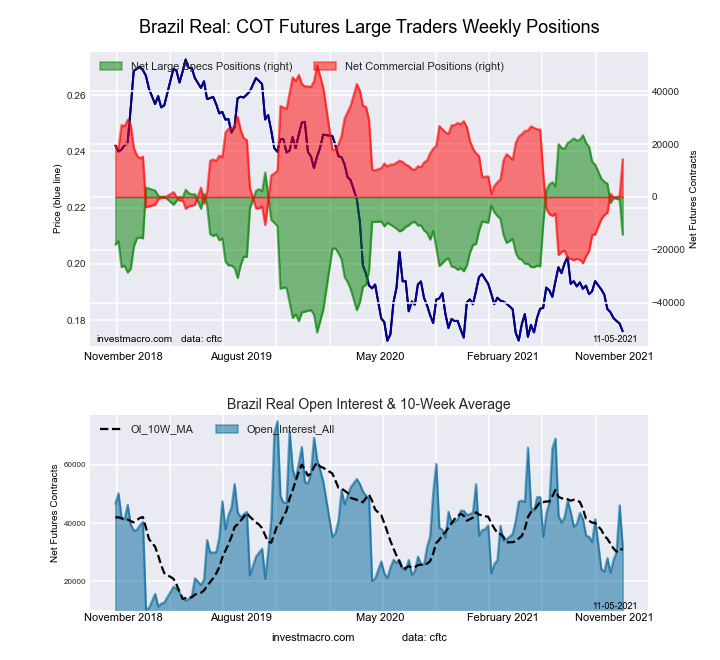
US Year Treasury Notes Long Bonds Futures COT ChartThe Brazilian Real large speculator standing this week reached a net position of -15,458 contracts in the data reported through Tuesday. This was a weekly reduction of -1,186 contracts from the previous week which had a total of -942 net contracts.

This week’s current strength score (the trader positioning range over the past three years, measured from 0 to 100) shows the speculators are currently Bearish with a score of 47.9 percent. The commercials are Bullish with a score of 54.7 percent and the small traders (not shown in chart) are Bullish with a score of 60.9 percent.

BRAZIL REAL StatisticsSPECULATORSCOMMERCIALSSMALL TRADERS
– Percent of Open Interest Longs:31.560.07.9
– Percent of Open Interest Shorts:77.212.89.4
– Net Position:-15,45815,945-487
– Gross Longs:10,64420,2752,676
– Gross Shorts:26,1024,3303,163
– Long to Short Ratio:0.4 to 14.7 to 10.8 to 1
NET POSITION TREND:
– COT Index Score (3 Year Range Pct):47.954.760.9
– COT Index Reading (3 Year Range):BearishBullishBullish
NET POSITION MOVEMENT INDEX:
– 6-Week Change in Strength Index:-27.529.2-16.4


Russian Ruble Futures:

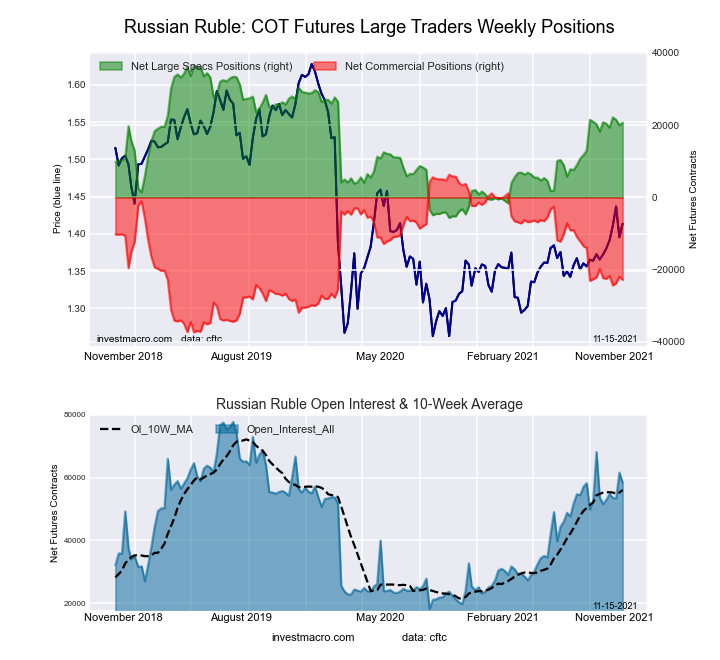
Ultra US Year Treasury Notes Long Bonds Futures COT ChartThe Russian Ruble large speculator standing this week reached a net position of 20,703 contracts in the data reported through Tuesday. This was a weekly advance of 721 contracts from the previous week which had a total of 19,982 net contracts.

This week’s current strength score (the trader positioning range over the past three years, measured from 0 to 100) shows the speculators are currently Bullish with a score of 62.4 percent. The commercials are Bearish with a score of 33.3 percent and the small traders (not shown in chart) are Bullish-Extreme with a score of 91.4 percent.

RUSSIAN RUBLE StatisticsSPECULATORSCOMMERCIALSSMALL TRADERS
– Percent of Open Interest Longs:58.037.05.0
– Percent of Open Interest Shorts:22.576.01.4
– Net Position:20,703-22,7972,094
– Gross Longs:33,85521,5702,924
– Gross Shorts:13,15244,367830
– Long to Short Ratio:2.6 to 10.5 to 13.5 to 1
NET POSITION TREND:
– COT Index Score (3 Year Range Pct):62.433.391.4
– COT Index Reading (3 Year Range):BullishBearishBullish-Extreme
NET POSITION MOVEMENT INDEX:
– 6-Week Change in Strength Index:-0.3-1.116.0


Bitcoin Futures:

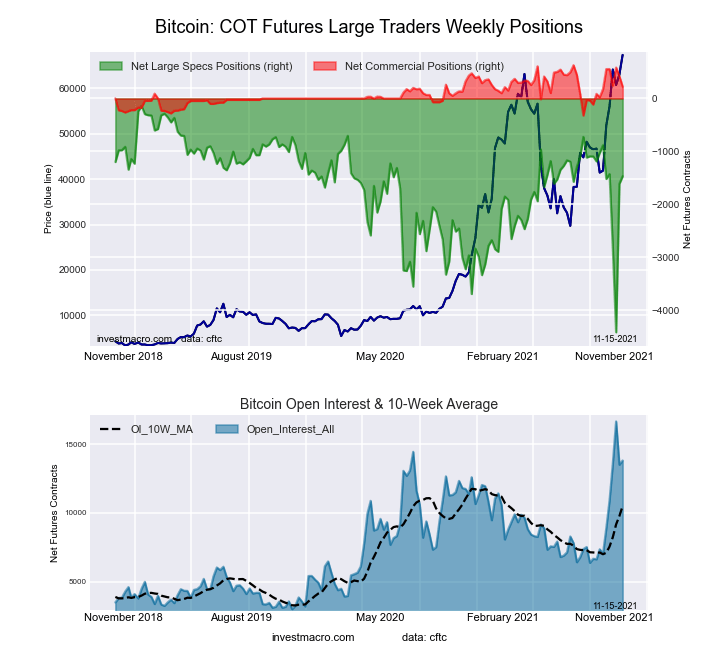
Eurodollar Bonds Futures COT ChartThe Bitcoin large speculator standing this week reached a net position of -1,467 contracts in the data reported through Tuesday. This was a weekly lift of 145 contracts from the previous week which had a total of -1,612 net contracts.

This week’s current strength score (the trader positioning range over the past three years, measured from 0 to 100) shows the speculators are currently Bullish with a score of 69.0 percent. The commercials are Bullish with a score of 57.3 percent and the small traders (not shown in chart) are Bearish with a score of 26.4 percent.

BITCOIN StatisticsSPECULATORSCOMMERCIALSSMALL TRADERS
– Percent of Open Interest Longs:67.04.115.0
– Percent of Open Interest Shorts:77.62.56.0
– Net Position:-1,4672231,244
– Gross Longs:9,2585662,071
– Gross Shorts:10,725343827
– Long to Short Ratio:0.9 to 11.7 to 12.5 to 1
NET POSITION TREND:
– COT Index Score (3 Year Range Pct):69.057.326.4
– COT Index Reading (3 Year Range):BullishBullishBearish
NET POSITION MOVEMENT INDEX:
– 6-Week Change in Strength Index:-13.74.715.3


Article By InvestMacroReceive our weekly COT Reports by Email

*COT Report: The COT data, released weekly to the public each Friday, is updated through the most recent Tuesday (data is 3 days old) and shows a quick view of how large speculators or non-commercials (for-profit traders) were positioned in the futures markets.

The CFTC categorizes trader positions according to commercial hedgers (traders who use futures contracts for hedging as part of the business), non-commercials (large traders who speculate to realize trading profits) and nonreportable traders (usually small traders/speculators) as well as their open interest (contracts open in the market at time of reporting).See CFTC criteria here.
COT Speculator Extremes: Brent Crude Oil, Coffee, MXN & Palladium lead weekly Bullish & Bearish Positions

By InvestMacro | COT | Data Tables | COT Leaders | Downloads | COT Newsletter

The latest update for the weekly Commitment of Traders (COT) report was released by the Commodity Futures Trading Commission (CFTC) on Monday (holiday delay release) for data ending on November 9th 2021.

The weekly Extreme Positions report highlights the Top 5 Most Bullish and Top 5 Most Bearish Positions for the speculator category. Extreme positioning in these markets can foreshadow strong moves in the underlying market.

To signify an extreme position, we use the Strength Index (also known as the COT Index) of each instrument, a common method of measuring COT data. The Strength Index is simply a comparison of current trader positions against the range of positions over the previous 3 years. We use over 80 percent as extremely bullish and under 20 percent as extremely bearish. (Compare Strength Index scores across all markets in the data table or cot leaders table)


Speculators or Non-Commercials Notes:

Speculators, classified as non-commercial traders by the CFTC, are made up of large commodity funds, hedge funds and other significant for-profit participants. The Specs are generally regarded as trend-followers in their behavior towards price action – net speculator bets and prices tend to go in the same directions. These traders often look to buy when prices are rising and sell when prices are falling. To illustrate this point, many times speculator contracts can be found at their most extremes (bullish or bearish) when prices are also close to their highest or lowest levels.

These extreme levels can be dangerous for the large speculators as the trade is most crowded, there is less trading ammunition still sitting on the sidelines to push the trend further and prices have moved a significant distance. When the trend becomes exhausted, some speculators take profits while others look to also exit positions when prices fail to continue in the same direction. This process usually plays out over many months to years and can ultimately create a reverse effect where prices start to fall and speculators start a process of selling when prices are falling.


Here Are This Week’s Most Bullish Speculator Positions:

Brent Oil

The Brent Oil speculator trader’s futures position comes in as the most bullish extreme standing this week. The Brent speculator level is currently at a 100 percent score of its 3-year range.

The speculator position totaled -11,851 net contracts this week which was a change by 863 contracts from last week. The speculator long position was a total of 47,922 contracts compared to the total spec short position of 59,773 contracts.


Coffee Futures

The Coffee Futures speculator trader’s futures position comes next in the extreme standings this week. The Coffee speculator level is now at a 93 percent score of its 3-year range.

The speculator position was 60,820 net contracts this week, a change by -3,533 contracts from last week. The speculator long position was a total of 78,364 contracts versus the total speculator short position of 17,544 contracts.


New Zealand Dollar

The New Zealand Dollar speculator trader’s futures position comes in third this week in the extreme standings. The NZD speculator level resides at a 93 percent score of its 3-year range.

The speculator position was 12,882 net contracts this week which marked a change by -979 contracts from last week. The speculator long position was a total of 25,312 contracts versus the total speculator short position of 12,430 contracts.


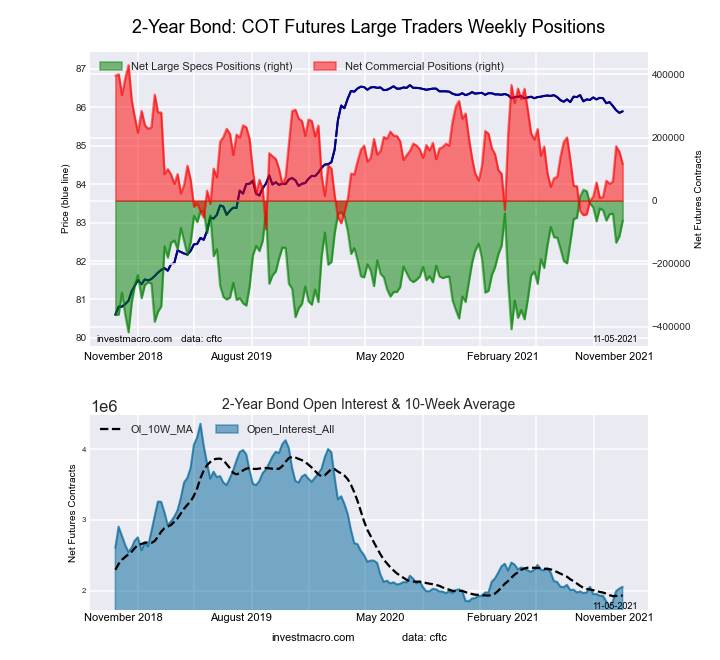
2-Year Bond

The 2-Year Bond speculator trader’s futures position comes up number four in the extreme standings this week. The 2-Year speculator level is at a 89 percent score of its 3-year range.

The speculator position was -16,737 net contracts this week and changed by 46,371 contracts from last week. The speculator long position was a total of 345,187 contracts against the total spec short position of 361,924 contracts.


US Dollar Index

The US Dollar Index speculator trader’s futures position rounds out the top five in this week’s bullish extreme standings. The USD Index speculator level sits at a 87 percent score of its 3-year range.

The speculator position was 35,448 net contracts this week which was a move of 466 contracts from last week. The speculator long position was a total of 46,521 contracts in comparison to the total speculator short position of 11,073 contracts.


This Week’s Most Bearish Speculator Positions:

Mexican Peso

The Mexican Peso speculator trader’s futures position comes in as the most bearish extreme standing this week. The MXN speculator level is at a 1 percent score of its 3-year range.

The speculator position was -48,407 net contracts this week, a weekly change of 2,611 contracts from last week. The speculator long position was a total of 61,791 contracts versus the total spec short position of 110,198 contracts.


Palladium

The Palladium speculator trader’s futures position comes in next for the most bearish extreme standing on the week. The Palladium speculator level is at a 2 percent score of its 3-year range.

The speculator position was -2,954 net contracts this week which was a change by 437 contracts from last week. The speculator long position was a total of 2,701 contracts compared to the total speculator short position of 5,655 contracts.


Japanese Yen

The Japanese Yen speculator trader’s futures position comes in as third most bearish extreme standing of the week. The JPY speculator level resides at a 3 percent score of its 3-year range.

The speculator position was -105,351 net contracts this week saw movement by 2,273 contracts from last week. The speculator long position was a total of 16,440 contracts against the total spec short position of 121,791 contracts.


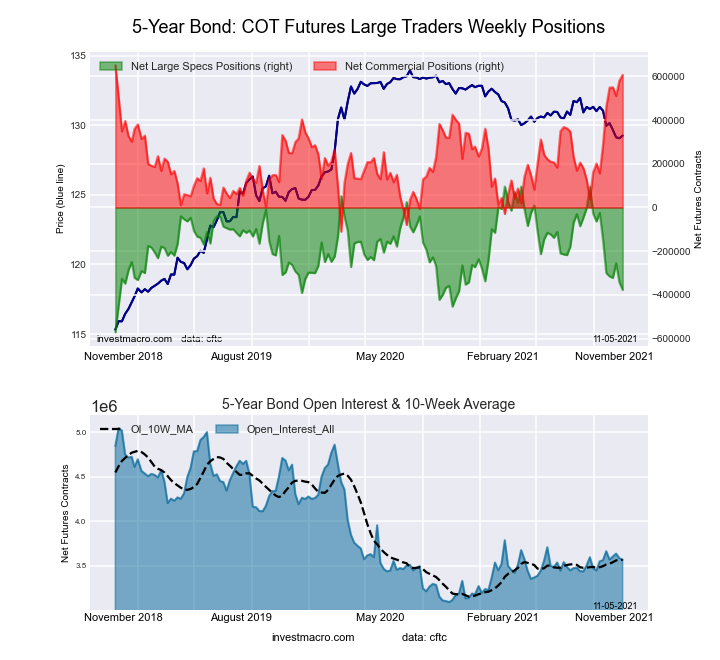
5-Year Bond

The 5-Year Bond speculator trader’s futures position comes in as this week’s fourth most bearish extreme standing. The 5-Year speculator level is at a 8 percent score of its 3-year range.

The speculator position was -407,485 net contracts this week which was a change by -31,132 contracts on the week. The speculator long position was a total of 258,018 contracts versus the total speculator short position of 665,503 contracts.


Nikkei 225 Yen

Finally, the Nikkei 225 Yen speculator trader’s futures position comes in as the fifth most bearish extreme standing for this week. The Nikkei 225 Yen speculator level is at a 21 percent score of its 3-year range.

The speculator position was -303 net contracts this week and changed by -2,188 contracts from last week. The speculator long position was a total of 9,198 contracts compared to the total spec short position of 9,501 contracts.


Article By InvestMacroReceive our weekly COT Reports by Email

*COT Report: The COT data, released weekly to the public each Friday, is updated through the most recent Tuesday (data is 3 days old) and shows a quick view of how large speculators or non-commercials (for-profit traders) were positioned in the futures markets.

The CFTC categorizes trader positions according to commercial hedgers (traders who use futures contracts for hedging as part of the business), non-commercials (large traders who speculate to realize trading profits) and nonreportable traders (usually small traders/speculators) as well as their open interest (contracts open in the market at time of reporting).See CFTC criteria here.

COT Speculators boosted Ultra 10-Year Treasury Notes & 2-Year bonds bets

By InvestMacro | COT | Data Tables | COT Leaders | Downloads | COT Newsletter

Here are the latest charts and statistics for the Commitment of Traders (COT) data published by the Commodities Futures Trading Commission (CFTC).

The latest COT data is updated through Tuesday November 9th 2021 and shows a quick view of how large traders (for-profit speculators and commercial entities) were positioned in the futures markets. This week’s reports are delayed due to last week’s Veteran’s Day holiday.

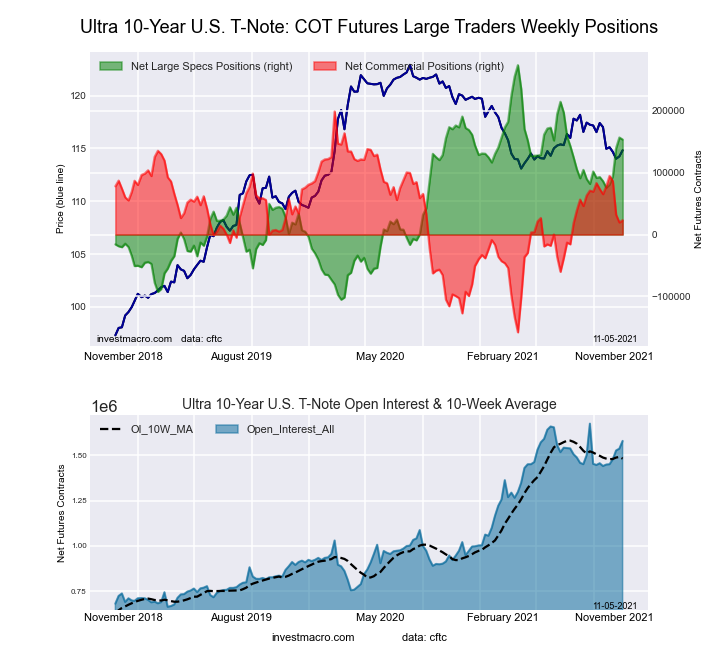
Highlighting this week’s COT data for bonds were the gains in speculative bets for the Ultra 10-Year Notes and the 2-Year bond. These two markets each rose by over +46,000 net positions this week and led the weekly net changes for all the markets we cover. These two markets are also in extreme bullish positions for the speculator strength indexes with the 2-Year bond at an 88.6 percent score while the Ultra 10-Year is at an 81.1 percent score. The strength index weighs the current position against the past three years with extreme scores above 80 (bullish) and below 20 (bearish).


Data Snapshot of Bond Market Traders | Columns Legend
Nov-09-2021OIOI-IndexSpec-NetSpec-IndexCom-NetCOM-IndexSmalls-NetSmalls-Index
Eurodollar12,396,09463-971,910311,331,31465-359,40456
FedFunds1,157,27814-67,9493177,17669-9,22745
2-Year2,013,7639-16,7378968,31331-51,5761
Long T-Bond1,206,59350-28,0728310,2592317,81367
10-Year3,883,48356-267,33231572,24796-304,9158
5-Year3,600,58926-407,4858637,634100-230,1498


3-Month Eurodollars Futures:

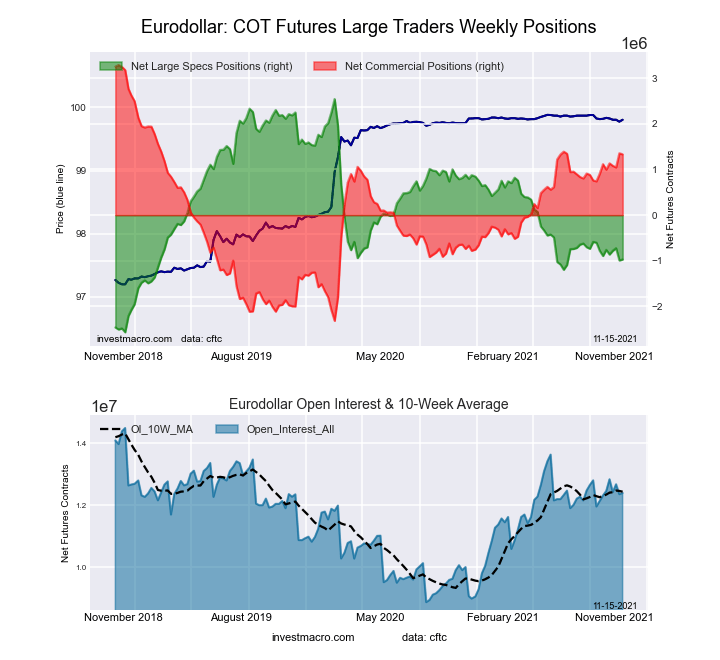
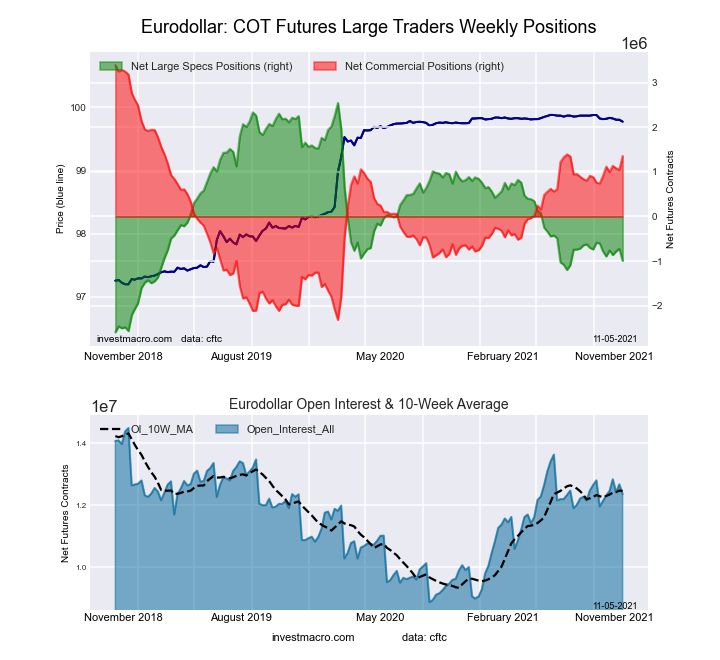
Eurodollar Bonds Futures COT ChartThe 3-Month Eurodollars large speculator standing this week recorded a net position of -971,910 contracts in the data reported through Tuesday. This was a weekly boost of 21,463 contracts from the previous week which had a total of -993,373 net contracts.

This week’s current strength score (the trader positioning range over the past three years, measured from 0 to 100) shows the speculators are currently Bearish with a score of 31.2 percent. The commercials are Bullish with a score of 65.1 percent and the small traders (not shown in chart) are Bullish with a score of 55.9 percent.

3-Month Eurodollars StatisticsSPECULATORSCOMMERCIALSSMALL TRADERS
– Percent of Open Interest Longs:12.866.84.0
– Percent of Open Interest Shorts:20.656.06.9
– Net Position:-971,9101,331,314-359,404
– Gross Longs:1,581,4798,275,703492,587
– Gross Shorts:2,553,3896,944,389851,991
– Long to Short Ratio:0.6 to 11.2 to 10.6 to 1
NET POSITION TREND:
– COT Index Score (3 Year Range Pct):31.265.155.9
– COT Index Reading (3 Year Range):BearishBullishBullish
NET POSITION MOVEMENT INDEX:
– 6-Week Change in Strength Index:-1.53.8-18.0


30-Day Federal Funds Futures:

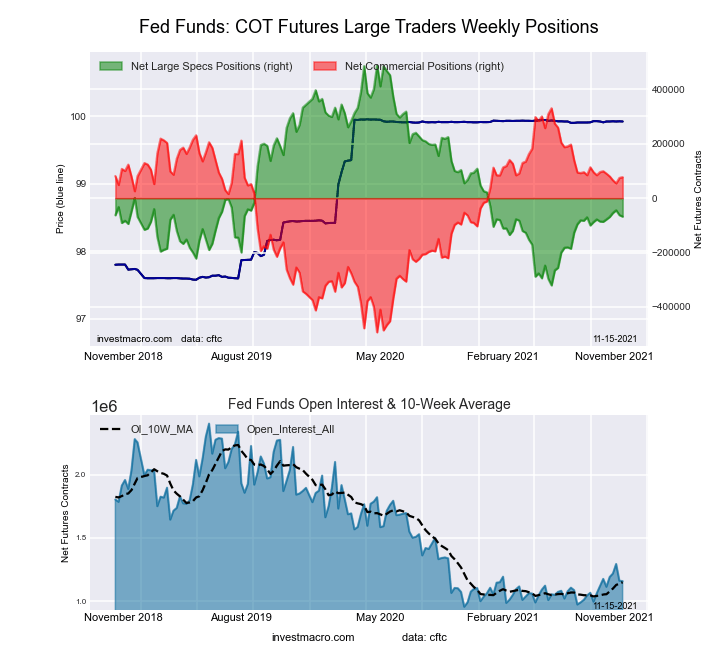
Federal Funds 30-Day Bonds Futures COT ChartThe 30-Day Federal Funds large speculator standing this week recorded a net position of -67,949 contracts in the data reported through Tuesday. This was a weekly decline of -5,481 contracts from the previous week which had a total of -62,468 net contracts.

This week’s current strength score (the trader positioning range over the past three years, measured from 0 to 100) shows the speculators are currently Bearish with a score of 31.2 percent. The commercials are Bullish with a score of 69.3 percent and the small traders (not shown in chart) are Bearish with a score of 45.4 percent.

30-Day Federal Funds StatisticsSPECULATORSCOMMERCIALSSMALL TRADERS
– Percent of Open Interest Longs:4.281.52.0
– Percent of Open Interest Shorts:10.174.82.8
– Net Position:-67,94977,176-9,227
– Gross Longs:48,886943,13422,753
– Gross Shorts:116,835865,95831,980
– Long to Short Ratio:0.4 to 11.1 to 10.7 to 1
NET POSITION TREND:
– COT Index Score (3 Year Range Pct):31.269.345.4
– COT Index Reading (3 Year Range):BearishBullishBearish
NET POSITION MOVEMENT INDEX:
– 6-Week Change in Strength Index:2.3-2.76.2


2-Year Treasury Note Futures:

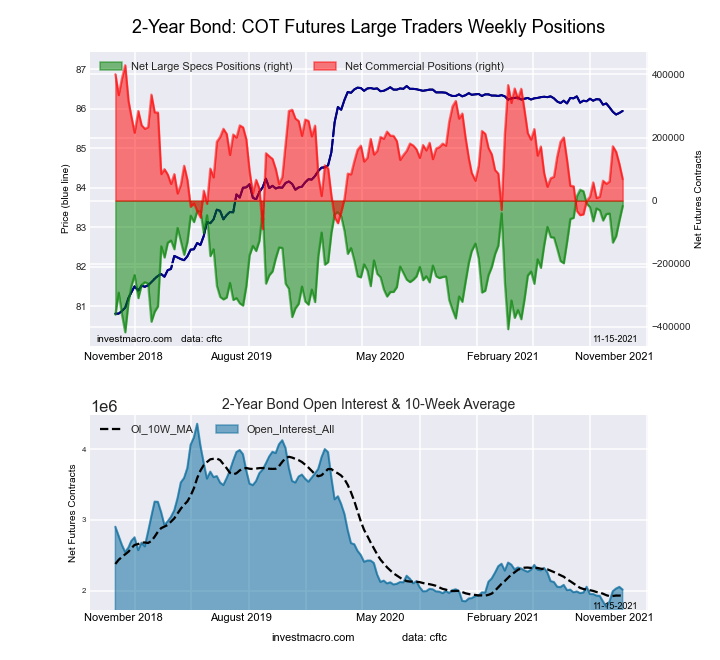
2-Year Treasury Bonds Futures COT ChartThe 2-Year Treasury Note large speculator standing this week recorded a net position of -16,737 contracts in the data reported through Tuesday. This was a weekly gain of 46,371 contracts from the previous week which had a total of -63,108 net contracts.

This week’s current strength score (the trader positioning range over the past three years, measured from 0 to 100) shows the speculators are currently Bullish-Extreme with a score of 88.6 percent. The commercials are Bearish with a score of 30.6 percent and the small traders (not shown in chart) are Bearish-Extreme with a score of 0.9 percent.

2-Year Treasury Note StatisticsSPECULATORSCOMMERCIALSSMALL TRADERS
– Percent of Open Interest Longs:17.173.16.2
– Percent of Open Interest Shorts:18.069.78.7
– Net Position:-16,73768,313-51,576
– Gross Longs:345,1871,471,287124,473
– Gross Shorts:361,9241,402,974176,049
– Long to Short Ratio:1.0 to 11.0 to 10.7 to 1
NET POSITION TREND:
– COT Index Score (3 Year Range Pct):88.630.60.9
– COT Index Reading (3 Year Range):Bullish-ExtremeBearishBearish-Extreme
NET POSITION MOVEMENT INDEX:
– 6-Week Change in Strength Index:10.21.0-29.0


5-Year Treasury Note Futures:

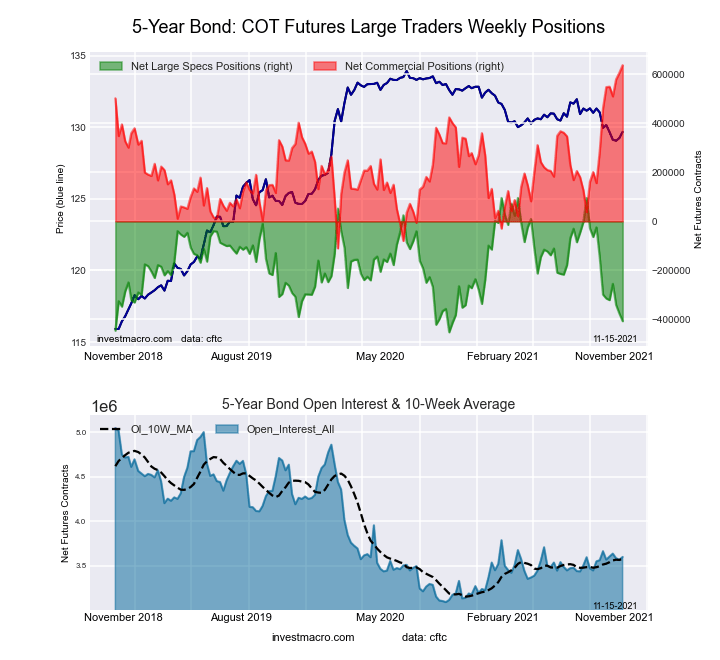
5-Year Treasury Bonds Futures COT ChartThe 5-Year Treasury Note large speculator standing this week recorded a net position of -407,485 contracts in the data reported through Tuesday. This was a weekly decrease of -31,132 contracts from the previous week which had a total of -376,353 net contracts.

This week’s current strength score (the trader positioning range over the past three years, measured from 0 to 100) shows the speculators are currently Bearish-Extreme with a score of 8.3 percent. The commercials are Bullish-Extreme with a score of 100.0 percent and the small traders (not shown in chart) are Bearish-Extreme with a score of 7.7 percent.

5-Year Treasury Note StatisticsSPECULATORSCOMMERCIALSSMALL TRADERS
– Percent of Open Interest Longs:7.282.37.1
– Percent of Open Interest Shorts:18.564.613.5
– Net Position:-407,485637,634-230,149
– Gross Longs:258,0182,964,073256,898
– Gross Shorts:665,5032,326,439487,047
– Long to Short Ratio:0.4 to 11.3 to 10.5 to 1
NET POSITION TREND:
– COT Index Score (3 Year Range Pct):8.3100.07.7
– COT Index Reading (3 Year Range):Bearish-ExtremeBullish-ExtremeBearish-Extreme
NET POSITION MOVEMENT INDEX:
– 6-Week Change in Strength Index:-19.823.5-20.8


10-Year Treasury Note Futures:

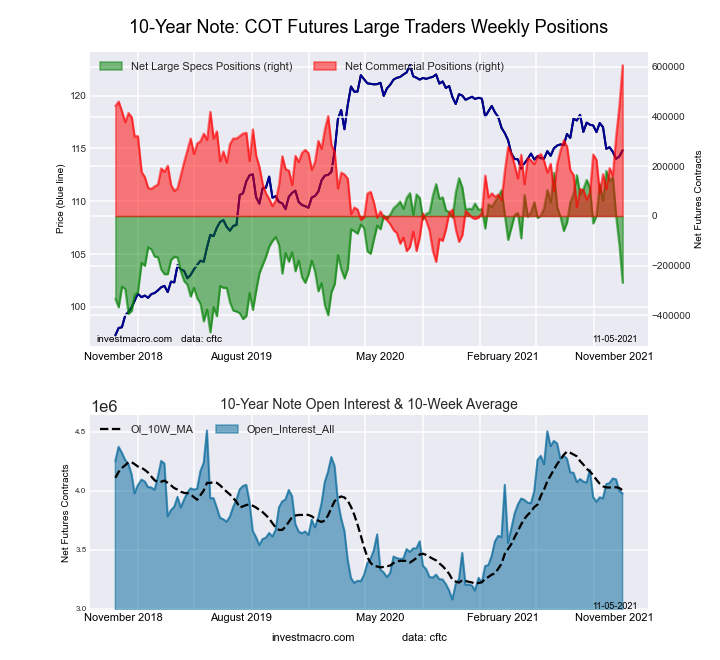
10-Year Treasury Notes Bonds Futures COT ChartThe 10-Year Treasury Note large speculator standing this week recorded a net position of -267,332 contracts in the data reported through Tuesday. This was a weekly increase of 1,337 contracts from the previous week which had a total of -268,669 net contracts.

This week’s current strength score (the trader positioning range over the past three years, measured from 0 to 100) shows the speculators are currently Bearish with a score of 30.9 percent. The commercials are Bullish-Extreme with a score of 95.7 percent and the small traders (not shown in chart) are Bearish-Extreme with a score of 7.7 percent.

10-Year Treasury Note StatisticsSPECULATORSCOMMERCIALSSMALL TRADERS
– Percent of Open Interest Longs:12.776.67.8
– Percent of Open Interest Shorts:19.561.915.7
– Net Position:-267,332572,247-304,915
– Gross Longs:491,8212,976,174303,939
– Gross Shorts:759,1532,403,927608,854
– Long to Short Ratio:0.6 to 11.2 to 10.5 to 1
NET POSITION TREND:
– COT Index Score (3 Year Range Pct):30.995.77.7
– COT Index Reading (3 Year Range):BearishBullish-ExtremeBearish-Extreme
NET POSITION MOVEMENT INDEX:
– 6-Week Change in Strength Index:-69.158.6-3.5


Ultra 10-Year Notes Futures:

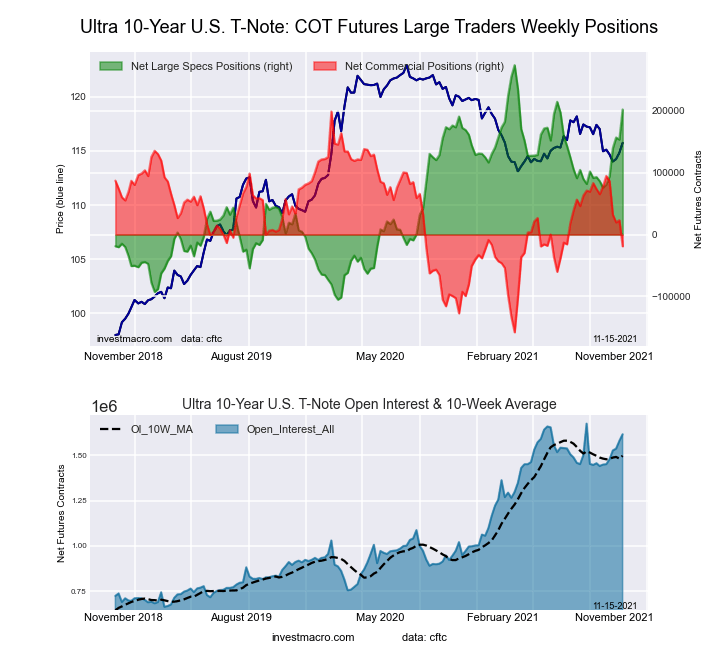
Ultra 10-Year Treasury Notes Bonds Futures COT ChartThe Ultra 10-Year Notes large speculator standing this week recorded a net position of 202,050 contracts in the data reported through Tuesday. This was a weekly increase of 48,567 contracts from the previous week which had a total of 153,483 net contracts.

This week’s current strength score (the trader positioning range over the past three years, measured from 0 to 100) shows the speculators are currently Bullish-Extreme with a score of 81.1 percent. The commercials are Bearish with a score of 39.0 percent and the small traders (not shown in chart) are Bearish-Extreme with a score of 0.0 percent.

Ultra 10-Year Notes StatisticsSPECULATORSCOMMERCIALSSMALL TRADERS
– Percent of Open Interest Longs:22.071.06.6
– Percent of Open Interest Shorts:9.572.217.9
– Net Position:202,050-18,901-183,149
– Gross Longs:355,0101,147,620105,943
– Gross Shorts:152,9601,166,521289,092
– Long to Short Ratio:2.3 to 11.0 to 10.4 to 1
NET POSITION TREND:
– COT Index Score (3 Year Range Pct):81.139.00.0
– COT Index Reading (3 Year Range):Bullish-ExtremeBearishBearish-Extreme
NET POSITION MOVEMENT INDEX:
– 6-Week Change in Strength Index:33.3-27.2-18.5


US Treasury Bonds Futures:

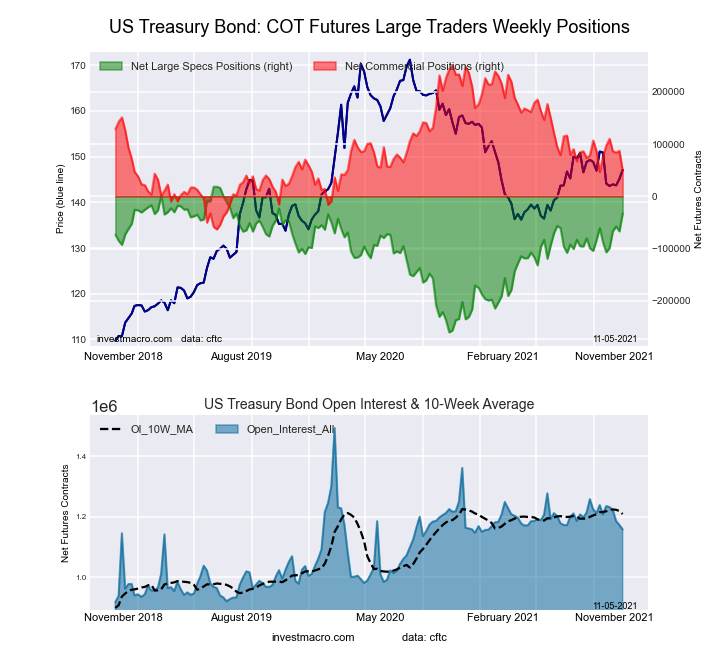
US Year Treasury Notes Long Bonds Futures COT ChartThe US Treasury Bonds large speculator standing this week recorded a net position of -28,072 contracts in the data reported through Tuesday. This was a weekly lift of 4,475 contracts from the previous week which had a total of -32,547 net contracts.

This week’s current strength score (the trader positioning range over the past three years, measured from 0 to 100) shows the speculators are currently Bullish-Extreme with a score of 83.3 percent. The commercials are Bearish with a score of 23.4 percent and the small traders (not shown in chart) are Bullish with a score of 66.7 percent.

US Treasury Bonds StatisticsSPECULATORSCOMMERCIALSSMALL TRADERS
– Percent of Open Interest Longs:11.071.615.5
– Percent of Open Interest Shorts:13.370.714.0
– Net Position:-28,07210,25917,813
– Gross Longs:132,694863,487186,632
– Gross Shorts:160,766853,228168,819
– Long to Short Ratio:0.8 to 11.0 to 11.1 to 1
NET POSITION TREND:
– COT Index Score (3 Year Range Pct):83.323.466.7
– COT Index Reading (3 Year Range):Bullish-ExtremeBearishBullish
NET POSITION MOVEMENT INDEX:
– 6-Week Change in Strength Index:28.3-27.76.5


Ultra US Treasury Bonds Futures:

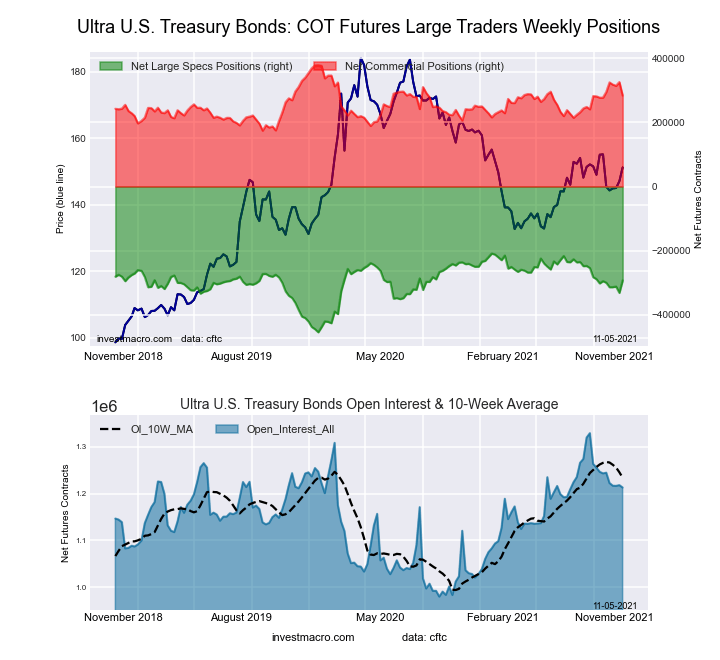
Ultra US Year Treasury Notes Long Bonds Futures COT ChartThe Ultra US Treasury Bonds large speculator standing this week recorded a net position of -300,782 contracts in the data reported through Tuesday. This was a weekly decrease of -8,171 contracts from the previous week which had a total of -292,611 net contracts.

This week’s current strength score (the trader positioning range over the past three years, measured from 0 to 100) shows the speculators are currently Bullish with a score of 62.5 percent. The commercials are Bullish with a score of 57.7 percent and the small traders (not shown in chart) are Bearish with a score of 34.8 percent.

Ultra US Treasury Bonds StatisticsSPECULATORSCOMMERCIALSSMALL TRADERS
– Percent of Open Interest Longs:4.781.412.7
– Percent of Open Interest Shorts:28.858.012.0
– Net Position:-300,782291,6639,119
– Gross Longs:58,2131,013,082157,838
– Gross Shorts:358,995721,419148,719
– Long to Short Ratio:0.2 to 11.4 to 11.1 to 1
NET POSITION TREND:
– COT Index Score (3 Year Range Pct):62.557.734.8
– COT Index Reading (3 Year Range):BullishBullishBearish
NET POSITION MOVEMENT INDEX:
– 6-Week Change in Strength Index:-0.4-1.52.9


Article By InvestMacroReceive our weekly COT Reports by Email

*COT Report: The COT data, released weekly to the public each Friday, is updated through the most recent Tuesday (data is 3 days old) and shows a quick view of how large speculators or non-commercials (for-profit traders) were positioned in the futures markets.

The CFTC categorizes trader positions according to commercial hedgers (traders who use futures contracts for hedging as part of the business), non-commercials (large traders who speculate to realize trading profits) and nonreportable traders (usually small traders/speculators) as well as their open interest (contracts open in the market at time of reporting).See CFTC criteria here.

COT Speculators push their Gold bullish bets to 39-Week high

By InvestMacro | COT | Data Tables | COT Leaders | Downloads | COT Newsletter

Here are the latest charts and statistics for the Commitment of Traders (COT) data published by the Commodities Futures Trading Commission (CFTC).

The latest COT data is updated through Tuesday November 9th 2021 and shows a quick view of how large traders (for-profit speculators and commercial entities) were positioned in the futures markets. This week’s reports are delayed due to last week’s Veteran’s Day holiday.

Highlighting this week’s COT data for the metals category is the gains in speculative bets for gold. Speculator positions jumped by over +35,000 net contracts on November 9th and marked the largest one-week increase of the past ninety weeks, dating back to February 2nd of 2020. Speculators have continued pushing their bullishness in the yellow shiny metal as bullish bets have now climbed higher for six consecutive weeks and the gold net positions have increased by a total of +81,782 contracts over that time-frame. The speculator gold standing is currently at the highest level of the past thirty-nine weeks, dating back to February 9th of this year.


Data Snapshot of Commodity Market Traders | Columns Legend
Nov-09-2021OIOI-IndexSpec-NetSpec-IndexCom-NetCOM-IndexSmalls-NetSmalls-Index
WTI Crude2,081,38522421,31246-461,9644440,65272
Gold571,02543250,18171-275,4893025,30842
Silver144,3701136,91559-53,6694616,75438
Copper213,3653622,78959-33,1943710,40585
Palladium11,81924-2,95423,00397-4942
Platinum57,8661817,63028-24,263746,63355
Natural Gas1,305,68745-142,1913698,4186243,77390
Brent192,39833-11,8511007,56704,28482
Heating Oil421,2996120,02272-42,9212622,89978
Soybeans644,317927,584379,08568-36,66911
Corn1,540,73128375,29878-320,87726-54,42112
Coffee312,1436760,82093-65,36594,54520
Sugar897,73922212,03180-260,7611948,73068
Wheat405,4383719,20363-13,40928-5,79474


Gold Comex Futures:

Federal Funds 30-Day Bonds Futures COT ChartThe Gold Comex Futures large speculator standing this week reached a net position of 250,181 contracts in the data reported through Tuesday. This was a weekly advance of 35,052 contracts from the previous week which had a total of 215,129 net contracts.

This week’s current strength score (the trader positioning range over the past three years, measured from 0 to 100) shows the speculators are currently Bullish with a score of 70.6 percent. The commercials are Bearish with a score of 29.8 percent and the small traders (not shown in chart) are Bearish with a score of 41.6 percent.

Gold Futures StatisticsSPECULATORSCOMMERCIALSSMALL TRADERS
– Percent of Open Interest Longs:59.718.48.8
– Percent of Open Interest Shorts:15.966.74.3
– Net Position:250,181-275,48925,308
– Gross Longs:341,111105,19750,094
– Gross Shorts:90,930380,68624,786
– Long to Short Ratio:3.8 to 10.3 to 12.0 to 1
NET POSITION TREND:
– COT Index Score (3 Year Range Pct):70.629.841.6
– COT Index Reading (3 Year Range):BullishBearishBearish
NET POSITION MOVEMENT INDEX:
– 6-Week Change in Strength Index:23.2-23.19.2


Silver Comex Futures:

2-Year Treasury Bonds Futures COT ChartThe Silver Comex Futures large speculator standing this week reached a net position of 36,915 contracts in the data reported through Tuesday. This was a weekly rise of 3,800 contracts from the previous week which had a total of 33,115 net contracts.

This week’s current strength score (the trader positioning range over the past three years, measured from 0 to 100) shows the speculators are currently Bullish with a score of 59.2 percent. The commercials are Bearish with a score of 46.2 percent and the small traders (not shown in chart) are Bearish with a score of 38.2 percent.

Silver Futures StatisticsSPECULATORSCOMMERCIALSSMALL TRADERS
– Percent of Open Interest Longs:45.030.319.7
– Percent of Open Interest Shorts:19.567.58.1
– Net Position:36,915-53,66916,754
– Gross Longs:65,01343,81128,432
– Gross Shorts:28,09897,48011,678
– Long to Short Ratio:2.3 to 10.4 to 12.4 to 1
NET POSITION TREND:
– COT Index Score (3 Year Range Pct):59.246.238.2
– COT Index Reading (3 Year Range):BullishBearishBearish
NET POSITION MOVEMENT INDEX:
– 6-Week Change in Strength Index:20.2-24.629.0


Copper Grade #1 Futures:

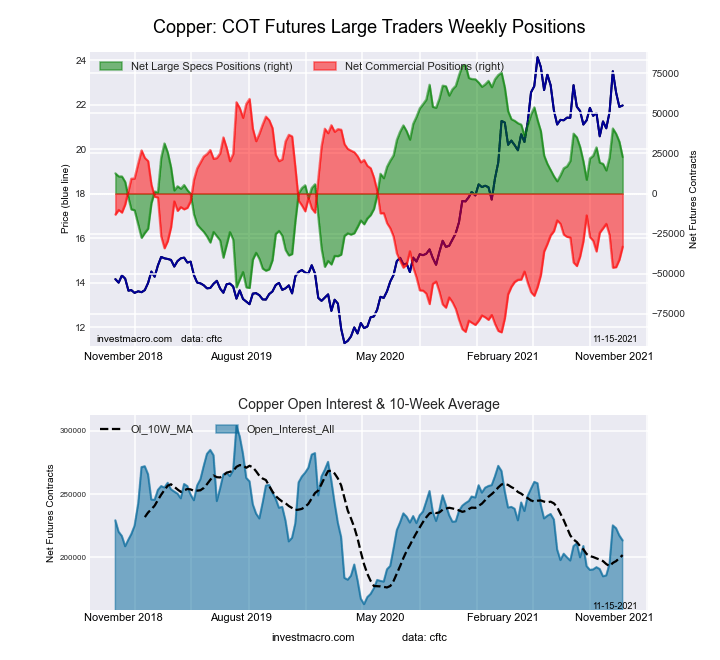
5-Year Treasury Bonds Futures COT ChartThe Copper Grade #1 Futures large speculator standing this week reached a net position of 22,789 contracts in the data reported through Tuesday. This was a weekly decline of -9,546 contracts from the previous week which had a total of 32,335 net contracts.

This week’s current strength score (the trader positioning range over the past three years, measured from 0 to 100) shows the speculators are currently Bullish with a score of 58.8 percent. The commercials are Bearish with a score of 36.6 percent and the small traders (not shown in chart) are Bullish-Extreme with a score of 85.5 percent.

Copper Futures StatisticsSPECULATORSCOMMERCIALSSMALL TRADERS
– Percent of Open Interest Longs:38.838.610.0
– Percent of Open Interest Shorts:28.154.25.1
– Net Position:22,789-33,19410,405
– Gross Longs:82,78182,41321,232
– Gross Shorts:59,992115,60710,827
– Long to Short Ratio:1.4 to 10.7 to 12.0 to 1
NET POSITION TREND:
– COT Index Score (3 Year Range Pct):58.836.685.5
– COT Index Reading (3 Year Range):BullishBearishBullish-Extreme
NET POSITION MOVEMENT INDEX:
– 6-Week Change in Strength Index:3.0-7.942.0


Platinum Futures:

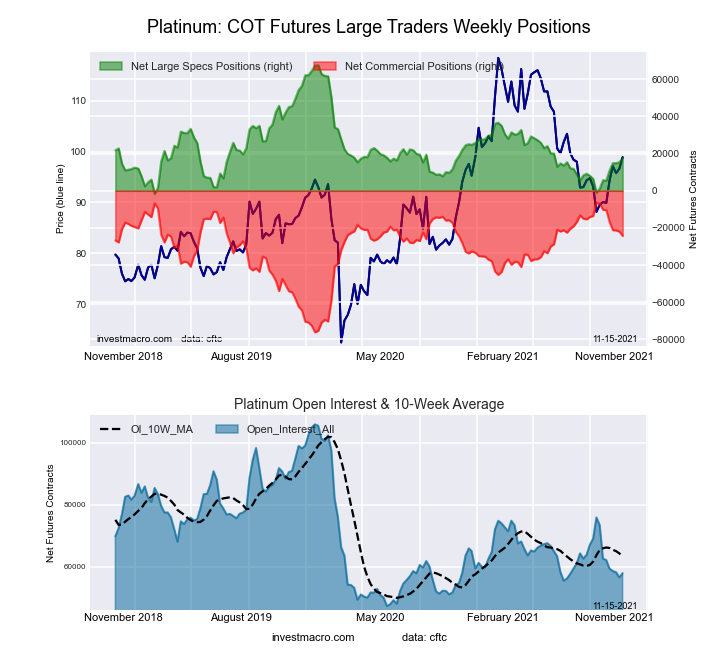
10-Year Treasury Notes Bonds Futures COT ChartThe Platinum Futures large speculator standing this week reached a net position of 17,630 contracts in the data reported through Tuesday. This was a weekly rise of 2,266 contracts from the previous week which had a total of 15,364 net contracts.

This week’s current strength score (the trader positioning range over the past three years, measured from 0 to 100) shows the speculators are currently Bearish with a score of 27.8 percent. The commercials are Bullish with a score of 74.3 percent and the small traders (not shown in chart) are Bullish with a score of 54.6 percent.

Platinum Futures StatisticsSPECULATORSCOMMERCIALSSMALL TRADERS
– Percent of Open Interest Longs:52.328.015.9
– Percent of Open Interest Shorts:21.869.94.5
– Net Position:17,630-24,2636,633
– Gross Longs:30,26016,2029,224
– Gross Shorts:12,63040,4652,591
– Long to Short Ratio:2.4 to 10.4 to 13.6 to 1
NET POSITION TREND:
– COT Index Score (3 Year Range Pct):27.874.354.6
– COT Index Reading (3 Year Range):BearishBullishBullish
NET POSITION MOVEMENT INDEX:
– 6-Week Change in Strength Index:17.3-20.229.4


Palladium Futures:

Ultra 10-Year Treasury Notes Bonds Futures COT ChartThe Palladium Futures large speculator standing this week reached a net position of -2,954 contracts in the data reported through Tuesday. This was a weekly lift of 437 contracts from the previous week which had a total of -3,391 net contracts.

This week’s current strength score (the trader positioning range over the past three years, measured from 0 to 100) shows the speculators are currently Bearish-Extreme with a score of 2.4 percent. The commercials are Bullish-Extreme with a score of 96.8 percent and the small traders (not shown in chart) are Bearish with a score of 41.8 percent.

Palladium Futures StatisticsSPECULATORSCOMMERCIALSSMALL TRADERS
– Percent of Open Interest Longs:22.950.412.1
– Percent of Open Interest Shorts:47.825.012.5
– Net Position:-2,9543,003-49
– Gross Longs:2,7015,9611,425
– Gross Shorts:5,6552,9581,474
– Long to Short Ratio:0.5 to 12.0 to 11.0 to 1
NET POSITION TREND:
– COT Index Score (3 Year Range Pct):2.496.841.8
– COT Index Reading (3 Year Range):Bearish-ExtremeBullish-ExtremeBearish
NET POSITION MOVEMENT INDEX:
– 6-Week Change in Strength Index:1.6-3.218.6


Article By InvestMacroReceive our weekly COT Reports by Email

*COT Report: The COT data, released weekly to the public each Friday, is updated through the most recent Tuesday (data is 3 days old) and shows a quick view of how large speculators or non-commercials (for-profit traders) were positioned in the futures markets.

The CFTC categorizes trader positions according to commercial hedgers (traders who use futures contracts for hedging as part of the business), non-commercials (large traders who speculate to realize trading profits) and nonreportable traders (usually small traders/speculators) as well as their open interest (contracts open in the market at time of reporting).See CFTC criteria here.
COT Speculators continue to improve their Brent Crude Oil bets

By InvestMacro | COT | Data Tables | COT Leaders | Downloads | COT Newsletter

Here are the latest charts and statistics for the Commitment of Traders (COT) data published by the Commodities Futures Trading Commission (CFTC). This week’s reports are delayed due to last week’s Veteran’s Day holiday.

The latest COT data is updated through Tuesday November 9th 2021 and shows a quick view of how large traders (for-profit speculators and commercial entities) were positioned in the futures markets.

Highlighting the latest COT Energy data is the rising position of the Brent Oil (Last Day) bets. Brent speculative positions have been steadily improving in the past two months and have now gained for six consecutive weeks. The speculative positions for Brent historically are usually bearish and the net position has continually remained in a bearish overall standing since 2013. The speculator betting is currently trending closer to the neutral zone with the net position at just -11,851 contracts. This latest standing for Brent crude bets puts the positioning at their best level of the past 159 weeks, dating all the way back to October 30th of 2018.


Data Snapshot of Commodity Market Traders | Columns Legend
Nov-09-2021OIOI-IndexSpec-NetSpec-IndexCom-NetCOM-IndexSmalls-NetSmalls-Index
WTI Crude2,081,38522421,31246-461,9644440,65272
Gold571,02543250,18171-275,4893025,30842
Silver144,3701136,91559-53,6694616,75438
Copper213,3653622,78959-33,1943710,40585
Palladium11,81924-2,95423,00397-4942
Platinum57,8661817,63028-24,263746,63355
Natural Gas1,305,68745-142,1913698,4186243,77390
Brent192,39833-11,8511007,56704,28482
Heating Oil421,2996120,02272-42,9212622,89978
Soybeans644,317927,584379,08568-36,66911
Corn1,540,73128375,29878-320,87726-54,42112
Coffee312,1436760,82093-65,36594,54520
Sugar897,73922212,03180-260,7611948,73068
Wheat405,4383719,20363-13,40928-5,79474


WTI Crude Oil Futures:

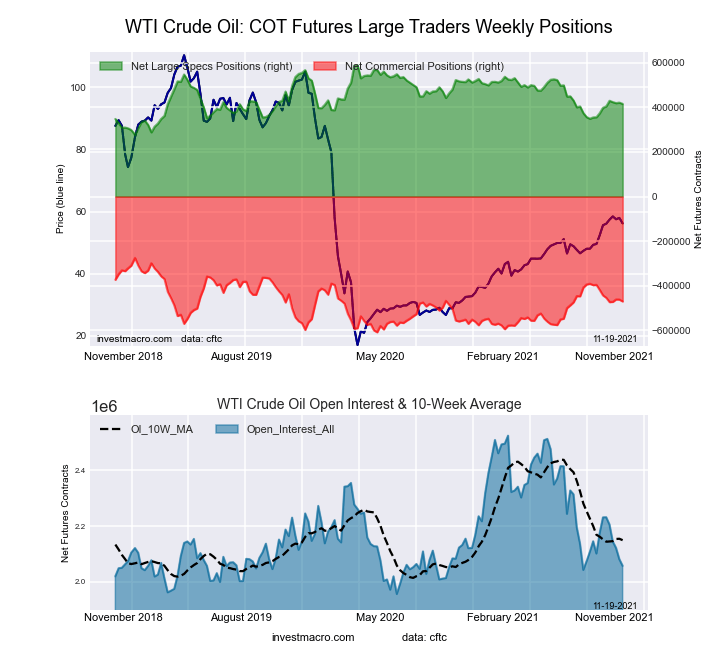
WTI Crude Oil Futures COT ChartThe WTI Crude Oil Futures large speculator standing this week equaled a net position of 421,312 contracts in the data reported through Tuesday. This was a weekly rise of 2,019 contracts from the previous week which had a total of 419,293 net contracts.

This week’s current strength score (the trader positioning range over the past three years, measured from 0 to 100) shows the speculators are currently Bearish with a score of 46.2 percent. The commercials are Bearish with a score of 44.0 percent and the small traders (not shown in chart) are Bullish with a score of 72.3 percent.

WTI Crude Oil Futures StatisticsSPECULATORSCOMMERCIALSSMALL TRADERS
– Percent of Open Interest Longs:26.533.94.6
– Percent of Open Interest Shorts:6.356.12.6
– Net Position:421,312-461,96440,652
– Gross Longs:552,579705,28695,755
– Gross Shorts:131,2671,167,25055,103
– Long to Short Ratio:4.2 to 10.6 to 11.7 to 1
NET POSITION TREND:
– COT Index Score (3 Year Range Pct):46.244.072.3
– COT Index Reading (3 Year Range):BearishBearishBullish
NET POSITION MOVEMENT INDEX:
– 6-Week Change in Strength Index:15.2-12.9-6.2


Brent Crude Oil Futures:

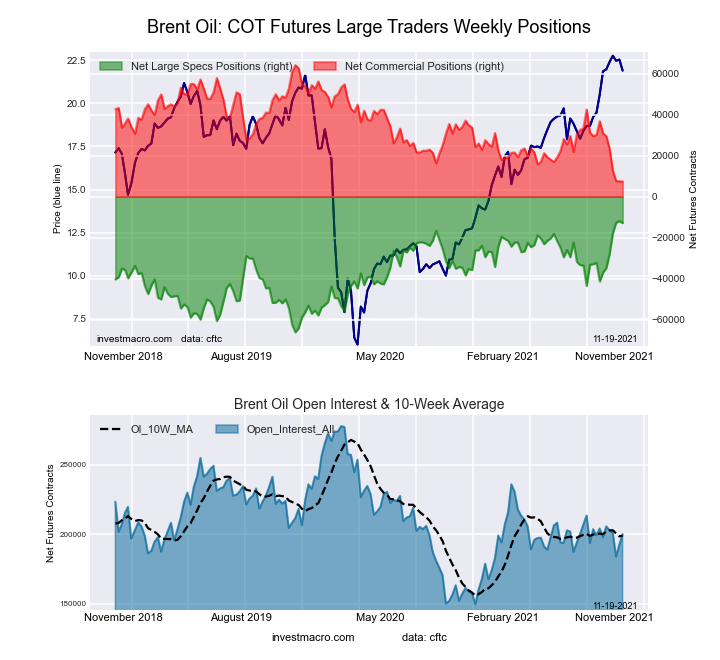
Brent Last Day Crude Oil Futures COT ChartThe Brent Crude Oil Futures large speculator standing this week equaled a net position of -11,851 contracts in the data reported through Tuesday. This was a weekly gain of 863 contracts from the previous week which had a total of -12,714 net contracts.

This week’s current strength score (the trader positioning range over the past three years, measured from 0 to 100) shows the speculators are currently Bullish-Extreme with a score of 100.0 percent. The commercials are Bearish-Extreme with a score of 0.0 percent and the small traders (not shown in chart) are Bullish-Extreme with a score of 82.2 percent.

Brent Crude Oil Futures StatisticsSPECULATORSCOMMERCIALSSMALL TRADERS
– Percent of Open Interest Longs:24.939.43.9
– Percent of Open Interest Shorts:31.135.51.7
– Net Position:-11,8517,5674,284
– Gross Longs:47,92275,8677,540
– Gross Shorts:59,77368,3003,256
– Long to Short Ratio:0.8 to 11.1 to 12.3 to 1
NET POSITION TREND:
– COT Index Score (3 Year Range Pct):100.00.082.2
– COT Index Reading (3 Year Range):Bullish-ExtremeBearish-ExtremeBullish-Extreme
NET POSITION MOVEMENT INDEX:
– 6-Week Change in Strength Index:54.3-51.7-2.4


Natural Gas Futures:

Natural Gas Futures COT ChartThe Natural Gas Futures large speculator standing this week equaled a net position of -142,191 contracts in the data reported through Tuesday. This was a weekly decrease of -4,478 contracts from the previous week which had a total of -137,713 net contracts.

This week’s current strength score (the trader positioning range over the past three years, measured from 0 to 100) shows the speculators are currently Bearish with a score of 35.9 percent. The commercials are Bullish with a score of 61.9 percent and the small traders (not shown in chart) are Bullish-Extreme with a score of 89.8 percent.

Natural Gas Futures StatisticsSPECULATORSCOMMERCIALSSMALL TRADERS
– Percent of Open Interest Longs:19.443.45.2
– Percent of Open Interest Shorts:30.335.91.9
– Net Position:-142,19198,41843,773
– Gross Longs:253,588566,74667,961
– Gross Shorts:395,779468,32824,188
– Long to Short Ratio:0.6 to 11.2 to 12.8 to 1
NET POSITION TREND:
– COT Index Score (3 Year Range Pct):35.961.989.8
– COT Index Reading (3 Year Range):BearishBullishBullish-Extreme
NET POSITION MOVEMENT INDEX:
– 6-Week Change in Strength Index:1.4-2.47.7


Gasoline Blendstock Futures:

RBOB Gasoline Energy Futures COT ChartThe Gasoline Blendstock Futures large speculator standing this week equaled a net position of 45,069 contracts in the data reported through Tuesday. This was a weekly reduction of -4,628 contracts from the previous week which had a total of 49,697 net contracts.

This week’s current strength score (the trader positioning range over the past three years, measured from 0 to 100) shows the speculators are currently Bearish-Extreme with a score of 16.0 percent. The commercials are Bullish-Extreme with a score of 83.1 percent and the small traders (not shown in chart) are Bullish with a score of 64.3 percent.

Nasdaq Mini Futures StatisticsSPECULATORSCOMMERCIALSSMALL TRADERS
– Percent of Open Interest Longs:32.645.97.3
– Percent of Open Interest Shorts:17.963.44.4
– Net Position:45,069-53,8968,827
– Gross Longs:100,218141,15122,325
– Gross Shorts:55,149195,04713,498
– Long to Short Ratio:1.8 to 10.7 to 11.7 to 1
NET POSITION TREND:
– COT Index Score (3 Year Range Pct):16.083.164.3
– COT Index Reading (3 Year Range):Bearish-ExtremeBullish-ExtremeBullish
NET POSITION MOVEMENT INDEX:
– 6-Week Change in Strength Index:1.9-3.27.9


#2 Heating Oil NY-Harbor Futures:

NY Harbor Heating Oil Energy Futures COT ChartThe #2 Heating Oil NY-Harbor Futures large speculator standing this week equaled a net position of 20,022 contracts in the data reported through Tuesday. This was a weekly decline of -2,362 contracts from the previous week which had a total of 22,384 net contracts.

This week’s current strength score (the trader positioning range over the past three years, measured from 0 to 100) shows the speculators are currently Bullish with a score of 71.9 percent. The commercials are Bearish with a score of 25.5 percent and the small traders (not shown in chart) are Bullish with a score of 77.7 percent.

Heating Oil Futures StatisticsSPECULATORSCOMMERCIALSSMALL TRADERS
– Percent of Open Interest Longs:12.954.511.1
– Percent of Open Interest Shorts:8.164.75.7
– Net Position:20,022-42,92122,899
– Gross Longs:54,200229,75646,970
– Gross Shorts:34,178272,67724,071
– Long to Short Ratio:1.6 to 10.8 to 12.0 to 1
NET POSITION TREND:
– COT Index Score (3 Year Range Pct):71.925.577.7
– COT Index Reading (3 Year Range):BullishBearishBullish
NET POSITION MOVEMENT INDEX:
– 6-Week Change in Strength Index:-24.418.6-3.0


Bloomberg Commodity Index Futures:

Bloomberg Commodity Index Futures COT ChartThe Bloomberg Commodity Index Futures large speculator standing this week equaled a net position of -14,191 contracts in the data reported through Tuesday. This was a weekly decrease of -45 contracts from the previous week which had a total of -14,146 net contracts.

This week’s current strength score (the trader positioning range over the past three years, measured from 0 to 100) shows the speculators are currently Bearish with a score of 34.7 percent. The commercials are Bullish with a score of 64.3 percent and the small traders (not shown in chart) are Bullish with a score of 55.1 percent.

Bloomberg Index Futures StatisticsSPECULATORSCOMMERCIALSSMALL TRADERS
– Percent of Open Interest Longs:53.839.72.0
– Percent of Open Interest Shorts:90.15.20.2
– Net Position:-14,19113,490701
– Gross Longs:21,02715,506769
– Gross Shorts:35,2182,01668
– Long to Short Ratio:0.6 to 17.7 to 111.3 to 1
NET POSITION TREND:
– COT Index Score (3 Year Range Pct):34.764.355.1
– COT Index Reading (3 Year Range):BearishBullishBullish
NET POSITION MOVEMENT INDEX:
– 6-Week Change in Strength Index:-11.410.811.5


Article By InvestMacroReceive our weekly COT Reports by Email

*COT Report: The COT data, released weekly to the public each Friday, is updated through the most recent Tuesday (data is 3 days old) and shows a quick view of how large speculators or non-commercials (for-profit traders) were positioned in the futures markets.

The CFTC categorizes trader positions according to commercial hedgers (traders who use futures contracts for hedging as part of the business), non-commercials (large traders who speculate to realize trading profits) and nonreportable traders (usually small traders/speculators) as well as their open interest (contracts open in the market at time of reporting).See CFTC criteria here.

COT Soft Commodities Charts: Speculators keep Cotton, Coffee & Sugar bets strongly bullish

By InvestMacro | COT | Data Tables | COT Leaders | Downloads | COT Newsletter

Here are the latest charts and statistics for the Commitment of Traders (COT) data published by the Commodities Futures Trading Commission (CFTC).

The latest COT data is updated through Tuesday November 9th 2021 and shows a quick view of how large traders (for-profit speculators and commercial entities) were positioned in the futures markets. This week’s reports are delayed due to last week’s Veteran’s Day holiday.

Highlighting this week’s COT data for Soft Commodities is the continued strength of Coffee, Cotton and Sugar. All three of these markets remain in very bullish territory for speculators and are over the extreme strength index reading of 80+ percent each. Coffee and Cotton have been having great runs in price as their ETF prices have risen by 41 and 36 percent, respectively over the past 90 days. Sugar has been not quite as hot with a 90-day gain of 16.53 percent.


Data Snapshot of Commodity Market Traders | Columns Legend
Nov-09-2021OIOI-IndexSpec-NetSpec-IndexCom-NetCOM-IndexSmalls-NetSmalls-Index
WTI Crude2,081,38522421,31246-461,9644440,65272
Gold571,02543250,18171-275,4893025,30842
Silver144,3701136,91559-53,6694616,75438
Copper213,3653622,78959-33,1943710,40585
Palladium11,81924-2,95423,00397-4942
Platinum57,8661817,63028-24,263746,63355
Natural Gas1,305,68745-142,1913698,4186243,77390
Brent192,39833-11,8511007,56704,28482
Heating Oil421,2996120,02272-42,9212622,89978
Soybeans644,317927,584379,08568-36,66911
Corn1,540,73128375,29878-320,87726-54,42112
Coffee312,1436760,82093-65,36594,54520
Sugar897,73922212,03180-260,7611948,73068
Wheat405,4383719,20363-13,40928-5,79474


CORN Futures:

Federal Funds 30-Day Bonds Futures COT ChartThe CORN large speculator standing this week totaled a net position of 375,298 contracts in the data reported through Tuesday. This was a weekly decline of -7,811 contracts from the previous week which had a total of 383,109 net contracts.

This week’s current strength score (the trader positioning range over the past three years, measured from 0 to 100) shows the speculators are currently Bullish with a score of 78.0 percent. The commercials are Bearish with a score of 26.2 percent and the small traders (not shown in chart) are Bearish-Extreme with a score of 11.7 percent.

CORN Futures StatisticsSPECULATORSCOMMERCIALSSMALL TRADERS
– Percent of Open Interest Longs:30.945.89.0
– Percent of Open Interest Shorts:6.666.712.5
– Net Position:375,298-320,877-54,421
– Gross Longs:476,313706,074138,767
– Gross Shorts:101,0151,026,951193,188
– Long to Short Ratio:4.7 to 10.7 to 10.7 to 1
NET POSITION TREND:
– COT Index Score (3 Year Range Pct):78.026.211.7
– COT Index Reading (3 Year Range):BullishBearishBearish-Extreme
NET POSITION MOVEMENT INDEX:
– 6-Week Change in Strength Index:12.4-15.15.2


SUGAR Futures:

2-Year Treasury Bonds Futures COT ChartThe SUGAR large speculator standing this week totaled a net position of 212,031 contracts in the data reported through Tuesday. This was a weekly increase of 2,970 contracts from the previous week which had a total of 209,061 net contracts.

This week’s current strength score (the trader positioning range over the past three years, measured from 0 to 100) shows the speculators are currently Bullish-Extreme with a score of 80.2 percent. The commercials are Bearish-Extreme with a score of 18.7 percent and the small traders (not shown in chart) are Bullish with a score of 68.1 percent.

SUGAR Futures StatisticsSPECULATORSCOMMERCIALSSMALL TRADERS
– Percent of Open Interest Longs:29.943.711.0
– Percent of Open Interest Shorts:6.372.85.6
– Net Position:212,031-260,76148,730
– Gross Longs:268,559392,37098,602
– Gross Shorts:56,528653,13149,872
– Long to Short Ratio:4.8 to 10.6 to 12.0 to 1
NET POSITION TREND:
– COT Index Score (3 Year Range Pct):80.218.768.1
– COT Index Reading (3 Year Range):Bullish-ExtremeBearish-ExtremeBullish
NET POSITION MOVEMENT INDEX:
– 6-Week Change in Strength Index:-7.65.97.3


COFFEE Futures:

5-Year Treasury Bonds Futures COT ChartThe COFFEE large speculator standing this week totaled a net position of 60,820 contracts in the data reported through Tuesday. This was a weekly lowering of -3,533 contracts from the previous week which had a total of 64,353 net contracts.

This week’s current strength score (the trader positioning range over the past three years, measured from 0 to 100) shows the speculators are currently Bullish-Extreme with a score of 92.8 percent. The commercials are Bearish-Extreme with a score of 8.6 percent and the small traders (not shown in chart) are Bearish-Extreme with a score of 19.8 percent.

COFFEE Futures StatisticsSPECULATORSCOMMERCIALSSMALL TRADERS
– Percent of Open Interest Longs:25.144.14.0
– Percent of Open Interest Shorts:5.665.12.6
– Net Position:60,820-65,3654,545
– Gross Longs:78,364137,70112,604
– Gross Shorts:17,544203,0668,059
– Long to Short Ratio:4.5 to 10.7 to 11.6 to 1
NET POSITION TREND:
– COT Index Score (3 Year Range Pct):92.88.619.8
– COT Index Reading (3 Year Range):Bullish-ExtremeBearish-ExtremeBearish-Extreme
NET POSITION MOVEMENT INDEX:
– 6-Week Change in Strength Index:-3.54.2-3.8


SOYBEANS Futures:

10-Year Treasury Notes Bonds Futures COT ChartThe SOYBEANS large speculator standing this week totaled a net position of 27,584 contracts in the data reported through Tuesday. This was a weekly decline of -31,172 contracts from the previous week which had a total of 58,756 net contracts.

This week’s current strength score (the trader positioning range over the past three years, measured from 0 to 100) shows the speculators are currently Bearish with a score of 37.2 percent. The commercials are Bullish with a score of 68.0 percent and the small traders (not shown in chart) are Bearish-Extreme with a score of 10.8 percent.

SOYBEANS Futures StatisticsSPECULATORSCOMMERCIALSSMALL TRADERS
– Percent of Open Interest Longs:19.259.07.2
– Percent of Open Interest Shorts:14.957.612.9
– Net Position:27,5849,085-36,669
– Gross Longs:123,904379,91846,176
– Gross Shorts:96,320370,83382,845
– Long to Short Ratio:1.3 to 11.0 to 10.6 to 1
NET POSITION TREND:
– COT Index Score (3 Year Range Pct):37.268.010.8
– COT Index Reading (3 Year Range):BearishBullishBearish-Extreme
NET POSITION MOVEMENT INDEX:
– 6-Week Change in Strength Index:-9.212.2-24.1


SOYBEAN OIL Futures:

Ultra 10-Year Treasury Notes Bonds Futures COT ChartThe SOYBEAN OIL large speculator standing this week totaled a net position of 78,712 contracts in the data reported through Tuesday. This was a weekly decrease of -12,419 contracts from the previous week which had a total of 91,131 net contracts.

This week’s current strength score (the trader positioning range over the past three years, measured from 0 to 100) shows the speculators are currently Bullish with a score of 66.3 percent. The commercials are Bearish with a score of 37.6 percent and the small traders (not shown in chart) are Bearish with a score of 34.3 percent.

SOYBEAN OIL Futures StatisticsSPECULATORSCOMMERCIALSSMALL TRADERS
– Percent of Open Interest Longs:27.148.76.6
– Percent of Open Interest Shorts:8.668.65.3
– Net Position:78,712-84,3105,598
– Gross Longs:115,011206,28928,073
– Gross Shorts:36,299290,59922,475
– Long to Short Ratio:3.2 to 10.7 to 11.2 to 1
NET POSITION TREND:
– COT Index Score (3 Year Range Pct):66.337.634.3
– COT Index Reading (3 Year Range):BullishBearishBearish
NET POSITION MOVEMENT INDEX:
– 6-Week Change in Strength Index:14.9-14.01.8


SOYBEAN MEAL Futures:

US Year Treasury Notes Long Bonds Futures COT ChartThe SOYBEAN MEAL large speculator standing this week totaled a net position of 45,635 contracts in the data reported through Tuesday. This was a weekly rise of 14,864 contracts from the previous week which had a total of 30,771 net contracts.

This week’s current strength score (the trader positioning range over the past three years, measured from 0 to 100) shows the speculators are currently Bullish with a score of 55.5 percent. The commercials are Bearish with a score of 41.9 percent and the small traders (not shown in chart) are Bullish with a score of 70.9 percent.

SOYBEAN MEAL Futures StatisticsSPECULATORSCOMMERCIALSSMALL TRADERS
– Percent of Open Interest Longs:22.245.212.1
– Percent of Open Interest Shorts:12.160.96.6
– Net Position:45,635-70,64725,012
– Gross Longs:100,078203,93154,716
– Gross Shorts:54,443274,57829,704
– Long to Short Ratio:1.8 to 10.7 to 11.8 to 1
NET POSITION TREND:
– COT Index Score (3 Year Range Pct):55.541.970.9
– COT Index Reading (3 Year Range):BullishBearishBullish
NET POSITION MOVEMENT INDEX:
– 6-Week Change in Strength Index:18.6-22.734.2


LIVE CATTLE Futures:

Ultra US Year Treasury Notes Long Bonds Futures COT ChartThe LIVE CATTLE large speculator standing this week totaled a net position of 49,203 contracts in the data reported through Tuesday. This was a weekly lift of 7,309 contracts from the previous week which had a total of 41,894 net contracts.

This week’s current strength score (the trader positioning range over the past three years, measured from 0 to 100) shows the speculators are currently Bearish with a score of 22.0 percent. The commercials are Bullish with a score of 74.0 percent and the small traders (not shown in chart) are Bullish with a score of 67.8 percent.

LIVE CATTLE Futures StatisticsSPECULATORSCOMMERCIALSSMALL TRADERS
– Percent of Open Interest Longs:33.040.610.3
– Percent of Open Interest Shorts:16.254.713.0
– Net Position:49,203-41,274-7,929
– Gross Longs:96,637118,85630,161
– Gross Shorts:47,434160,13038,090
– Long to Short Ratio:2.0 to 10.7 to 10.8 to 1
NET POSITION TREND:
– COT Index Score (3 Year Range Pct):22.074.067.8
– COT Index Reading (3 Year Range):BearishBullishBullish
NET POSITION MOVEMENT INDEX:
– 6-Week Change in Strength Index:6.1-6.2-3.7


LEAN HOGS Futures:

Eurodollar Bonds Futures COT ChartThe LEAN HOGS large speculator standing this week totaled a net position of 44,937 contracts in the data reported through Tuesday. This was a weekly decrease of -1,028 contracts from the previous week which had a total of 45,965 net contracts.

This week’s current strength score (the trader positioning range over the past three years, measured from 0 to 100) shows the speculators are currently Bullish with a score of 57.4 percent. The commercials are Bullish with a score of 53.2 percent and the small traders (not shown in chart) are Bearish-Extreme with a score of 5.6 percent.

LEAN HOGS Futures StatisticsSPECULATORSCOMMERCIALSSMALL TRADERS
– Percent of Open Interest Longs:37.734.07.3
– Percent of Open Interest Shorts:17.946.714.4
– Net Position:44,937-28,767-16,170
– Gross Longs:85,58877,19916,461
– Gross Shorts:40,651105,96632,631
– Long to Short Ratio:2.1 to 10.7 to 10.5 to 1
NET POSITION TREND:
– COT Index Score (3 Year Range Pct):57.453.25.6
– COT Index Reading (3 Year Range):BullishBullishBearish-Extreme
NET POSITION MOVEMENT INDEX:
– 6-Week Change in Strength Index:-20.023.0-12.2


COTTON Futures:

Ultra 10-Year Treasury Notes Bonds Futures COT ChartThe COTTON large speculator standing this week totaled a net position of 103,513 contracts in the data reported through Tuesday. This was a weekly decline of -40 contracts from the previous week which had a total of 103,553 net contracts.

This week’s current strength score (the trader positioning range over the past three years, measured from 0 to 100) shows the speculators are currently Bullish-Extreme with a score of 88.7 percent. The commercials are Bearish-Extreme with a score of 9.4 percent and the small traders (not shown in chart) are Bullish-Extreme with a score of 99.8 percent.

COTTON Futures StatisticsSPECULATORSCOMMERCIALSSMALL TRADERS
– Percent of Open Interest Longs:40.738.28.0
– Percent of Open Interest Shorts:4.479.33.1
– Net Position:103,513-117,33313,820
– Gross Longs:116,142108,83822,797
– Gross Shorts:12,629226,1718,977
– Long to Short Ratio:9.2 to 10.5 to 12.5 to 1
NET POSITION TREND:
– COT Index Score (3 Year Range Pct):88.79.499.8
– COT Index Reading (3 Year Range):Bullish-ExtremeBearish-ExtremeBullish-Extreme
NET POSITION MOVEMENT INDEX:
– 6-Week Change in Strength Index:-8.15.718.0


COCOA Futures:

US Year Treasury Notes Long Bonds Futures COT ChartThe COCOA large speculator standing this week totaled a net position of -4,621 contracts in the data reported through Tuesday. This was a weekly decrease of -20,695 contracts from the previous week which had a total of 16,074 net contracts.

This week’s current strength score (the trader positioning range over the past three years, measured from 0 to 100) shows the speculators are currently Bearish-Extreme with a score of 19.1 percent. The commercials are Bullish-Extreme with a score of 80.2 percent and the small traders (not shown in chart) are Bearish with a score of 44.7 percent.

COCOA Futures StatisticsSPECULATORSCOMMERCIALSSMALL TRADERS
– Percent of Open Interest Longs:24.057.84.9
– Percent of Open Interest Shorts:26.057.23.6
– Net Position:-4,6211,4343,187
– Gross Longs:57,241137,75811,777
– Gross Shorts:61,862136,3248,590
– Long to Short Ratio:0.9 to 11.0 to 11.4 to 1
NET POSITION TREND:
– COT Index Score (3 Year Range Pct):19.180.244.7
– COT Index Reading (3 Year Range):Bearish-ExtremeBullish-ExtremeBearish
NET POSITION MOVEMENT INDEX:
– 6-Week Change in Strength Index:-26.424.714.4


WHEAT Futures:

Ultra US Year Treasury Notes Long Bonds Futures COT ChartThe WHEAT large speculator standing this week totaled a net position of 19,203 contracts in the data reported through Tuesday. This was a weekly lift of 1,307 contracts from the previous week which had a total of 17,896 net contracts.

This week’s current strength score (the trader positioning range over the past three years, measured from 0 to 100) shows the speculators are currently Bullish with a score of 63.4 percent. The commercials are Bearish with a score of 27.8 percent and the small traders (not shown in chart) are Bullish with a score of 73.9 percent.

WHEAT Futures StatisticsSPECULATORSCOMMERCIALSSMALL TRADERS
– Percent of Open Interest Longs:29.034.48.7
– Percent of Open Interest Shorts:24.237.710.2
– Net Position:19,203-13,409-5,794
– Gross Longs:117,465139,28935,456
– Gross Shorts:98,262152,69841,250
– Long to Short Ratio:1.2 to 10.9 to 10.9 to 1
NET POSITION TREND:
– COT Index Score (3 Year Range Pct):63.427.873.9
– COT Index Reading (3 Year Range):BullishBearishBullish
NET POSITION MOVEMENT INDEX:
– 6-Week Change in Strength Index:19.5-24.29.8


Article By InvestMacroReceive our weekly COT Reports by Email

*COT Report: The COT data, released weekly to the public each Friday, is updated through the most recent Tuesday (data is 3 days old) and shows a quick view of how large speculators or non-commercials (for-profit traders) were positioned in the futures markets.

The CFTC categorizes trader positions according to commercial hedgers (traders who use futures contracts for hedging as part of the business), non-commercials (large traders who speculate to realize trading profits) and nonreportable traders (usually small traders/speculators) as well as their open interest (contracts open in the market at time of reporting).See CFTC criteria here.

COT Currency Charts: Speculators push New Zealand Dollar bets to 34-Week High

By InvestMacro | COT | Data Tables | COT Leaders | Downloads | COT Newsletter

Here are the latest charts and statistics for the Commitment of Traders (COT) data published by the Commodities Futures Trading Commission (CFTC).

The latest COT data is updated through Tuesday November 2nd 2021 and shows a quick view of how large traders (for-profit speculators and commercial entities) were positioned in the futures markets. All currency positions are in direct relation to the US dollar where, for example, a bet for the euro is a bet that the euro will rise versus the dollar while a bet against the euro will be a bet that the euro will decline versus the dollar.

Highlighting this week’s COT Currency data is the speculator’s boost of their New Zealand dollar bets. Speculator net positions for the NZD increased for a second consecutive week this week and for the seventh time out of the past nine weeks (9-week total of +16,002 contracts). This recent bullishness has brought the net speculator positions to over +13,000 contracts which is the highest level in the past thirty-four weeks, dating back to March 9th. NZD positions had been in negative or bearish territory as recently as August 31st before this recent bullishness propelled them higher.


Data Snapshot of Forex Market Traders | Columns Legend
Nov-02-2021OIOI-IndexSpec-NetSpec-IndexCom-NetCOM-IndexSmalls-NetSmalls-Index
USD Index57,9478534,98286-42,05357,07194
EUR678,02475-6,13833-22,7286928,86626
GBP166,7801815,04785-11,73223-3,31549
JPY251,05889-107,6241126,00599-18,38112
CHF51,61330-20,6483425,49760-4,84949
CAD156,194344,16258-27,4413423,27982
AUD162,88854-75,4961473,970741,52656
NZD45,4363513,86195-16,62552,76483
MXN167,67632-51,018048,7951002,22352
RUB61,6017319,98261-21,882351,90086
BRL31,67433-14,2725014,35753-8566
Bitcoin13,51277-1,6126642101,19125


US Dollar Index Futures:

Federal Funds 30-Day Bonds Futures COT ChartThe US Dollar Index large speculator standing this week totaled a net position of 34,982 contracts in the data reported through Tuesday. This was a weekly advance of 525 contracts from the previous week which had a total of 34,457 net contracts.

This week’s current strength score (the trader positioning range over the past three years, measured from 0 to 100) shows the speculators are currently Bullish-Extreme with a score of 86.1 percent. The commercials are Bearish-Extreme with a score of 4.7 percent and the small traders (not shown in chart) are Bullish-Extreme with a score of 93.9 percent.

US DOLLAR INDEX StatisticsSPECULATORSCOMMERCIALSSMALL TRADERS
– Percent of Open Interest Longs:78.33.315.2
– Percent of Open Interest Shorts:18.075.93.0
– Net Position:34,982-42,0537,071
– Gross Longs:45,3951,9118,799
– Gross Shorts:10,41343,9641,728
– Long to Short Ratio:4.4 to 10.0 to 15.1 to 1
NET POSITION TREND:
– COT Index Score (3 Year Range Pct):86.14.793.9
– COT Index Reading (3 Year Range):Bullish-ExtremeBearish-ExtremeBullish-Extreme
NET POSITION MOVEMENT INDEX:
– 6-Week Change in Strength Index:17.0-19.419.4


Euro Currency Futures:

2-Year Treasury Bonds Futures COT ChartThe Euro Currency large speculator standing this week totaled a net position of -6,138 contracts in the data reported through Tuesday. This was a weekly advance of 5,118 contracts from the previous week which had a total of -11,256 net contracts.

This week’s current strength score (the trader positioning range over the past three years, measured from 0 to 100) shows the speculators are currently Bearish with a score of 33.1 percent. The commercials are Bullish with a score of 69.3 percent and the small traders (not shown in chart) are Bearish with a score of 25.7 percent.

EURO Currency StatisticsSPECULATORSCOMMERCIALSSMALL TRADERS
– Percent of Open Interest Longs:28.257.912.4
– Percent of Open Interest Shorts:29.161.38.2
– Net Position:-6,138-22,72828,866
– Gross Longs:191,496392,88284,160
– Gross Shorts:197,634415,61055,294
– Long to Short Ratio:1.0 to 10.9 to 11.5 to 1
NET POSITION TREND:
– COT Index Score (3 Year Range Pct):33.169.325.7
– COT Index Reading (3 Year Range):BearishBullishBearish
NET POSITION MOVEMENT INDEX:
– 6-Week Change in Strength Index:-5.66.1-5.2


British Pound Sterling Futures:

5-Year Treasury Bonds Futures COT ChartThe British Pound Sterling large speculator standing this week totaled a net position of 15,047 contracts in the data reported through Tuesday. This was a weekly boost of 94 contracts from the previous week which had a total of 14,953 net contracts.

This week’s current strength score (the trader positioning range over the past three years, measured from 0 to 100) shows the speculators are currently Bullish-Extreme with a score of 84.8 percent. The commercials are Bearish with a score of 22.7 percent and the small traders (not shown in chart) are Bearish with a score of 48.8 percent.

BRITISH POUND StatisticsSPECULATORSCOMMERCIALSSMALL TRADERS
– Percent of Open Interest Longs:34.347.016.4
– Percent of Open Interest Shorts:25.354.118.4
– Net Position:15,047-11,732-3,315
– Gross Longs:57,25578,42027,293
– Gross Shorts:42,20890,15230,608
– Long to Short Ratio:1.4 to 10.9 to 10.9 to 1
NET POSITION TREND:
– COT Index Score (3 Year Range Pct):84.822.748.8
– COT Index Reading (3 Year Range):Bullish-ExtremeBearishBearish
NET POSITION MOVEMENT INDEX:
– 6-Week Change in Strength Index:11.0-7.6-5.1


Japanese Yen Futures:

10-Year Treasury Notes Bonds Futures COT ChartThe Japanese Yen large speculator standing this week totaled a net position of -107,624 contracts in the data reported through Tuesday. This was a weekly lowering of -588 contracts from the previous week which had a total of -107,036 net contracts.

This week’s current strength score (the trader positioning range over the past three years, measured from 0 to 100) shows the speculators are currently Bearish-Extreme with a score of 1.3 percent. The commercials are Bullish-Extreme with a score of 98.7 percent and the small traders (not shown in chart) are Bearish-Extreme with a score of 12.1 percent.

JAPANESE YEN StatisticsSPECULATORSCOMMERCIALSSMALL TRADERS
– Percent of Open Interest Longs:8.182.78.3
– Percent of Open Interest Shorts:51.032.515.7
– Net Position:-107,624126,005-18,381
– Gross Longs:20,337207,61220,944
– Gross Shorts:127,96181,60739,325
– Long to Short Ratio:0.2 to 12.5 to 10.5 to 1
NET POSITION TREND:
– COT Index Score (3 Year Range Pct):1.398.712.1
– COT Index Reading (3 Year Range):Bearish-ExtremeBullish-ExtremeBearish-Extreme
NET POSITION MOVEMENT INDEX:
– 6-Week Change in Strength Index:-32.229.5-16.7


Swiss Franc Futures:

Ultra 10-Year Treasury Notes Bonds Futures COT ChartThe Swiss Franc large speculator standing this week totaled a net position of -20,648 contracts in the data reported through Tuesday. This was a weekly lowering of -1,269 contracts from the previous week which had a total of -19,379 net contracts.

This week’s current strength score (the trader positioning range over the past three years, measured from 0 to 100) shows the speculators are currently Bearish with a score of 33.9 percent. The commercials are Bullish with a score of 59.6 percent and the small traders (not shown in chart) are Bearish with a score of 49.0 percent.

SWISS FRANC StatisticsSPECULATORSCOMMERCIALSSMALL TRADERS
– Percent of Open Interest Longs:2.870.626.1
– Percent of Open Interest Shorts:42.821.235.5
– Net Position:-20,64825,497-4,849
– Gross Longs:1,43936,45613,485
– Gross Shorts:22,08710,95918,334
– Long to Short Ratio:0.1 to 13.3 to 10.7 to 1
NET POSITION TREND:
– COT Index Score (3 Year Range Pct):33.959.649.0
– COT Index Reading (3 Year Range):BearishBullishBearish
NET POSITION MOVEMENT INDEX:
– 6-Week Change in Strength Index:-20.01.130.6


Canadian Dollar Futures:

US Year Treasury Notes Long Bonds Futures COT ChartThe Canadian Dollar large speculator standing this week totaled a net position of 4,162 contracts in the data reported through Tuesday. This was a weekly rise of 842 contracts from the previous week which had a total of 3,320 net contracts.

This week’s current strength score (the trader positioning range over the past three years, measured from 0 to 100) shows the speculators are currently Bullish with a score of 58.5 percent. The commercials are Bearish with a score of 34.5 percent and the small traders (not shown in chart) are Bullish-Extreme with a score of 81.9 percent.

CANADIAN DOLLAR StatisticsSPECULATORSCOMMERCIALSSMALL TRADERS
– Percent of Open Interest Longs:26.943.928.2
– Percent of Open Interest Shorts:24.261.513.3
– Net Position:4,162-27,44123,279
– Gross Longs:42,03768,54244,037
– Gross Shorts:37,87595,98320,758
– Long to Short Ratio:1.1 to 10.7 to 12.1 to 1
NET POSITION TREND:
– COT Index Score (3 Year Range Pct):58.534.581.9
– COT Index Reading (3 Year Range):BullishBearishBullish-Extreme
NET POSITION MOVEMENT INDEX:
– 6-Week Change in Strength Index:26.7-29.021.5


Australian Dollar Futures:

Ultra US Year Treasury Notes Long Bonds Futures COT ChartThe Australian Dollar large speculator standing this week totaled a net position of -75,496 contracts in the data reported through Tuesday. This was a weekly reduction of -250 contracts from the previous week which had a total of -75,246 net contracts.

This week’s current strength score (the trader positioning range over the past three years, measured from 0 to 100) shows the speculators are currently Bearish-Extreme with a score of 13.6 percent. The commercials are Bullish with a score of 74.1 percent and the small traders (not shown in chart) are Bullish with a score of 56.2 percent.

AUSTRALIAN DOLLAR StatisticsSPECULATORSCOMMERCIALSSMALL TRADERS
– Percent of Open Interest Longs:11.871.515.8
– Percent of Open Interest Shorts:58.126.114.9
– Net Position:-75,49673,9701,526
– Gross Longs:19,187116,46425,749
– Gross Shorts:94,68342,49424,223
– Long to Short Ratio:0.2 to 12.7 to 11.1 to 1
NET POSITION TREND:
– COT Index Score (3 Year Range Pct):13.674.156.2
– COT Index Reading (3 Year Range):Bearish-ExtremeBullishBullish
NET POSITION MOVEMENT INDEX:
– 6-Week Change in Strength Index:9.5-21.244.5


New Zealand Dollar Futures:

Eurodollar Bonds Futures COT ChartThe New Zealand Dollar large speculator standing this week totaled a net position of 13,861 contracts in the data reported through Tuesday. This was a weekly gain of 4,955 contracts from the previous week which had a total of 8,906 net contracts.

This week’s current strength score (the trader positioning range over the past three years, measured from 0 to 100) shows the speculators are currently Bullish-Extreme with a score of 94.5 percent. The commercials are Bearish-Extreme with a score of 4.8 percent and the small traders (not shown in chart) are Bullish-Extreme with a score of 83.5 percent.

NEW ZEALAND DOLLAR StatisticsSPECULATORSCOMMERCIALSSMALL TRADERS
– Percent of Open Interest Longs:60.523.513.0
– Percent of Open Interest Shorts:30.060.06.9
– Net Position:13,861-16,6252,764
– Gross Longs:27,50410,6595,893
– Gross Shorts:13,64327,2843,129
– Long to Short Ratio:2.0 to 10.4 to 11.9 to 1
NET POSITION TREND:
– COT Index Score (3 Year Range Pct):94.54.883.5
– COT Index Reading (3 Year Range):Bullish-ExtremeBearish-ExtremeBullish-Extreme
NET POSITION MOVEMENT INDEX:
– 6-Week Change in Strength Index:9.7-11.418.8


Mexican Peso Futures:

Ultra 10-Year Treasury Notes Bonds Futures COT ChartThe Mexican Peso large speculator standing this week totaled a net position of -51,018 contracts in the data reported through Tuesday. This was a weekly decrease of -7,729 contracts from the previous week which had a total of -43,289 net contracts.

This week’s current strength score (the trader positioning range over the past three years, measured from 0 to 100) shows the speculators are currently Bearish-Extreme with a score of 0.0 percent. The commercials are Bullish-Extreme with a score of 100.0 percent and the small traders (not shown in chart) are Bullish with a score of 52.4 percent.

MEXICAN PESO StatisticsSPECULATORSCOMMERCIALSSMALL TRADERS
– Percent of Open Interest Longs:36.759.13.3
– Percent of Open Interest Shorts:67.130.02.0
– Net Position:-51,01848,7952,223
– Gross Longs:61,55399,0345,560
– Gross Shorts:112,57150,2393,337
– Long to Short Ratio:0.5 to 12.0 to 11.7 to 1
NET POSITION TREND:
– COT Index Score (3 Year Range Pct):0.0100.052.4
– COT Index Reading (3 Year Range):Bearish-ExtremeBullish-ExtremeBullish
NET POSITION MOVEMENT INDEX:
– 6-Week Change in Strength Index:-14.515.0-6.2


Brazilian Real Futures:

US Year Treasury Notes Long Bonds Futures COT ChartThe Brazilian Real large speculator standing this week totaled a net position of -14,272 contracts in the data reported through Tuesday. This was a weekly lowering of -13,330 contracts from the previous week which had a total of -942 net contracts.

This week’s current strength score (the trader positioning range over the past three years, measured from 0 to 100) shows the speculators are currently Bearish with a score of 49.5 percent. The commercials are Bullish with a score of 52.6 percent and the small traders (not shown in chart) are Bullish with a score of 65.8 percent.

BRAZIL REAL StatisticsSPECULATORSCOMMERCIALSSMALL TRADERS
– Percent of Open Interest Longs:28.461.89.5
– Percent of Open Interest Shorts:73.416.59.8
– Net Position:-14,27214,357-85
– Gross Longs:8,98919,5743,023
– Gross Shorts:23,2615,2173,108
– Long to Short Ratio:0.4 to 13.8 to 11.0 to 1
NET POSITION TREND:
– COT Index Score (3 Year Range Pct):49.552.665.8
– COT Index Reading (3 Year Range):BearishBullishBullish
NET POSITION MOVEMENT INDEX:
– 6-Week Change in Strength Index:-26.828.2-13.3


Russian Ruble Futures:

Ultra US Year Treasury Notes Long Bonds Futures COT ChartThe Russian Ruble large speculator standing this week totaled a net position of 19,982 contracts in the data reported through Tuesday. This was a weekly fall of -1,480 contracts from the previous week which had a total of 21,462 net contracts.

This week’s current strength score (the trader positioning range over the past three years, measured from 0 to 100) shows the speculators are currently Bullish with a score of 60.7 percent. The commercials are Bearish with a score of 35.4 percent and the small traders (not shown in chart) are Bullish-Extreme with a score of 86.2 percent.

RUSSIAN RUBLE StatisticsSPECULATORSCOMMERCIALSSMALL TRADERS
– Percent of Open Interest Longs:59.136.34.6
– Percent of Open Interest Shorts:26.671.81.5
– Net Position:19,982-21,8821,900
– Gross Longs:36,38922,3692,843
– Gross Shorts:16,40744,251943
– Long to Short Ratio:2.2 to 10.5 to 13.0 to 1
NET POSITION TREND:
– COT Index Score (3 Year Range Pct):60.735.486.2
– COT Index Reading (3 Year Range):BullishBearishBullish-Extreme
NET POSITION MOVEMENT INDEX:
– 6-Week Change in Strength Index:4.1-4.910.2


Bitcoin Futures:

Eurodollar Bonds Futures COT ChartThe Bitcoin large speculator standing this week totaled a net position of -1,612 contracts in the data reported through Tuesday. This was a weekly increase of 2,800 contracts from the previous week which had a total of -4,412 net contracts.

This week’s current strength score (the trader positioning range over the past three years, measured from 0 to 100) shows the speculators are currently Bullish with a score of 65.6 percent. The commercials are Bullish with a score of 78.2 percent and the small traders (not shown in chart) are Bearish with a score of 24.9 percent.

BITCOIN StatisticsSPECULATORSCOMMERCIALSSMALL TRADERS
– Percent of Open Interest Longs:67.15.414.4
– Percent of Open Interest Shorts:79.02.35.6
– Net Position:-1,6124211,191
– Gross Longs:9,0627271,943
– Gross Shorts:10,674306752
– Long to Short Ratio:0.8 to 12.4 to 12.6 to 1
NET POSITION TREND:
– COT Index Score (3 Year Range Pct):65.678.224.9
– COT Index Reading (3 Year Range):BullishBullishBearish
NET POSITION MOVEMENT INDEX:
– 6-Week Change in Strength Index:-13.741.65.5


Article By InvestMacroReceive our weekly COT Reports by Email

*COT Report: The COT data, released weekly to the public each Friday, is updated through the most recent Tuesday (data is 3 days old) and shows a quick view of how large speculators or non-commercials (for-profit traders) were positioned in the futures markets.

The CFTC categorizes trader positions according to commercial hedgers (traders who use futures contracts for hedging as part of the business), non-commercials (large traders who speculate to realize trading profits) and nonreportable traders (usually small traders/speculators) as well as their open interest (contracts open in the market at time of reporting).See CFTC criteria here.
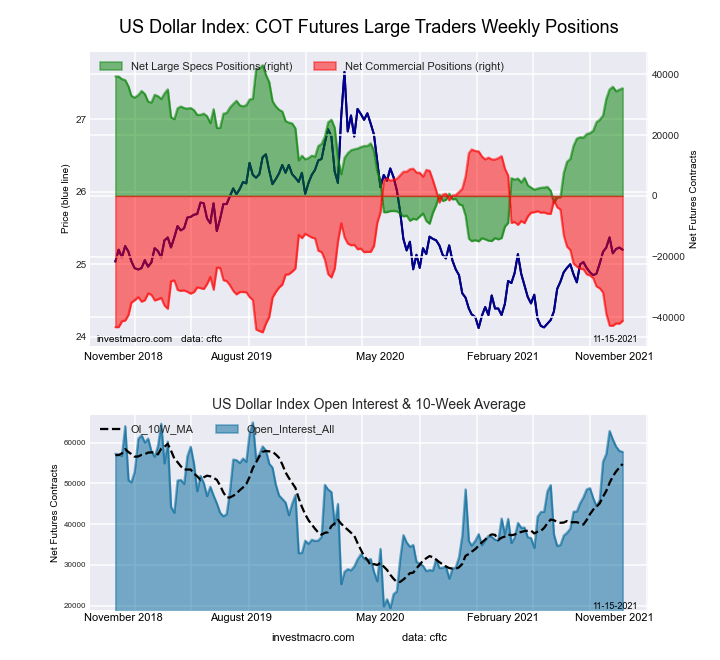
COT Bonds Futures Charts: 2-Year & Long Treasury Notes see Speculator bets rise this week

By InvestMacro | COT | Data Tables | COT Leaders | Downloads | COT Newsletter

Here are the latest charts and statistics for the Commitment of Traders (COT) data published by the Commodities Futures Trading Commission (CFTC).
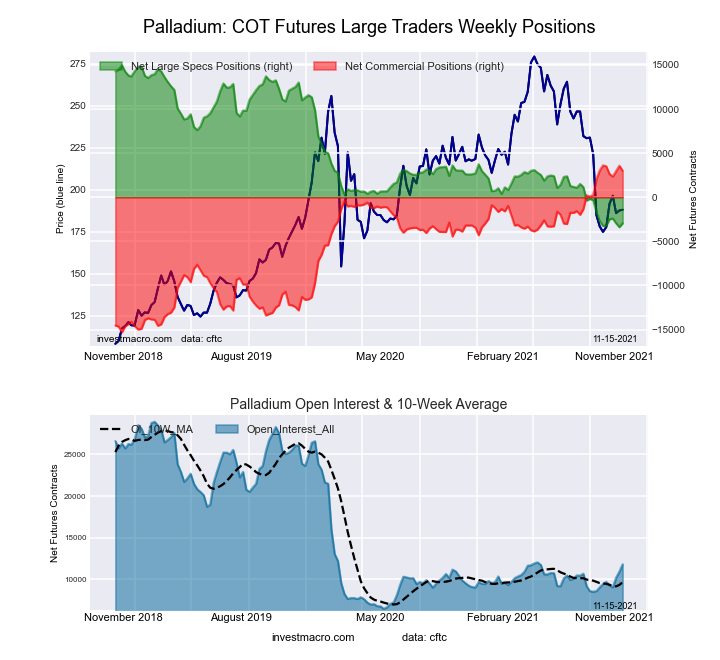
The latest COT data is updated through Tuesday November 2nd 2021 and shows a quick view of how large traders (for-profit speculators and commercial entities) were positioned in the futures markets.

Highlighting this week’s COT Bonds data is the general rise in speculator positions among a few of the bond market symbols while other symbols fell sharply. This week has seen the 2-Year bond speculators boost their net positions by +49,210 contracts while the Ultra Long US Treasury bond bets increased by 38,602 contracts and the Long US Treasury bond positions gained by 34,447 contracts this week. These were the second, third and fourth highest weekly changes for speculator positions this week. On the other side of the leaders were the Fed Funds, 5-Year, 10-Year and the Eurodollar markets which registered as the symbols with the largest speculator net decreases on the week.


Data Snapshot of Bond Market Traders | Columns Legend
Nov-02-2021OIOI-IndexSpec-NetSpec-IndexCom-NetCOM-IndexSmalls-NetSmalls-Index
Eurodollar12,358,98662-993,373311,355,37164-361,99856
FedFunds1,160,97114-62,4683274,23469-11,76640
2-Year2,052,53311-63,10878116,26340-53,1550
Long T-Bond1,158,74942-32,5478248,44336-15,89640
10-Year3,973,98863-268,66931606,611100-337,9420
5-Year3,568,73224-376,35329606,64794-230,2948


3-Month Eurodollars Futures:

Eurodollar Bonds Futures COT ChartThe 3-Month Eurodollars large speculator standing this week resulted in a net position of -993,373 contracts in the data reported through Tuesday. This was a weekly reduction of -268,380 contracts from the previous week which had a total of -724,993 net contracts.

This week’s current strength score (the trader positioning range over the past three years, measured from 0 to 100) shows the speculators are currently Bearish with a score of 31.2 percent. The commercials are Bullish with a score of 64.3 percent and the small traders (not shown in chart) are Bullish with a score of 55.9 percent.

3-Month Eurodollars StatisticsSPECULATORSCOMMERCIALSSMALL TRADERS
– Percent of Open Interest Longs:12.666.14.3
– Percent of Open Interest Shorts:20.755.27.2
– Net Position:-993,3731,355,371-361,998
– Gross Longs:1,561,0618,174,708530,581
– Gross Shorts:2,554,4346,819,337892,579
– Long to Short Ratio:0.6 to 11.2 to 10.6 to 1
NET POSITION TREND:
– COT Index Score (3 Year Range Pct):31.264.355.9
– COT Index Reading (3 Year Range):BearishBullishBullish
NET POSITION MOVEMENT INDEX:
– 6-Week Change in Strength Index:-4.17.8-30.5


30-Day Federal Funds Futures:

Federal Funds 30-Day Bonds Futures COT ChartThe 30-Day Federal Funds large speculator standing this week resulted in a net position of -62,468 contracts in the data reported through Tuesday. This was a weekly lowering of -17,877 contracts from the previous week which had a total of -44,591 net contracts.

This week’s current strength score (the trader positioning range over the past three years, measured from 0 to 100) shows the speculators are currently Bearish with a score of 31.9 percent. The commercials are Bullish with a score of 68.9 percent and the small traders (not shown in chart) are Bearish with a score of 39.9 percent.

30-Day Federal Funds StatisticsSPECULATORSCOMMERCIALSSMALL TRADERS
– Percent of Open Interest Longs:4.480.72.0
– Percent of Open Interest Shorts:9.774.33.0
– Net Position:-62,46874,234-11,766
– Gross Longs:50,587937,37923,576
– Gross Shorts:113,055863,14535,342
– Long to Short Ratio:0.4 to 11.1 to 10.7 to 1
NET POSITION TREND:
– COT Index Score (3 Year Range Pct):31.968.939.9
– COT Index Reading (3 Year Range):BearishBullishBearish
NET POSITION MOVEMENT INDEX:
– 6-Week Change in Strength Index:2.9-2.6-4.4


2-Year Treasury Note Futures:

2-Year Treasury Bonds Futures COT ChartThe 2-Year Treasury Note large speculator standing this week resulted in a net position of -63,108 contracts in the data reported through Tuesday. This was a weekly lift of 49,210 contracts from the previous week which had a total of -112,318 net contracts.

This week’s current strength score (the trader positioning range over the past three years, measured from 0 to 100) shows the speculators are currently Bullish with a score of 78.4 percent. The commercials are Bearish with a score of 39.8 percent and the small traders (not shown in chart) are Bearish-Extreme with a score of 0.0 percent.

2-Year Treasury Note StatisticsSPECULATORSCOMMERCIALSSMALL TRADERS
– Percent of Open Interest Longs:16.074.16.2
– Percent of Open Interest Shorts:19.168.58.8
– Net Position:-63,108116,263-53,155
– Gross Longs:329,1431,521,704127,629
– Gross Shorts:392,2511,405,441180,784
– Long to Short Ratio:0.8 to 11.1 to 10.7 to 1
NET POSITION TREND:
– COT Index Score (3 Year Range Pct):78.439.80.0
– COT Index Reading (3 Year Range):BullishBearishBearish-Extreme
NET POSITION MOVEMENT INDEX:
– 6-Week Change in Strength Index:-7.219.9-40.2


5-Year Treasury Note Futures:

5-Year Treasury Bonds Futures COT ChartThe 5-Year Treasury Note large speculator standing this week resulted in a net position of -376,353 contracts in the data reported through Tuesday. This was a weekly lowering of -34,878 contracts from the previous week which had a total of -341,475 net contracts.

This week’s current strength score (the trader positioning range over the past three years, measured from 0 to 100) shows the speculators are currently Bearish with a score of 29.2 percent. The commercials are Bullish-Extreme with a score of 94.2 percent and the small traders (not shown in chart) are Bearish-Extreme with a score of 7.7 percent.

5-Year Treasury Note StatisticsSPECULATORSCOMMERCIALSSMALL TRADERS
– Percent of Open Interest Longs:8.980.77.4
– Percent of Open Interest Shorts:19.463.713.8
– Net Position:-376,353606,647-230,294
– Gross Longs:317,6892,880,804263,908
– Gross Shorts:694,0422,274,157494,202
– Long to Short Ratio:0.5 to 11.3 to 10.5 to 1
NET POSITION TREND:
– COT Index Score (3 Year Range Pct):29.294.27.7
– COT Index Reading (3 Year Range):BearishBullish-ExtremeBearish-Extreme
NET POSITION MOVEMENT INDEX:
– 6-Week Change in Strength Index:-34.442.2-28.3


10-Year Treasury Note Futures:

10-Year Treasury Notes Bonds Futures COT ChartThe 10-Year Treasury Note large speculator standing this week resulted in a net position of -268,669 contracts in the data reported through Tuesday. This was a weekly decrease of -153,824 contracts from the previous week which had a total of -114,845 net contracts.

This week’s current strength score (the trader positioning range over the past three years, measured from 0 to 100) shows the speculators are currently Bearish with a score of 30.7 percent. The commercials are Bullish-Extreme with a score of 100.0 percent and the small traders (not shown in chart) are Bearish-Extreme with a score of 0.0 percent.

10-Year Treasury Note StatisticsSPECULATORSCOMMERCIALSSMALL TRADERS
– Percent of Open Interest Longs:12.576.87.4
– Percent of Open Interest Shorts:19.261.615.9
– Net Position:-268,669606,611-337,942
– Gross Longs:496,1373,052,628294,092
– Gross Shorts:764,8062,446,017632,034
– Long to Short Ratio:0.6 to 11.2 to 10.5 to 1
NET POSITION TREND:
– COT Index Score (3 Year Range Pct):30.7100.00.0
– COT Index Reading (3 Year Range):BearishBullish-ExtremeBearish-Extreme
NET POSITION MOVEMENT INDEX:
– 6-Week Change in Strength Index:-50.855.4-25.2


Ultra 10-Year Notes Futures:

Ultra 10-Year Treasury Notes Bonds Futures COT ChartThe Ultra 10-Year Notes large speculator standing this week resulted in a net position of 153,483 contracts in the data reported through Tuesday. This was a weekly fall of -3,271 contracts from the previous week which had a total of 156,754 net contracts.

This week’s current strength score (the trader positioning range over the past three years, measured from 0 to 100) shows the speculators are currently Bullish with a score of 68.3 percent. The commercials are Bullish with a score of 50.8 percent and the small traders (not shown in chart) are Bearish-Extreme with a score of 2.4 percent.

Ultra 10-Year Notes StatisticsSPECULATORSCOMMERCIALSSMALL TRADERS
– Percent of Open Interest Longs:20.671.96.8
– Percent of Open Interest Shorts:10.970.518.0
– Net Position:153,48323,194-176,677
– Gross Longs:325,1041,136,251107,890
– Gross Shorts:171,6211,113,057284,567
– Long to Short Ratio:1.9 to 11.0 to 10.4 to 1
NET POSITION TREND:
– COT Index Score (3 Year Range Pct):68.350.82.4
– COT Index Reading (3 Year Range):BullishBullishBearish-Extreme
NET POSITION MOVEMENT INDEX:
– 6-Week Change in Strength Index:17.8-11.8-16.2


US Treasury Bonds Futures:

US Year Treasury Notes Long Bonds Futures COT ChartThe US Treasury Bonds large speculator standing this week resulted in a net position of -32,547 contracts in the data reported through Tuesday. This was a weekly increase of 34,447 contracts from the previous week which had a total of -66,994 net contracts.

This week’s current strength score (the trader positioning range over the past three years, measured from 0 to 100) shows the speculators are currently Bullish-Extreme with a score of 81.7 percent. The commercials are Bearish with a score of 35.6 percent and the small traders (not shown in chart) are Bearish with a score of 40.0 percent.

US Treasury Bonds StatisticsSPECULATORSCOMMERCIALSSMALL TRADERS
– Percent of Open Interest Longs:10.573.614.5
– Percent of Open Interest Shorts:13.369.415.9
– Net Position:-32,54748,443-15,896
– Gross Longs:121,529852,718168,279
– Gross Shorts:154,076804,275184,175
– Long to Short Ratio:0.8 to 11.1 to 10.9 to 1
NET POSITION TREND:
– COT Index Score (3 Year Range Pct):81.735.640.0
– COT Index Reading (3 Year Range):Bullish-ExtremeBearishBearish
NET POSITION MOVEMENT INDEX:
– 6-Week Change in Strength Index:20.0-8.9-22.0


Ultra US Treasury Bonds Futures:

Ultra US Year Treasury Notes Long Bonds Futures COT ChartThe Ultra US Treasury Bonds large speculator standing this week resulted in a net position of -292,611 contracts in the data reported through Tuesday. This was a weekly boost of 38,602 contracts from the previous week which had a total of -331,213 net contracts.

This week’s current strength score (the trader positioning range over the past three years, measured from 0 to 100) shows the speculators are currently Bullish with a score of 65.8 percent. The commercials are Bullish with a score of 53.6 percent and the small traders (not shown in chart) are Bearish with a score of 35.0 percent.

Ultra US Treasury Bonds StatisticsSPECULATORSCOMMERCIALSSMALL TRADERS
– Percent of Open Interest Longs:3.982.512.7
– Percent of Open Interest Shorts:28.059.212.0
– Net Position:-292,611283,2509,361
– Gross Longs:47,1321,001,156154,604
– Gross Shorts:339,743717,906145,243
– Long to Short Ratio:0.1 to 11.4 to 11.1 to 1
NET POSITION TREND:
– COT Index Score (3 Year Range Pct):65.853.635.0
– COT Index Reading (3 Year Range):BullishBullishBearish
NET POSITION MOVEMENT INDEX:
– 6-Week Change in Strength Index:0.93.1-6.1


Article By InvestMacroReceive our weekly COT Reports by Email

*COT Report: The COT data, released weekly to the public each Friday, is updated through the most recent Tuesday (data is 3 days old) and shows a quick view of how large speculators or non-commercials (for-profit traders) were positioned in the futures markets.

The CFTC categorizes trader positions according to commercial hedgers (traders who use futures contracts for hedging as part of the business), non-commercials (large traders who speculate to realize trading profits) and nonreportable traders (usually small traders/speculators) as well as their open interest (contracts open in the market at time of reporting).See CFTC criteria here.