
By InvestMacro | COT | Data Tables | COT Leaders | Downloads | COT Newsletter
Here are the latest charts and statistics for the Commitment of Traders (COT) data published by the Commodities Futures Trading Commission (CFTC). This week’s reports are delayed due to last week’s Veteran’s Day holiday.
The latest COT data is updated through Tuesday November 9th 2021 and shows a quick view of how large traders (for-profit speculators and commercial entities) were positioned in the futures markets.
Highlighting the latest COT Energy data is the rising position of the Brent Oil (Last Day) bets. Brent speculative positions have been steadily improving in the past two months and have now gained for six consecutive weeks. The speculative positions for Brent historically are usually bearish and the net position has continually remained in a bearish overall standing since 2013. The speculator betting is currently trending closer to the neutral zone with the net position at just -11,851 contracts. This latest standing for Brent crude bets puts the positioning at their best level of the past 159 weeks, dating all the way back to October 30th of 2018.
| Nov-09-2021 | OI | OI-Index | Spec-Net | Spec-Index | Com-Net | COM-Index | Smalls-Net | Smalls-Index |
|---|---|---|---|---|---|---|---|---|
| WTI Crude | 2,081,385 | 22 | 421,312 | 46 | -461,964 | 44 | 40,652 | 72 |
| Gold | 571,025 | 43 | 250,181 | 71 | -275,489 | 30 | 25,308 | 42 |
| Silver | 144,370 | 11 | 36,915 | 59 | -53,669 | 46 | 16,754 | 38 |
| Copper | 213,365 | 36 | 22,789 | 59 | -33,194 | 37 | 10,405 | 85 |
| Palladium | 11,819 | 24 | -2,954 | 2 | 3,003 | 97 | -49 | 42 |
| Platinum | 57,866 | 18 | 17,630 | 28 | -24,263 | 74 | 6,633 | 55 |
| Natural Gas | 1,305,687 | 45 | -142,191 | 36 | 98,418 | 62 | 43,773 | 90 |
| Brent | 192,398 | 33 | -11,851 | 100 | 7,567 | 0 | 4,284 | 82 |
| Heating Oil | 421,299 | 61 | 20,022 | 72 | -42,921 | 26 | 22,899 | 78 |
| Soybeans | 644,317 | 9 | 27,584 | 37 | 9,085 | 68 | -36,669 | 11 |
| Corn | 1,540,731 | 28 | 375,298 | 78 | -320,877 | 26 | -54,421 | 12 |
| Coffee | 312,143 | 67 | 60,820 | 93 | -65,365 | 9 | 4,545 | 20 |
| Sugar | 897,739 | 22 | 212,031 | 80 | -260,761 | 19 | 48,730 | 68 |
| Wheat | 405,438 | 37 | 19,203 | 63 | -13,409 | 28 | -5,794 | 74 |
WTI Crude Oil Futures:
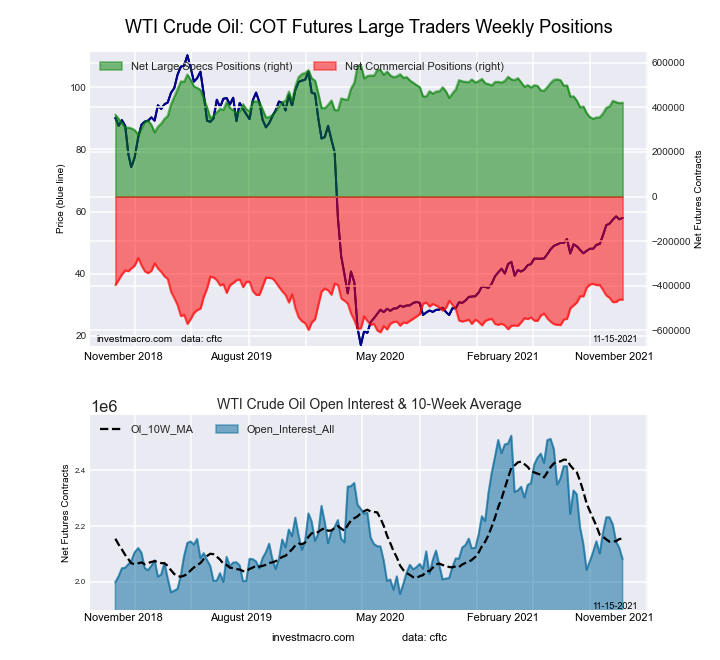 The WTI Crude Oil Futures large speculator standing this week equaled a net position of 421,312 contracts in the data reported through Tuesday. This was a weekly rise of 2,019 contracts from the previous week which had a total of 419,293 net contracts.
Free Reports:
 Get our Weekly Commitment of Traders Reports - See where the biggest traders (Hedge Funds and Commercial Hedgers) are positioned in the futures markets on a weekly basis.
 Download Our Metatrader 4 Indicators – Put Our Free MetaTrader 4 Custom Indicators on your charts when you join our Weekly Newsletter
This week’s current strength score (the trader positioning range over the past three years, measured from 0 to 100) shows the speculators are currently Bearish with a score of 46.2 percent. The commercials are Bearish with a score of 44.0 percent and the small traders (not shown in chart) are Bullish with a score of 72.3 percent.
| WTI Crude Oil Futures Statistics | SPECULATORS | COMMERCIALS | SMALL TRADERS |
| – Percent of Open Interest Longs: | 26.5 | 33.9 | 4.6 |
| – Percent of Open Interest Shorts: | 6.3 | 56.1 | 2.6 |
| – Net Position: | 421,312 | -461,964 | 40,652 |
| – Gross Longs: | 552,579 | 705,286 | 95,755 |
| – Gross Shorts: | 131,267 | 1,167,250 | 55,103 |
| – Long to Short Ratio: | 4.2 to 1 | 0.6 to 1 | 1.7 to 1 |
| NET POSITION TREND: | |||
| – COT Index Score (3 Year Range Pct): | 46.2 | 44.0 | 72.3 |
| – COT Index Reading (3 Year Range): | Bearish | Bearish | Bullish |
| NET POSITION MOVEMENT INDEX: | |||
| – 6-Week Change in Strength Index: | 15.2 | -12.9 | -6.2 |
Brent Crude Oil Futures:
 The Brent Crude Oil Futures large speculator standing this week equaled a net position of -11,851 contracts in the data reported through Tuesday. This was a weekly gain of 863 contracts from the previous week which had a total of -12,714 net contracts.
This week’s current strength score (the trader positioning range over the past three years, measured from 0 to 100) shows the speculators are currently Bullish-Extreme with a score of 100.0 percent. The commercials are Bearish-Extreme with a score of 0.0 percent and the small traders (not shown in chart) are Bullish-Extreme with a score of 82.2 percent.
| Brent Crude Oil Futures Statistics | SPECULATORS | COMMERCIALS | SMALL TRADERS |
| – Percent of Open Interest Longs: | 24.9 | 39.4 | 3.9 |
| – Percent of Open Interest Shorts: | 31.1 | 35.5 | 1.7 |
| – Net Position: | -11,851 | 7,567 | 4,284 |
| – Gross Longs: | 47,922 | 75,867 | 7,540 |
| – Gross Shorts: | 59,773 | 68,300 | 3,256 |
| – Long to Short Ratio: | 0.8 to 1 | 1.1 to 1 | 2.3 to 1 |
| NET POSITION TREND: | |||
| – COT Index Score (3 Year Range Pct): | 100.0 | 0.0 | 82.2 |
| – COT Index Reading (3 Year Range): | Bullish-Extreme | Bearish-Extreme | Bullish-Extreme |
| NET POSITION MOVEMENT INDEX: | |||
| – 6-Week Change in Strength Index: | 54.3 | -51.7 | -2.4 |
Natural Gas Futures:
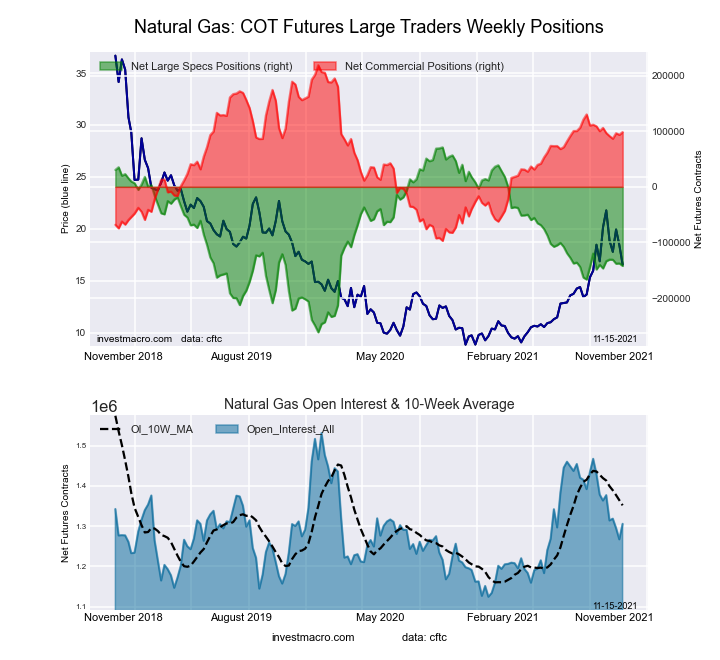 The Natural Gas Futures large speculator standing this week equaled a net position of -142,191 contracts in the data reported through Tuesday. This was a weekly decrease of -4,478 contracts from the previous week which had a total of -137,713 net contracts.
This week’s current strength score (the trader positioning range over the past three years, measured from 0 to 100) shows the speculators are currently Bearish with a score of 35.9 percent. The commercials are Bullish with a score of 61.9 percent and the small traders (not shown in chart) are Bullish-Extreme with a score of 89.8 percent.
| Natural Gas Futures Statistics | SPECULATORS | COMMERCIALS | SMALL TRADERS |
| – Percent of Open Interest Longs: | 19.4 | 43.4 | 5.2 |
| – Percent of Open Interest Shorts: | 30.3 | 35.9 | 1.9 |
| – Net Position: | -142,191 | 98,418 | 43,773 |
| – Gross Longs: | 253,588 | 566,746 | 67,961 |
| – Gross Shorts: | 395,779 | 468,328 | 24,188 |
| – Long to Short Ratio: | 0.6 to 1 | 1.2 to 1 | 2.8 to 1 |
| NET POSITION TREND: | |||
| – COT Index Score (3 Year Range Pct): | 35.9 | 61.9 | 89.8 |
| – COT Index Reading (3 Year Range): | Bearish | Bullish | Bullish-Extreme |
| NET POSITION MOVEMENT INDEX: | |||
| – 6-Week Change in Strength Index: | 1.4 | -2.4 | 7.7 |
Gasoline Blendstock Futures:
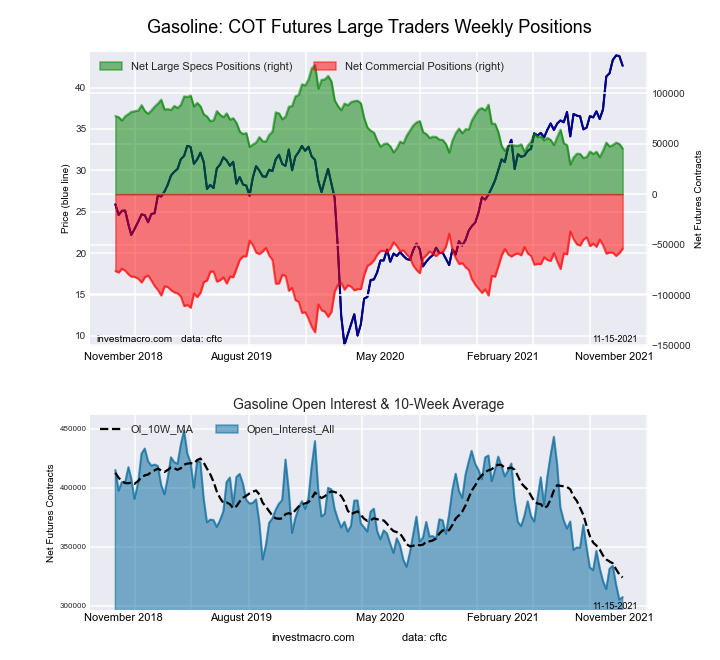 The Gasoline Blendstock Futures large speculator standing this week equaled a net position of 45,069 contracts in the data reported through Tuesday. This was a weekly reduction of -4,628 contracts from the previous week which had a total of 49,697 net contracts.
This week’s current strength score (the trader positioning range over the past three years, measured from 0 to 100) shows the speculators are currently Bearish-Extreme with a score of 16.0 percent. The commercials are Bullish-Extreme with a score of 83.1 percent and the small traders (not shown in chart) are Bullish with a score of 64.3 percent.
| Nasdaq Mini Futures Statistics | SPECULATORS | COMMERCIALS | SMALL TRADERS |
| – Percent of Open Interest Longs: | 32.6 | 45.9 | 7.3 |
| – Percent of Open Interest Shorts: | 17.9 | 63.4 | 4.4 |
| – Net Position: | 45,069 | -53,896 | 8,827 |
| – Gross Longs: | 100,218 | 141,151 | 22,325 |
| – Gross Shorts: | 55,149 | 195,047 | 13,498 |
| – Long to Short Ratio: | 1.8 to 1 | 0.7 to 1 | 1.7 to 1 |
| NET POSITION TREND: | |||
| – COT Index Score (3 Year Range Pct): | 16.0 | 83.1 | 64.3 |
| – COT Index Reading (3 Year Range): | Bearish-Extreme | Bullish-Extreme | Bullish |
| NET POSITION MOVEMENT INDEX: | |||
| – 6-Week Change in Strength Index: | 1.9 | -3.2 | 7.9 |
#2 Heating Oil NY-Harbor Futures:
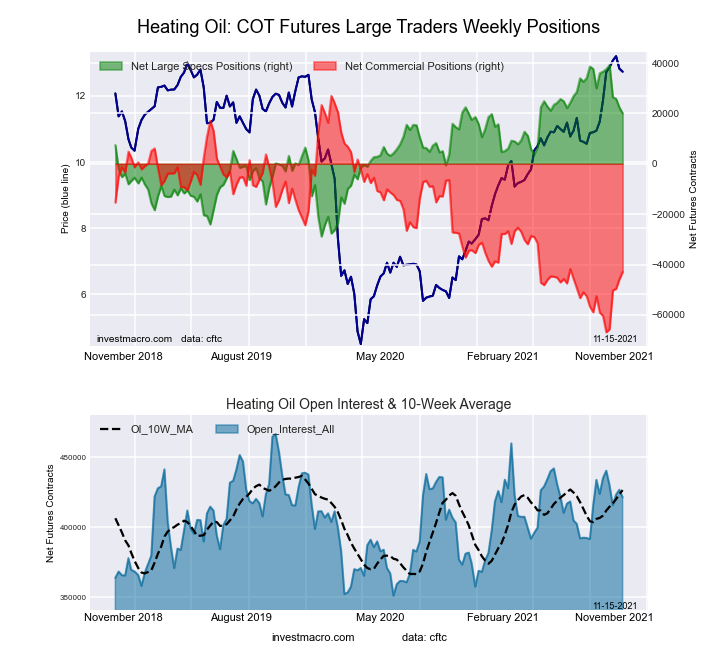 The #2 Heating Oil NY-Harbor Futures large speculator standing this week equaled a net position of 20,022 contracts in the data reported through Tuesday. This was a weekly decline of -2,362 contracts from the previous week which had a total of 22,384 net contracts.
This week’s current strength score (the trader positioning range over the past three years, measured from 0 to 100) shows the speculators are currently Bullish with a score of 71.9 percent. The commercials are Bearish with a score of 25.5 percent and the small traders (not shown in chart) are Bullish with a score of 77.7 percent.
| Heating Oil Futures Statistics | SPECULATORS | COMMERCIALS | SMALL TRADERS |
| – Percent of Open Interest Longs: | 12.9 | 54.5 | 11.1 |
| – Percent of Open Interest Shorts: | 8.1 | 64.7 | 5.7 |
| – Net Position: | 20,022 | -42,921 | 22,899 |
| – Gross Longs: | 54,200 | 229,756 | 46,970 |
| – Gross Shorts: | 34,178 | 272,677 | 24,071 |
| – Long to Short Ratio: | 1.6 to 1 | 0.8 to 1 | 2.0 to 1 |
| NET POSITION TREND: | |||
| – COT Index Score (3 Year Range Pct): | 71.9 | 25.5 | 77.7 |
| – COT Index Reading (3 Year Range): | Bullish | Bearish | Bullish |
| NET POSITION MOVEMENT INDEX: | |||
| – 6-Week Change in Strength Index: | -24.4 | 18.6 | -3.0 |
Bloomberg Commodity Index Futures:
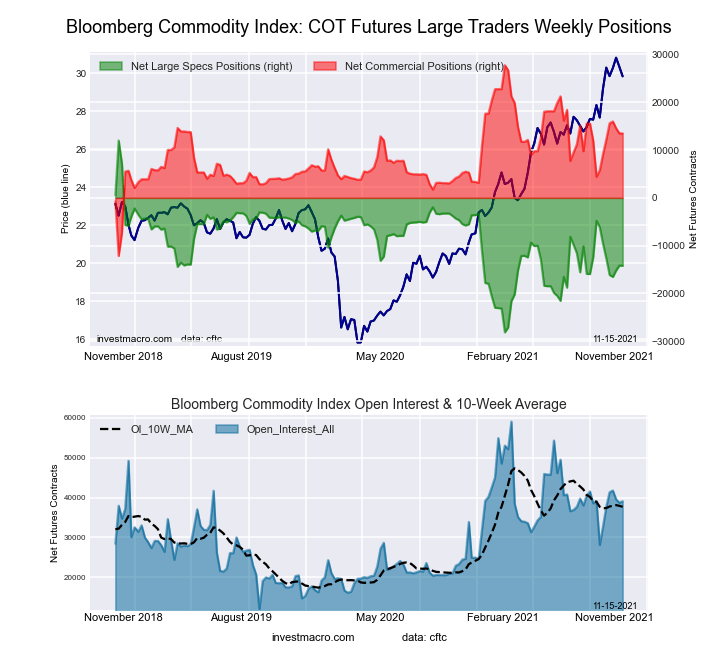 The Bloomberg Commodity Index Futures large speculator standing this week equaled a net position of -14,191 contracts in the data reported through Tuesday. This was a weekly decrease of -45 contracts from the previous week which had a total of -14,146 net contracts.
This week’s current strength score (the trader positioning range over the past three years, measured from 0 to 100) shows the speculators are currently Bearish with a score of 34.7 percent. The commercials are Bullish with a score of 64.3 percent and the small traders (not shown in chart) are Bullish with a score of 55.1 percent.
| Bloomberg Index Futures Statistics | SPECULATORS | COMMERCIALS | SMALL TRADERS |
| – Percent of Open Interest Longs: | 53.8 | 39.7 | 2.0 |
| – Percent of Open Interest Shorts: | 90.1 | 5.2 | 0.2 |
| – Net Position: | -14,191 | 13,490 | 701 |
| – Gross Longs: | 21,027 | 15,506 | 769 |
| – Gross Shorts: | 35,218 | 2,016 | 68 |
| – Long to Short Ratio: | 0.6 to 1 | 7.7 to 1 | 11.3 to 1 |
| NET POSITION TREND: | |||
| – COT Index Score (3 Year Range Pct): | 34.7 | 64.3 | 55.1 |
| – COT Index Reading (3 Year Range): | Bearish | Bullish | Bullish |
| NET POSITION MOVEMENT INDEX: | |||
| – 6-Week Change in Strength Index: | -11.4 | 10.8 | 11.5 |
Article By InvestMacro – Receive our weekly COT Reports by Email
*COT Report: The COT data, released weekly to the public each Friday, is updated through the most recent Tuesday (data is 3 days old) and shows a quick view of how large speculators or non-commercials (for-profit traders) were positioned in the futures markets.
The CFTC categorizes trader positions according to commercial hedgers (traders who use futures contracts for hedging as part of the business), non-commercials (large traders who speculate to realize trading profits) and nonreportable traders (usually small traders/speculators) as well as their open interest (contracts open in the market at time of reporting).See CFTC criteria here.

- Oil prices jumped 4% amid a new wave of escalation between the US and Iran Jul 13, 2026
- EUR/USD: US Inflation Will Determine Everything Jul 13, 2026
- COT Metals Charts: Weekly Speculator Bets see small gains for Silver & Gold Jul 12, 2026
- COT Bonds Charts: Speculator Bets led by SOFR 3-Months & 2-Year Bonds Jul 12, 2026
- COT Energy Charts: Weekly Speculator Changes led by Brent Oil Jul 12, 2026
- COT Soft Commodities Charts: Weekly Speculator Changes led by Sugar, Corn & Soybeans Jul 12, 2026
- The US and European stock indices are rising again amid renewed investor interest in the AI industry. Jul 10, 2026
- USD/JPY Falls as Yen Recovers Weekly Losses Jul 10, 2026
- Crude oil prices surged sharply by 7% in reaction to the rapid escalation of the conflict in the Middle East Jul 9, 2026
- Middle East Tensions Weigh on Gold Jul 9, 2026