
By InvestMacro | COT | Data Tables | COT Leaders | Downloads | COT Newsletter
Here are the latest charts and statistics for the Commitment of Traders (COT) data published by the Commodities Futures Trading Commission (CFTC).
The latest COT data is updated through Tuesday November 2nd 2021 and shows a quick view of how large traders (for-profit speculators and commercial entities) were positioned in the futures markets. All currency positions are in direct relation to the US dollar where, for example, a bet for the euro is a bet that the euro will rise versus the dollar while a bet against the euro will be a bet that the euro will decline versus the dollar.
Highlighting this week’s COT Currency data is the speculator’s boost of their New Zealand dollar bets. Speculator net positions for the NZD increased for a second consecutive week this week and for the seventh time out of the past nine weeks (9-week total of +16,002 contracts). This recent bullishness has brought the net speculator positions to over +13,000 contracts which is the highest level in the past thirty-four weeks, dating back to March 9th. NZD positions had been in negative or bearish territory as recently as August 31st before this recent bullishness propelled them higher.
| Nov-02-2021 | OI | OI-Index | Spec-Net | Spec-Index | Com-Net | COM-Index | Smalls-Net | Smalls-Index |
|---|---|---|---|---|---|---|---|---|
| USD Index | 57,947 | 85 | 34,982 | 86 | -42,053 | 5 | 7,071 | 94 |
| EUR | 678,024 | 75 | -6,138 | 33 | -22,728 | 69 | 28,866 | 26 |
| GBP | 166,780 | 18 | 15,047 | 85 | -11,732 | 23 | -3,315 | 49 |
| JPY | 251,058 | 89 | -107,624 | 1 | 126,005 | 99 | -18,381 | 12 |
| CHF | 51,613 | 30 | -20,648 | 34 | 25,497 | 60 | -4,849 | 49 |
| CAD | 156,194 | 34 | 4,162 | 58 | -27,441 | 34 | 23,279 | 82 |
| AUD | 162,888 | 54 | -75,496 | 14 | 73,970 | 74 | 1,526 | 56 |
| NZD | 45,436 | 35 | 13,861 | 95 | -16,625 | 5 | 2,764 | 83 |
| MXN | 167,676 | 32 | -51,018 | 0 | 48,795 | 100 | 2,223 | 52 |
| RUB | 61,601 | 73 | 19,982 | 61 | -21,882 | 35 | 1,900 | 86 |
| BRL | 31,674 | 33 | -14,272 | 50 | 14,357 | 53 | -85 | 66 |
| Bitcoin | 13,512 | 77 | -1,612 | 66 | 421 | 0 | 1,191 | 25 |
US Dollar Index Futures:
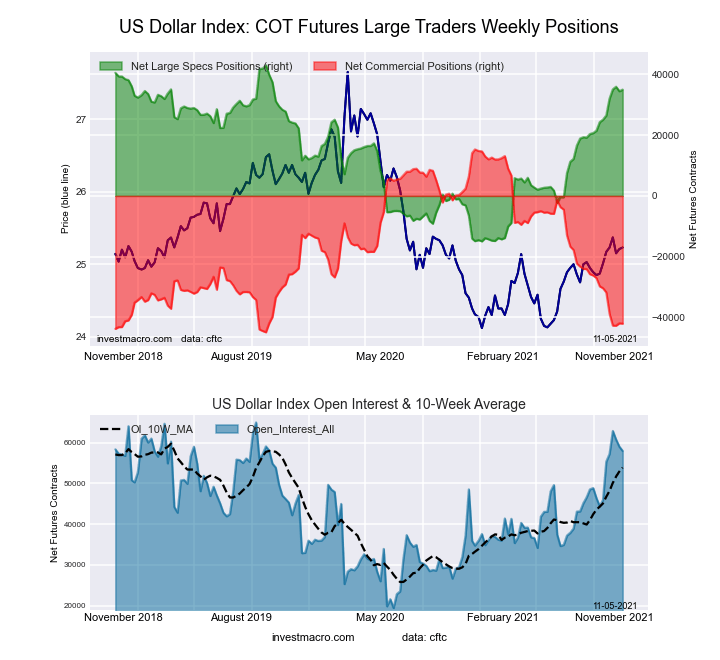 The US Dollar Index large speculator standing this week totaled a net position of 34,982 contracts in the data reported through Tuesday. This was a weekly advance of 525 contracts from the previous week which had a total of 34,457 net contracts.
Free Reports:
 Get our Weekly Commitment of Traders Reports - See where the biggest traders (Hedge Funds and Commercial Hedgers) are positioned in the futures markets on a weekly basis.
 Download Our Metatrader 4 Indicators – Put Our Free MetaTrader 4 Custom Indicators on your charts when you join our Weekly Newsletter
This week’s current strength score (the trader positioning range over the past three years, measured from 0 to 100) shows the speculators are currently Bullish-Extreme with a score of 86.1 percent. The commercials are Bearish-Extreme with a score of 4.7 percent and the small traders (not shown in chart) are Bullish-Extreme with a score of 93.9 percent.
| US DOLLAR INDEX Statistics | SPECULATORS | COMMERCIALS | SMALL TRADERS |
| – Percent of Open Interest Longs: | 78.3 | 3.3 | 15.2 |
| – Percent of Open Interest Shorts: | 18.0 | 75.9 | 3.0 |
| – Net Position: | 34,982 | -42,053 | 7,071 |
| – Gross Longs: | 45,395 | 1,911 | 8,799 |
| – Gross Shorts: | 10,413 | 43,964 | 1,728 |
| – Long to Short Ratio: | 4.4 to 1 | 0.0 to 1 | 5.1 to 1 |
| NET POSITION TREND: | |||
| – COT Index Score (3 Year Range Pct): | 86.1 | 4.7 | 93.9 |
| – COT Index Reading (3 Year Range): | Bullish-Extreme | Bearish-Extreme | Bullish-Extreme |
| NET POSITION MOVEMENT INDEX: | |||
| – 6-Week Change in Strength Index: | 17.0 | -19.4 | 19.4 |
Euro Currency Futures:
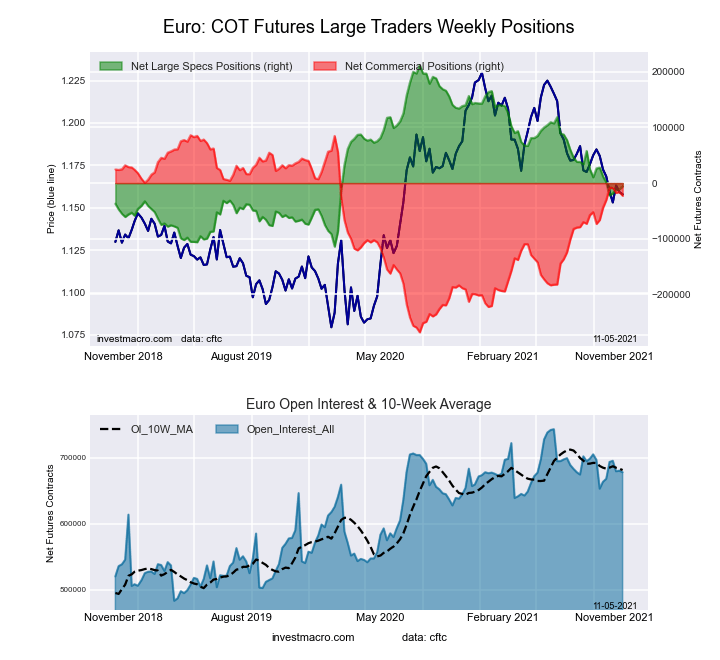 The Euro Currency large speculator standing this week totaled a net position of -6,138 contracts in the data reported through Tuesday. This was a weekly advance of 5,118 contracts from the previous week which had a total of -11,256 net contracts.
This week’s current strength score (the trader positioning range over the past three years, measured from 0 to 100) shows the speculators are currently Bearish with a score of 33.1 percent. The commercials are Bullish with a score of 69.3 percent and the small traders (not shown in chart) are Bearish with a score of 25.7 percent.
| EURO Currency Statistics | SPECULATORS | COMMERCIALS | SMALL TRADERS |
| – Percent of Open Interest Longs: | 28.2 | 57.9 | 12.4 |
| – Percent of Open Interest Shorts: | 29.1 | 61.3 | 8.2 |
| – Net Position: | -6,138 | -22,728 | 28,866 |
| – Gross Longs: | 191,496 | 392,882 | 84,160 |
| – Gross Shorts: | 197,634 | 415,610 | 55,294 |
| – Long to Short Ratio: | 1.0 to 1 | 0.9 to 1 | 1.5 to 1 |
| NET POSITION TREND: | |||
| – COT Index Score (3 Year Range Pct): | 33.1 | 69.3 | 25.7 |
| – COT Index Reading (3 Year Range): | Bearish | Bullish | Bearish |
| NET POSITION MOVEMENT INDEX: | |||
| – 6-Week Change in Strength Index: | -5.6 | 6.1 | -5.2 |
British Pound Sterling Futures:
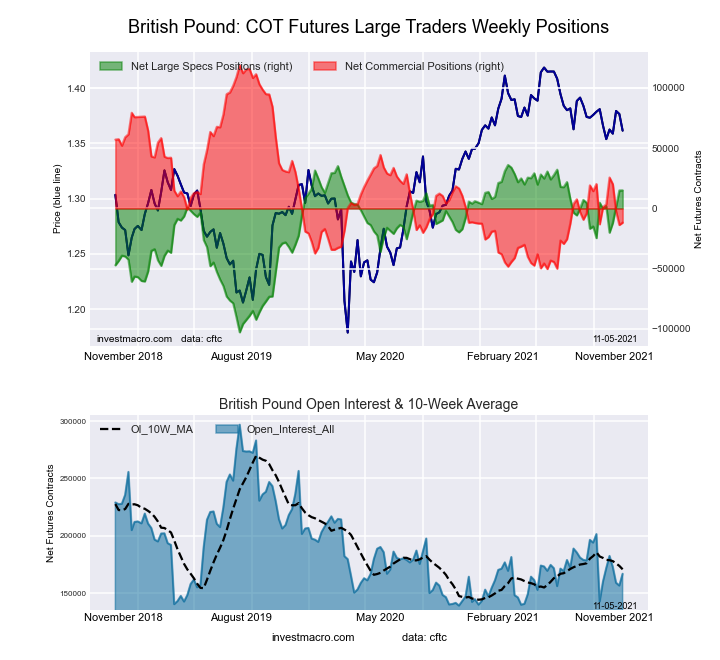 The British Pound Sterling large speculator standing this week totaled a net position of 15,047 contracts in the data reported through Tuesday. This was a weekly boost of 94 contracts from the previous week which had a total of 14,953 net contracts.
This week’s current strength score (the trader positioning range over the past three years, measured from 0 to 100) shows the speculators are currently Bullish-Extreme with a score of 84.8 percent. The commercials are Bearish with a score of 22.7 percent and the small traders (not shown in chart) are Bearish with a score of 48.8 percent.
| BRITISH POUND Statistics | SPECULATORS | COMMERCIALS | SMALL TRADERS |
| – Percent of Open Interest Longs: | 34.3 | 47.0 | 16.4 |
| – Percent of Open Interest Shorts: | 25.3 | 54.1 | 18.4 |
| – Net Position: | 15,047 | -11,732 | -3,315 |
| – Gross Longs: | 57,255 | 78,420 | 27,293 |
| – Gross Shorts: | 42,208 | 90,152 | 30,608 |
| – Long to Short Ratio: | 1.4 to 1 | 0.9 to 1 | 0.9 to 1 |
| NET POSITION TREND: | |||
| – COT Index Score (3 Year Range Pct): | 84.8 | 22.7 | 48.8 |
| – COT Index Reading (3 Year Range): | Bullish-Extreme | Bearish | Bearish |
| NET POSITION MOVEMENT INDEX: | |||
| – 6-Week Change in Strength Index: | 11.0 | -7.6 | -5.1 |
Japanese Yen Futures:
 The Japanese Yen large speculator standing this week totaled a net position of -107,624 contracts in the data reported through Tuesday. This was a weekly lowering of -588 contracts from the previous week which had a total of -107,036 net contracts.
This week’s current strength score (the trader positioning range over the past three years, measured from 0 to 100) shows the speculators are currently Bearish-Extreme with a score of 1.3 percent. The commercials are Bullish-Extreme with a score of 98.7 percent and the small traders (not shown in chart) are Bearish-Extreme with a score of 12.1 percent.
| JAPANESE YEN Statistics | SPECULATORS | COMMERCIALS | SMALL TRADERS |
| – Percent of Open Interest Longs: | 8.1 | 82.7 | 8.3 |
| – Percent of Open Interest Shorts: | 51.0 | 32.5 | 15.7 |
| – Net Position: | -107,624 | 126,005 | -18,381 |
| – Gross Longs: | 20,337 | 207,612 | 20,944 |
| – Gross Shorts: | 127,961 | 81,607 | 39,325 |
| – Long to Short Ratio: | 0.2 to 1 | 2.5 to 1 | 0.5 to 1 |
| NET POSITION TREND: | |||
| – COT Index Score (3 Year Range Pct): | 1.3 | 98.7 | 12.1 |
| – COT Index Reading (3 Year Range): | Bearish-Extreme | Bullish-Extreme | Bearish-Extreme |
| NET POSITION MOVEMENT INDEX: | |||
| – 6-Week Change in Strength Index: | -32.2 | 29.5 | -16.7 |
Swiss Franc Futures:
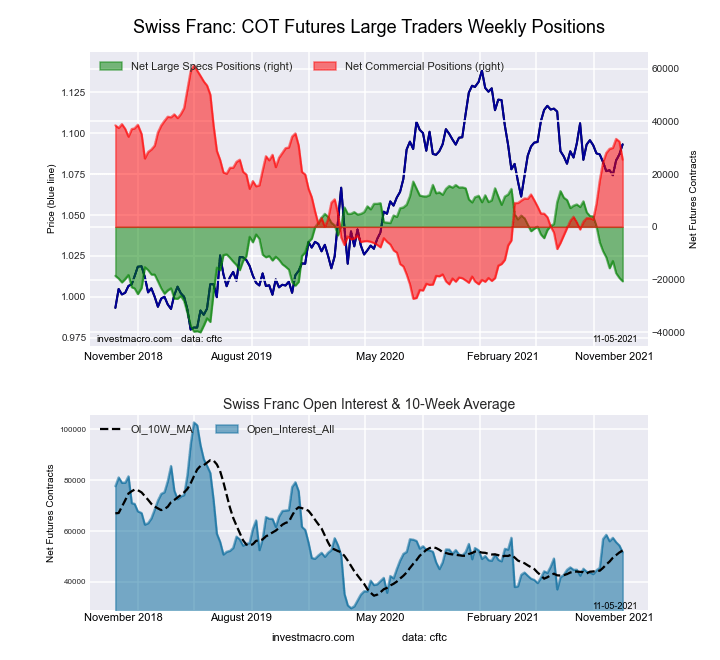 The Swiss Franc large speculator standing this week totaled a net position of -20,648 contracts in the data reported through Tuesday. This was a weekly lowering of -1,269 contracts from the previous week which had a total of -19,379 net contracts.
This week’s current strength score (the trader positioning range over the past three years, measured from 0 to 100) shows the speculators are currently Bearish with a score of 33.9 percent. The commercials are Bullish with a score of 59.6 percent and the small traders (not shown in chart) are Bearish with a score of 49.0 percent.
| SWISS FRANC Statistics | SPECULATORS | COMMERCIALS | SMALL TRADERS |
| – Percent of Open Interest Longs: | 2.8 | 70.6 | 26.1 |
| – Percent of Open Interest Shorts: | 42.8 | 21.2 | 35.5 |
| – Net Position: | -20,648 | 25,497 | -4,849 |
| – Gross Longs: | 1,439 | 36,456 | 13,485 |
| – Gross Shorts: | 22,087 | 10,959 | 18,334 |
| – Long to Short Ratio: | 0.1 to 1 | 3.3 to 1 | 0.7 to 1 |
| NET POSITION TREND: | |||
| – COT Index Score (3 Year Range Pct): | 33.9 | 59.6 | 49.0 |
| – COT Index Reading (3 Year Range): | Bearish | Bullish | Bearish |
| NET POSITION MOVEMENT INDEX: | |||
| – 6-Week Change in Strength Index: | -20.0 | 1.1 | 30.6 |
Canadian Dollar Futures:
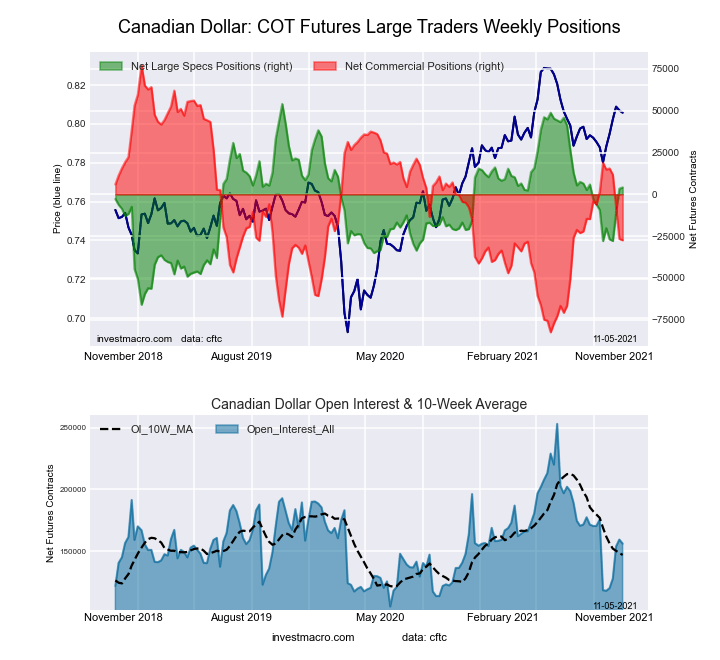 The Canadian Dollar large speculator standing this week totaled a net position of 4,162 contracts in the data reported through Tuesday. This was a weekly rise of 842 contracts from the previous week which had a total of 3,320 net contracts.
This week’s current strength score (the trader positioning range over the past three years, measured from 0 to 100) shows the speculators are currently Bullish with a score of 58.5 percent. The commercials are Bearish with a score of 34.5 percent and the small traders (not shown in chart) are Bullish-Extreme with a score of 81.9 percent.
| CANADIAN DOLLAR Statistics | SPECULATORS | COMMERCIALS | SMALL TRADERS |
| – Percent of Open Interest Longs: | 26.9 | 43.9 | 28.2 |
| – Percent of Open Interest Shorts: | 24.2 | 61.5 | 13.3 |
| – Net Position: | 4,162 | -27,441 | 23,279 |
| – Gross Longs: | 42,037 | 68,542 | 44,037 |
| – Gross Shorts: | 37,875 | 95,983 | 20,758 |
| – Long to Short Ratio: | 1.1 to 1 | 0.7 to 1 | 2.1 to 1 |
| NET POSITION TREND: | |||
| – COT Index Score (3 Year Range Pct): | 58.5 | 34.5 | 81.9 |
| – COT Index Reading (3 Year Range): | Bullish | Bearish | Bullish-Extreme |
| NET POSITION MOVEMENT INDEX: | |||
| – 6-Week Change in Strength Index: | 26.7 | -29.0 | 21.5 |
Australian Dollar Futures:
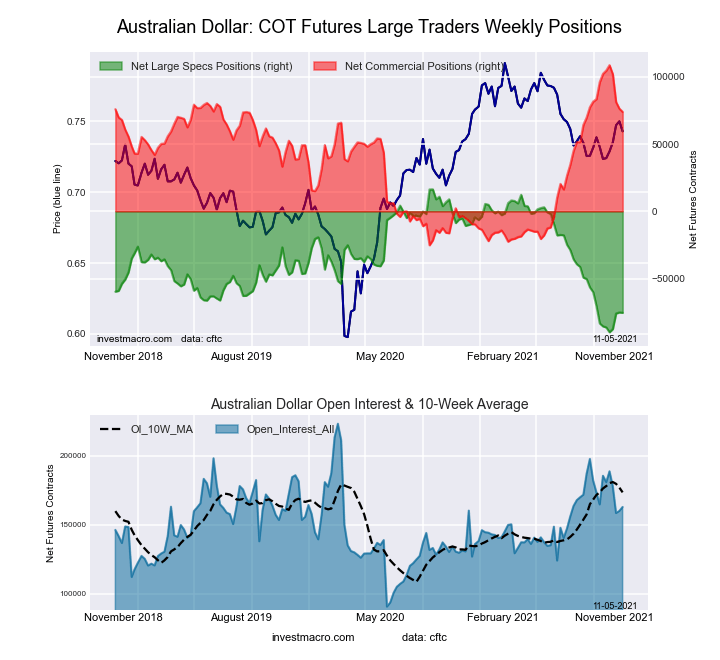 The Australian Dollar large speculator standing this week totaled a net position of -75,496 contracts in the data reported through Tuesday. This was a weekly reduction of -250 contracts from the previous week which had a total of -75,246 net contracts.
This week’s current strength score (the trader positioning range over the past three years, measured from 0 to 100) shows the speculators are currently Bearish-Extreme with a score of 13.6 percent. The commercials are Bullish with a score of 74.1 percent and the small traders (not shown in chart) are Bullish with a score of 56.2 percent.
| AUSTRALIAN DOLLAR Statistics | SPECULATORS | COMMERCIALS | SMALL TRADERS |
| – Percent of Open Interest Longs: | 11.8 | 71.5 | 15.8 |
| – Percent of Open Interest Shorts: | 58.1 | 26.1 | 14.9 |
| – Net Position: | -75,496 | 73,970 | 1,526 |
| – Gross Longs: | 19,187 | 116,464 | 25,749 |
| – Gross Shorts: | 94,683 | 42,494 | 24,223 |
| – Long to Short Ratio: | 0.2 to 1 | 2.7 to 1 | 1.1 to 1 |
| NET POSITION TREND: | |||
| – COT Index Score (3 Year Range Pct): | 13.6 | 74.1 | 56.2 |
| – COT Index Reading (3 Year Range): | Bearish-Extreme | Bullish | Bullish |
| NET POSITION MOVEMENT INDEX: | |||
| – 6-Week Change in Strength Index: | 9.5 | -21.2 | 44.5 |
New Zealand Dollar Futures:
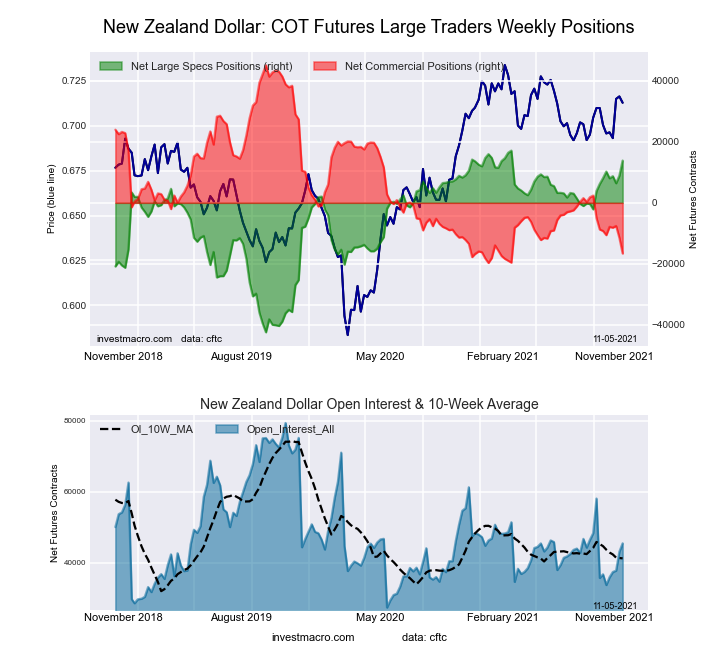 The New Zealand Dollar large speculator standing this week totaled a net position of 13,861 contracts in the data reported through Tuesday. This was a weekly gain of 4,955 contracts from the previous week which had a total of 8,906 net contracts.
This week’s current strength score (the trader positioning range over the past three years, measured from 0 to 100) shows the speculators are currently Bullish-Extreme with a score of 94.5 percent. The commercials are Bearish-Extreme with a score of 4.8 percent and the small traders (not shown in chart) are Bullish-Extreme with a score of 83.5 percent.
| NEW ZEALAND DOLLAR Statistics | SPECULATORS | COMMERCIALS | SMALL TRADERS |
| – Percent of Open Interest Longs: | 60.5 | 23.5 | 13.0 |
| – Percent of Open Interest Shorts: | 30.0 | 60.0 | 6.9 |
| – Net Position: | 13,861 | -16,625 | 2,764 |
| – Gross Longs: | 27,504 | 10,659 | 5,893 |
| – Gross Shorts: | 13,643 | 27,284 | 3,129 |
| – Long to Short Ratio: | 2.0 to 1 | 0.4 to 1 | 1.9 to 1 |
| NET POSITION TREND: | |||
| – COT Index Score (3 Year Range Pct): | 94.5 | 4.8 | 83.5 |
| – COT Index Reading (3 Year Range): | Bullish-Extreme | Bearish-Extreme | Bullish-Extreme |
| NET POSITION MOVEMENT INDEX: | |||
| – 6-Week Change in Strength Index: | 9.7 | -11.4 | 18.8 |
Mexican Peso Futures:
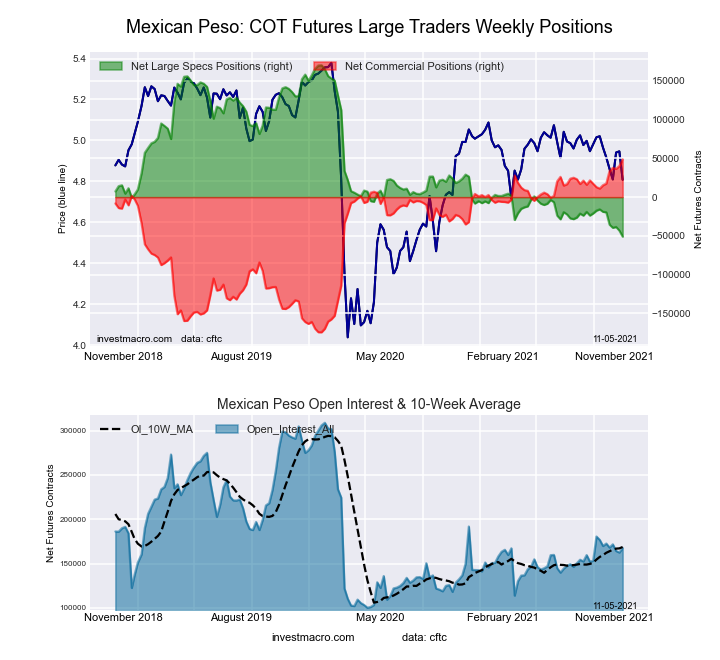 The Mexican Peso large speculator standing this week totaled a net position of -51,018 contracts in the data reported through Tuesday. This was a weekly decrease of -7,729 contracts from the previous week which had a total of -43,289 net contracts.
This week’s current strength score (the trader positioning range over the past three years, measured from 0 to 100) shows the speculators are currently Bearish-Extreme with a score of 0.0 percent. The commercials are Bullish-Extreme with a score of 100.0 percent and the small traders (not shown in chart) are Bullish with a score of 52.4 percent.
| MEXICAN PESO Statistics | SPECULATORS | COMMERCIALS | SMALL TRADERS |
| – Percent of Open Interest Longs: | 36.7 | 59.1 | 3.3 |
| – Percent of Open Interest Shorts: | 67.1 | 30.0 | 2.0 |
| – Net Position: | -51,018 | 48,795 | 2,223 |
| – Gross Longs: | 61,553 | 99,034 | 5,560 |
| – Gross Shorts: | 112,571 | 50,239 | 3,337 |
| – Long to Short Ratio: | 0.5 to 1 | 2.0 to 1 | 1.7 to 1 |
| NET POSITION TREND: | |||
| – COT Index Score (3 Year Range Pct): | 0.0 | 100.0 | 52.4 |
| – COT Index Reading (3 Year Range): | Bearish-Extreme | Bullish-Extreme | Bullish |
| NET POSITION MOVEMENT INDEX: | |||
| – 6-Week Change in Strength Index: | -14.5 | 15.0 | -6.2 |
Brazilian Real Futures:
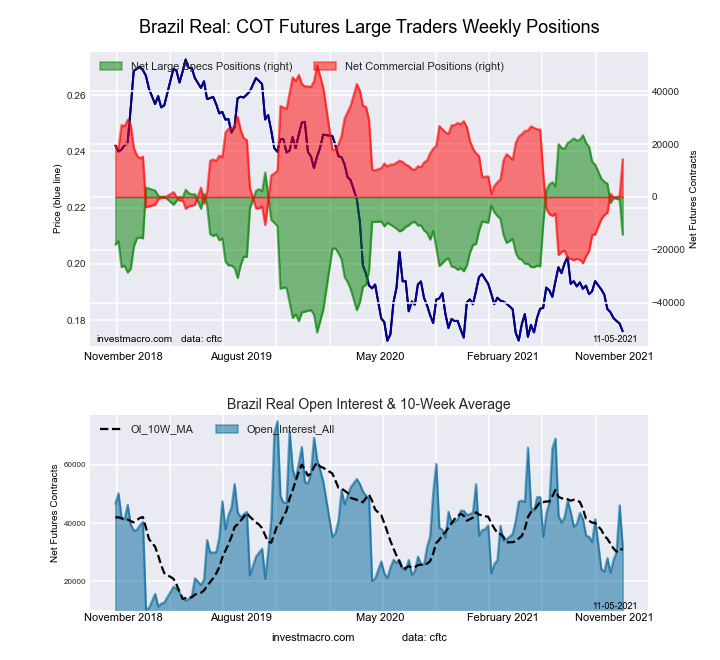 The Brazilian Real large speculator standing this week totaled a net position of -14,272 contracts in the data reported through Tuesday. This was a weekly lowering of -13,330 contracts from the previous week which had a total of -942 net contracts.
This week’s current strength score (the trader positioning range over the past three years, measured from 0 to 100) shows the speculators are currently Bearish with a score of 49.5 percent. The commercials are Bullish with a score of 52.6 percent and the small traders (not shown in chart) are Bullish with a score of 65.8 percent.
| BRAZIL REAL Statistics | SPECULATORS | COMMERCIALS | SMALL TRADERS |
| – Percent of Open Interest Longs: | 28.4 | 61.8 | 9.5 |
| – Percent of Open Interest Shorts: | 73.4 | 16.5 | 9.8 |
| – Net Position: | -14,272 | 14,357 | -85 |
| – Gross Longs: | 8,989 | 19,574 | 3,023 |
| – Gross Shorts: | 23,261 | 5,217 | 3,108 |
| – Long to Short Ratio: | 0.4 to 1 | 3.8 to 1 | 1.0 to 1 |
| NET POSITION TREND: | |||
| – COT Index Score (3 Year Range Pct): | 49.5 | 52.6 | 65.8 |
| – COT Index Reading (3 Year Range): | Bearish | Bullish | Bullish |
| NET POSITION MOVEMENT INDEX: | |||
| – 6-Week Change in Strength Index: | -26.8 | 28.2 | -13.3 |
Russian Ruble Futures:
 The Russian Ruble large speculator standing this week totaled a net position of 19,982 contracts in the data reported through Tuesday. This was a weekly fall of -1,480 contracts from the previous week which had a total of 21,462 net contracts.
This week’s current strength score (the trader positioning range over the past three years, measured from 0 to 100) shows the speculators are currently Bullish with a score of 60.7 percent. The commercials are Bearish with a score of 35.4 percent and the small traders (not shown in chart) are Bullish-Extreme with a score of 86.2 percent.
| RUSSIAN RUBLE Statistics | SPECULATORS | COMMERCIALS | SMALL TRADERS |
| – Percent of Open Interest Longs: | 59.1 | 36.3 | 4.6 |
| – Percent of Open Interest Shorts: | 26.6 | 71.8 | 1.5 |
| – Net Position: | 19,982 | -21,882 | 1,900 |
| – Gross Longs: | 36,389 | 22,369 | 2,843 |
| – Gross Shorts: | 16,407 | 44,251 | 943 |
| – Long to Short Ratio: | 2.2 to 1 | 0.5 to 1 | 3.0 to 1 |
| NET POSITION TREND: | |||
| – COT Index Score (3 Year Range Pct): | 60.7 | 35.4 | 86.2 |
| – COT Index Reading (3 Year Range): | Bullish | Bearish | Bullish-Extreme |
| NET POSITION MOVEMENT INDEX: | |||
| – 6-Week Change in Strength Index: | 4.1 | -4.9 | 10.2 |
Bitcoin Futures:
 The Bitcoin large speculator standing this week totaled a net position of -1,612 contracts in the data reported through Tuesday. This was a weekly increase of 2,800 contracts from the previous week which had a total of -4,412 net contracts.
This week’s current strength score (the trader positioning range over the past three years, measured from 0 to 100) shows the speculators are currently Bullish with a score of 65.6 percent. The commercials are Bullish with a score of 78.2 percent and the small traders (not shown in chart) are Bearish with a score of 24.9 percent.
| BITCOIN Statistics | SPECULATORS | COMMERCIALS | SMALL TRADERS |
| – Percent of Open Interest Longs: | 67.1 | 5.4 | 14.4 |
| – Percent of Open Interest Shorts: | 79.0 | 2.3 | 5.6 |
| – Net Position: | -1,612 | 421 | 1,191 |
| – Gross Longs: | 9,062 | 727 | 1,943 |
| – Gross Shorts: | 10,674 | 306 | 752 |
| – Long to Short Ratio: | 0.8 to 1 | 2.4 to 1 | 2.6 to 1 |
| NET POSITION TREND: | |||
| – COT Index Score (3 Year Range Pct): | 65.6 | 78.2 | 24.9 |
| – COT Index Reading (3 Year Range): | Bullish | Bullish | Bearish |
| NET POSITION MOVEMENT INDEX: | |||
| – 6-Week Change in Strength Index: | -13.7 | 41.6 | 5.5 |
Article By InvestMacro – Receive our weekly COT Reports by Email
*COT Report: The COT data, released weekly to the public each Friday, is updated through the most recent Tuesday (data is 3 days old) and shows a quick view of how large speculators or non-commercials (for-profit traders) were positioned in the futures markets.
The CFTC categorizes trader positions according to commercial hedgers (traders who use futures contracts for hedging as part of the business), non-commercials (large traders who speculate to realize trading profits) and nonreportable traders (usually small traders/speculators) as well as their open interest (contracts open in the market at time of reporting).See CFTC criteria here.

- COT Metals Charts: Weekly Speculator Bets led by Copper & Steel Jul 18, 2026
- COT Bonds Charts: Weekly Speculator Bets led by 2-Year, SOFR 3M & 5-Year Bonds Jul 18, 2026
- COT Energy Charts: Weekly Speculator Bets led by Brent Oil & Heating Oil Jul 18, 2026
- COT Soft Commodities Charts: Weekly Speculator Bets led by Wheat, Corn & Soybean Meal Jul 18, 2026
- The Bank of Canada kept its interest rate unchanged. Platinum prices reached a three‑week high Jul 16, 2026
- Stock indices rose after the release of US inflation data. China’s GDP slowed sharply Jul 15, 2026
- GBP/USD Awaits Political News: What Will Happen Next Jul 15, 2026
- USD/JPY Holds at Highs: Pressure Lingers on Yen Jul 14, 2026
- Oil prices jumped 4% amid a new wave of escalation between the US and Iran Jul 13, 2026
- EUR/USD: US Inflation Will Determine Everything Jul 13, 2026