
By InvestMacro | COT | Data Tables | COT Leaders | Downloads | COT Newsletter
Here are the latest charts and statistics for the Commitment of Traders (COT) data published by the Commodities Futures Trading Commission (CFTC).
The latest COT data is updated through Tuesday November 2nd 2021 and shows a quick view of how large traders (for-profit speculators and commercial entities) were positioned in the futures markets.
Highlighting this week’s COT Bonds data is the general rise in speculator positions among a few of the bond market symbols while other symbols fell sharply. This week has seen the 2-Year bond speculators boost their net positions by +49,210 contracts while the Ultra Long US Treasury bond bets increased by 38,602 contracts and the Long US Treasury bond positions gained by 34,447 contracts this week. These were the second, third and fourth highest weekly changes for speculator positions this week. On the other side of the leaders were the Fed Funds, 5-Year, 10-Year and the Eurodollar markets which registered as the symbols with the largest speculator net decreases on the week.
| Nov-02-2021 | OI | OI-Index | Spec-Net | Spec-Index | Com-Net | COM-Index | Smalls-Net | Smalls-Index |
|---|---|---|---|---|---|---|---|---|
| Eurodollar | 12,358,986 | 62 | -993,373 | 31 | 1,355,371 | 64 | -361,998 | 56 |
| FedFunds | 1,160,971 | 14 | -62,468 | 32 | 74,234 | 69 | -11,766 | 40 |
| 2-Year | 2,052,533 | 11 | -63,108 | 78 | 116,263 | 40 | -53,155 | 0 |
| Long T-Bond | 1,158,749 | 42 | -32,547 | 82 | 48,443 | 36 | -15,896 | 40 |
| 10-Year | 3,973,988 | 63 | -268,669 | 31 | 606,611 | 100 | -337,942 | 0 |
| 5-Year | 3,568,732 | 24 | -376,353 | 29 | 606,647 | 94 | -230,294 | 8 |
3-Month Eurodollars Futures:
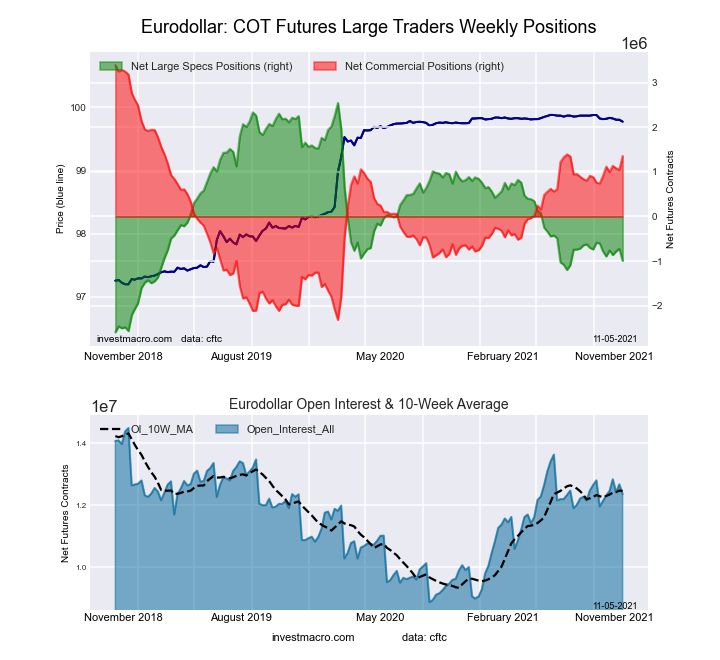 The 3-Month Eurodollars large speculator standing this week resulted in a net position of -993,373 contracts in the data reported through Tuesday. This was a weekly reduction of -268,380 contracts from the previous week which had a total of -724,993 net contracts.
Free Reports:
 Download Our Metatrader 4 Indicators – Put Our Free MetaTrader 4 Custom Indicators on your charts when you join our Weekly Newsletter
 Get our Weekly Commitment of Traders Reports - See where the biggest traders (Hedge Funds and Commercial Hedgers) are positioned in the futures markets on a weekly basis.
This week’s current strength score (the trader positioning range over the past three years, measured from 0 to 100) shows the speculators are currently Bearish with a score of 31.2 percent. The commercials are Bullish with a score of 64.3 percent and the small traders (not shown in chart) are Bullish with a score of 55.9 percent.
| 3-Month Eurodollars Statistics | SPECULATORS | COMMERCIALS | SMALL TRADERS |
| – Percent of Open Interest Longs: | 12.6 | 66.1 | 4.3 |
| – Percent of Open Interest Shorts: | 20.7 | 55.2 | 7.2 |
| – Net Position: | -993,373 | 1,355,371 | -361,998 |
| – Gross Longs: | 1,561,061 | 8,174,708 | 530,581 |
| – Gross Shorts: | 2,554,434 | 6,819,337 | 892,579 |
| – Long to Short Ratio: | 0.6 to 1 | 1.2 to 1 | 0.6 to 1 |
| NET POSITION TREND: | |||
| – COT Index Score (3 Year Range Pct): | 31.2 | 64.3 | 55.9 |
| – COT Index Reading (3 Year Range): | Bearish | Bullish | Bullish |
| NET POSITION MOVEMENT INDEX: | |||
| – 6-Week Change in Strength Index: | -4.1 | 7.8 | -30.5 |
30-Day Federal Funds Futures:
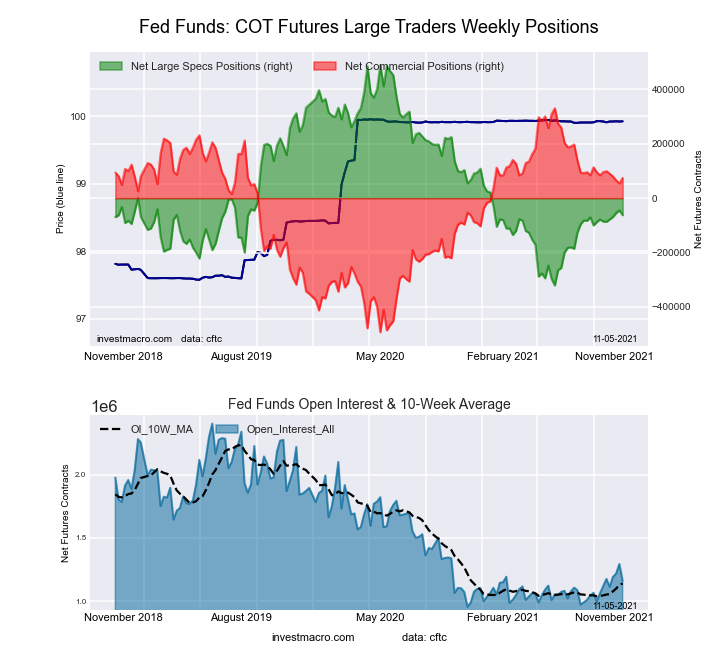 The 30-Day Federal Funds large speculator standing this week resulted in a net position of -62,468 contracts in the data reported through Tuesday. This was a weekly lowering of -17,877 contracts from the previous week which had a total of -44,591 net contracts.
This week’s current strength score (the trader positioning range over the past three years, measured from 0 to 100) shows the speculators are currently Bearish with a score of 31.9 percent. The commercials are Bullish with a score of 68.9 percent and the small traders (not shown in chart) are Bearish with a score of 39.9 percent.
| 30-Day Federal Funds Statistics | SPECULATORS | COMMERCIALS | SMALL TRADERS |
| – Percent of Open Interest Longs: | 4.4 | 80.7 | 2.0 |
| – Percent of Open Interest Shorts: | 9.7 | 74.3 | 3.0 |
| – Net Position: | -62,468 | 74,234 | -11,766 |
| – Gross Longs: | 50,587 | 937,379 | 23,576 |
| – Gross Shorts: | 113,055 | 863,145 | 35,342 |
| – Long to Short Ratio: | 0.4 to 1 | 1.1 to 1 | 0.7 to 1 |
| NET POSITION TREND: | |||
| – COT Index Score (3 Year Range Pct): | 31.9 | 68.9 | 39.9 |
| – COT Index Reading (3 Year Range): | Bearish | Bullish | Bearish |
| NET POSITION MOVEMENT INDEX: | |||
| – 6-Week Change in Strength Index: | 2.9 | -2.6 | -4.4 |
2-Year Treasury Note Futures:
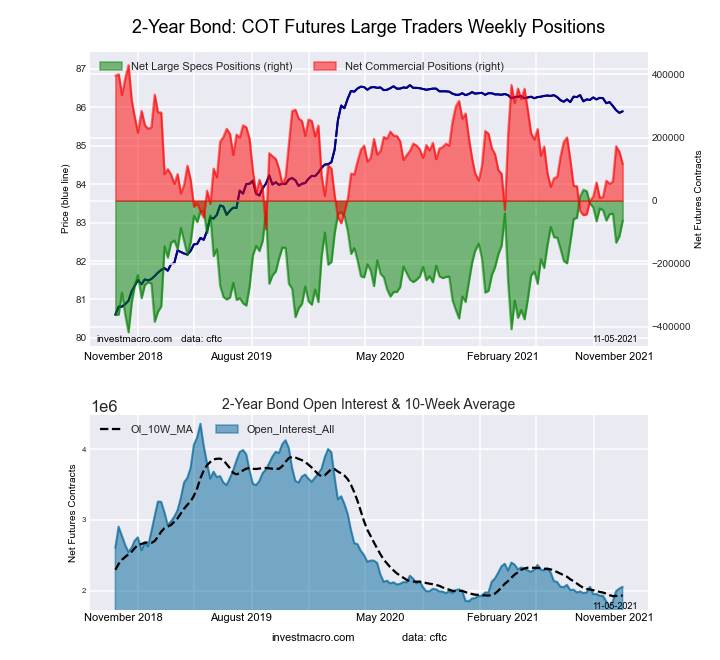 The 2-Year Treasury Note large speculator standing this week resulted in a net position of -63,108 contracts in the data reported through Tuesday. This was a weekly lift of 49,210 contracts from the previous week which had a total of -112,318 net contracts.
This week’s current strength score (the trader positioning range over the past three years, measured from 0 to 100) shows the speculators are currently Bullish with a score of 78.4 percent. The commercials are Bearish with a score of 39.8 percent and the small traders (not shown in chart) are Bearish-Extreme with a score of 0.0 percent.
| 2-Year Treasury Note Statistics | SPECULATORS | COMMERCIALS | SMALL TRADERS |
| – Percent of Open Interest Longs: | 16.0 | 74.1 | 6.2 |
| – Percent of Open Interest Shorts: | 19.1 | 68.5 | 8.8 |
| – Net Position: | -63,108 | 116,263 | -53,155 |
| – Gross Longs: | 329,143 | 1,521,704 | 127,629 |
| – Gross Shorts: | 392,251 | 1,405,441 | 180,784 |
| – Long to Short Ratio: | 0.8 to 1 | 1.1 to 1 | 0.7 to 1 |
| NET POSITION TREND: | |||
| – COT Index Score (3 Year Range Pct): | 78.4 | 39.8 | 0.0 |
| – COT Index Reading (3 Year Range): | Bullish | Bearish | Bearish-Extreme |
| NET POSITION MOVEMENT INDEX: | |||
| – 6-Week Change in Strength Index: | -7.2 | 19.9 | -40.2 |
5-Year Treasury Note Futures:
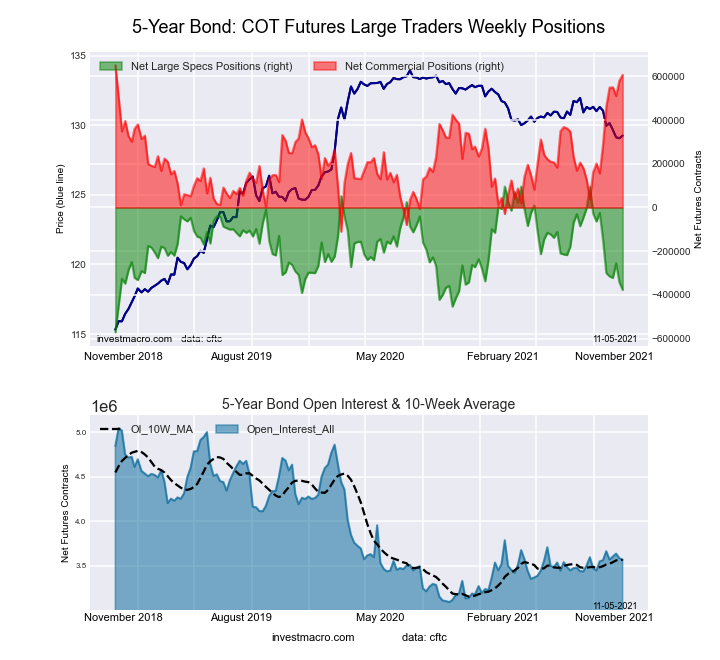 The 5-Year Treasury Note large speculator standing this week resulted in a net position of -376,353 contracts in the data reported through Tuesday. This was a weekly lowering of -34,878 contracts from the previous week which had a total of -341,475 net contracts.
This week’s current strength score (the trader positioning range over the past three years, measured from 0 to 100) shows the speculators are currently Bearish with a score of 29.2 percent. The commercials are Bullish-Extreme with a score of 94.2 percent and the small traders (not shown in chart) are Bearish-Extreme with a score of 7.7 percent.
| 5-Year Treasury Note Statistics | SPECULATORS | COMMERCIALS | SMALL TRADERS |
| – Percent of Open Interest Longs: | 8.9 | 80.7 | 7.4 |
| – Percent of Open Interest Shorts: | 19.4 | 63.7 | 13.8 |
| – Net Position: | -376,353 | 606,647 | -230,294 |
| – Gross Longs: | 317,689 | 2,880,804 | 263,908 |
| – Gross Shorts: | 694,042 | 2,274,157 | 494,202 |
| – Long to Short Ratio: | 0.5 to 1 | 1.3 to 1 | 0.5 to 1 |
| NET POSITION TREND: | |||
| – COT Index Score (3 Year Range Pct): | 29.2 | 94.2 | 7.7 |
| – COT Index Reading (3 Year Range): | Bearish | Bullish-Extreme | Bearish-Extreme |
| NET POSITION MOVEMENT INDEX: | |||
| – 6-Week Change in Strength Index: | -34.4 | 42.2 | -28.3 |
10-Year Treasury Note Futures:
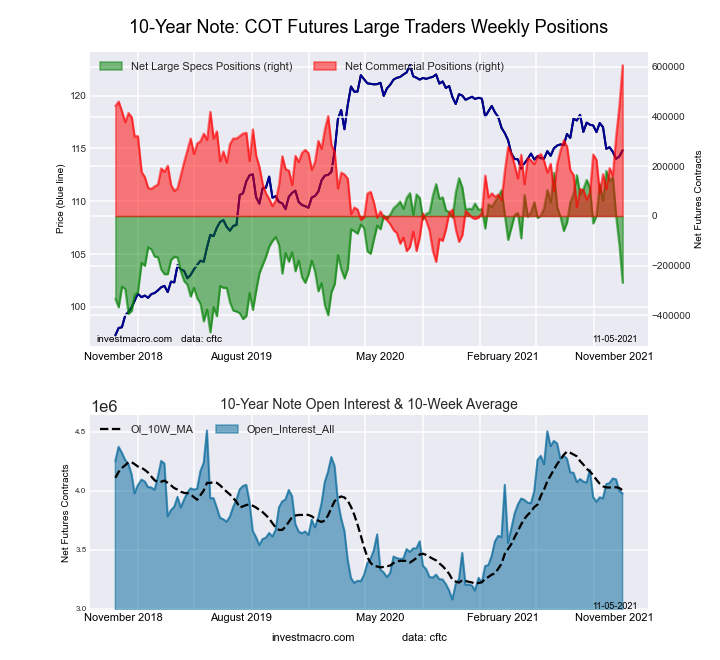 The 10-Year Treasury Note large speculator standing this week resulted in a net position of -268,669 contracts in the data reported through Tuesday. This was a weekly decrease of -153,824 contracts from the previous week which had a total of -114,845 net contracts.
This week’s current strength score (the trader positioning range over the past three years, measured from 0 to 100) shows the speculators are currently Bearish with a score of 30.7 percent. The commercials are Bullish-Extreme with a score of 100.0 percent and the small traders (not shown in chart) are Bearish-Extreme with a score of 0.0 percent.
| 10-Year Treasury Note Statistics | SPECULATORS | COMMERCIALS | SMALL TRADERS |
| – Percent of Open Interest Longs: | 12.5 | 76.8 | 7.4 |
| – Percent of Open Interest Shorts: | 19.2 | 61.6 | 15.9 |
| – Net Position: | -268,669 | 606,611 | -337,942 |
| – Gross Longs: | 496,137 | 3,052,628 | 294,092 |
| – Gross Shorts: | 764,806 | 2,446,017 | 632,034 |
| – Long to Short Ratio: | 0.6 to 1 | 1.2 to 1 | 0.5 to 1 |
| NET POSITION TREND: | |||
| – COT Index Score (3 Year Range Pct): | 30.7 | 100.0 | 0.0 |
| – COT Index Reading (3 Year Range): | Bearish | Bullish-Extreme | Bearish-Extreme |
| NET POSITION MOVEMENT INDEX: | |||
| – 6-Week Change in Strength Index: | -50.8 | 55.4 | -25.2 |
Ultra 10-Year Notes Futures:
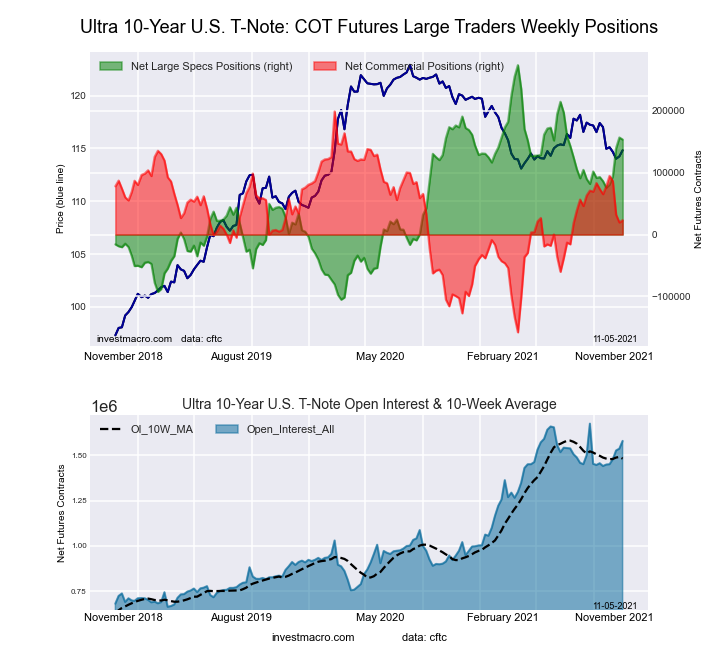 The Ultra 10-Year Notes large speculator standing this week resulted in a net position of 153,483 contracts in the data reported through Tuesday. This was a weekly fall of -3,271 contracts from the previous week which had a total of 156,754 net contracts.
This week’s current strength score (the trader positioning range over the past three years, measured from 0 to 100) shows the speculators are currently Bullish with a score of 68.3 percent. The commercials are Bullish with a score of 50.8 percent and the small traders (not shown in chart) are Bearish-Extreme with a score of 2.4 percent.
| Ultra 10-Year Notes Statistics | SPECULATORS | COMMERCIALS | SMALL TRADERS |
| – Percent of Open Interest Longs: | 20.6 | 71.9 | 6.8 |
| – Percent of Open Interest Shorts: | 10.9 | 70.5 | 18.0 |
| – Net Position: | 153,483 | 23,194 | -176,677 |
| – Gross Longs: | 325,104 | 1,136,251 | 107,890 |
| – Gross Shorts: | 171,621 | 1,113,057 | 284,567 |
| – Long to Short Ratio: | 1.9 to 1 | 1.0 to 1 | 0.4 to 1 |
| NET POSITION TREND: | |||
| – COT Index Score (3 Year Range Pct): | 68.3 | 50.8 | 2.4 |
| – COT Index Reading (3 Year Range): | Bullish | Bullish | Bearish-Extreme |
| NET POSITION MOVEMENT INDEX: | |||
| – 6-Week Change in Strength Index: | 17.8 | -11.8 | -16.2 |
US Treasury Bonds Futures:
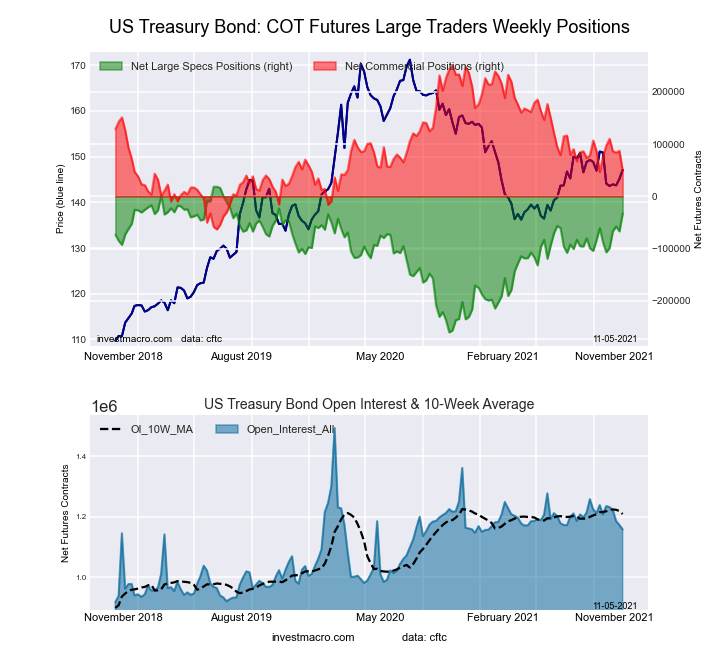 The US Treasury Bonds large speculator standing this week resulted in a net position of -32,547 contracts in the data reported through Tuesday. This was a weekly increase of 34,447 contracts from the previous week which had a total of -66,994 net contracts.
This week’s current strength score (the trader positioning range over the past three years, measured from 0 to 100) shows the speculators are currently Bullish-Extreme with a score of 81.7 percent. The commercials are Bearish with a score of 35.6 percent and the small traders (not shown in chart) are Bearish with a score of 40.0 percent.
| US Treasury Bonds Statistics | SPECULATORS | COMMERCIALS | SMALL TRADERS |
| – Percent of Open Interest Longs: | 10.5 | 73.6 | 14.5 |
| – Percent of Open Interest Shorts: | 13.3 | 69.4 | 15.9 |
| – Net Position: | -32,547 | 48,443 | -15,896 |
| – Gross Longs: | 121,529 | 852,718 | 168,279 |
| – Gross Shorts: | 154,076 | 804,275 | 184,175 |
| – Long to Short Ratio: | 0.8 to 1 | 1.1 to 1 | 0.9 to 1 |
| NET POSITION TREND: | |||
| – COT Index Score (3 Year Range Pct): | 81.7 | 35.6 | 40.0 |
| – COT Index Reading (3 Year Range): | Bullish-Extreme | Bearish | Bearish |
| NET POSITION MOVEMENT INDEX: | |||
| – 6-Week Change in Strength Index: | 20.0 | -8.9 | -22.0 |
Ultra US Treasury Bonds Futures:
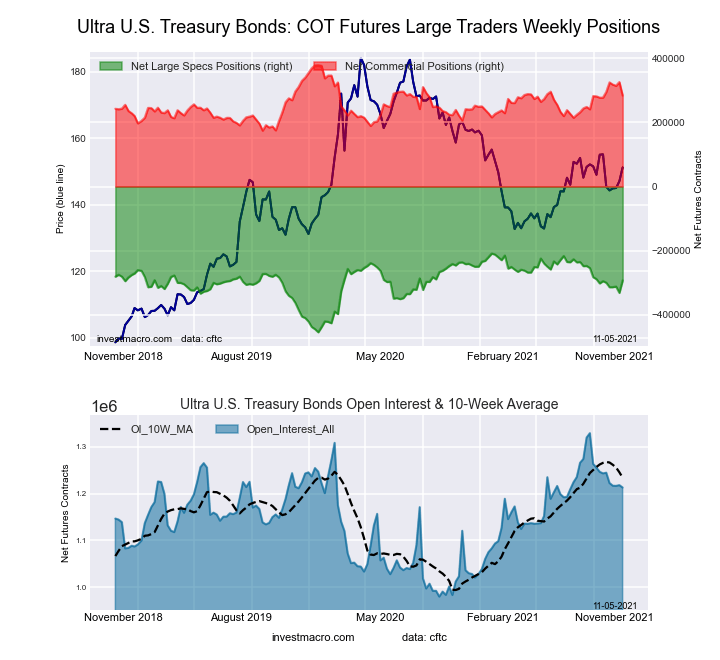 The Ultra US Treasury Bonds large speculator standing this week resulted in a net position of -292,611 contracts in the data reported through Tuesday. This was a weekly boost of 38,602 contracts from the previous week which had a total of -331,213 net contracts.
This week’s current strength score (the trader positioning range over the past three years, measured from 0 to 100) shows the speculators are currently Bullish with a score of 65.8 percent. The commercials are Bullish with a score of 53.6 percent and the small traders (not shown in chart) are Bearish with a score of 35.0 percent.
| Ultra US Treasury Bonds Statistics | SPECULATORS | COMMERCIALS | SMALL TRADERS |
| – Percent of Open Interest Longs: | 3.9 | 82.5 | 12.7 |
| – Percent of Open Interest Shorts: | 28.0 | 59.2 | 12.0 |
| – Net Position: | -292,611 | 283,250 | 9,361 |
| – Gross Longs: | 47,132 | 1,001,156 | 154,604 |
| – Gross Shorts: | 339,743 | 717,906 | 145,243 |
| – Long to Short Ratio: | 0.1 to 1 | 1.4 to 1 | 1.1 to 1 |
| NET POSITION TREND: | |||
| – COT Index Score (3 Year Range Pct): | 65.8 | 53.6 | 35.0 |
| – COT Index Reading (3 Year Range): | Bullish | Bullish | Bearish |
| NET POSITION MOVEMENT INDEX: | |||
| – 6-Week Change in Strength Index: | 0.9 | 3.1 | -6.1 |
Article By InvestMacro – Receive our weekly COT Reports by Email
*COT Report: The COT data, released weekly to the public each Friday, is updated through the most recent Tuesday (data is 3 days old) and shows a quick view of how large speculators or non-commercials (for-profit traders) were positioned in the futures markets.
The CFTC categorizes trader positions according to commercial hedgers (traders who use futures contracts for hedging as part of the business), non-commercials (large traders who speculate to realize trading profits) and nonreportable traders (usually small traders/speculators) as well as their open interest (contracts open in the market at time of reporting).See CFTC criteria here.

- COT Metals Charts: Weekly Speculator Bets led by Copper & Steel Jul 18, 2026
- COT Bonds Charts: Weekly Speculator Bets led by 2-Year, SOFR 3M & 5-Year Bonds Jul 18, 2026
- COT Energy Charts: Weekly Speculator Bets led by Brent Oil & Heating Oil Jul 18, 2026
- COT Soft Commodities Charts: Weekly Speculator Bets led by Wheat, Corn & Soybean Meal Jul 18, 2026
- The Bank of Canada kept its interest rate unchanged. Platinum prices reached a three‑week high Jul 16, 2026
- Stock indices rose after the release of US inflation data. China’s GDP slowed sharply Jul 15, 2026
- GBP/USD Awaits Political News: What Will Happen Next Jul 15, 2026
- USD/JPY Holds at Highs: Pressure Lingers on Yen Jul 14, 2026
- Oil prices jumped 4% amid a new wave of escalation between the US and Iran Jul 13, 2026
- EUR/USD: US Inflation Will Determine Everything Jul 13, 2026