
By InvestMacro | COT | Data Tables | COT Leaders | Downloads | COT Newsletter
Here are the latest charts and statistics for the Commitment of Traders (COT) data published by the Commodities Futures Trading Commission (CFTC).
The latest COT data is updated through Tuesday November 16th 2021 and shows a quick view of how large traders (for-profit speculators and commercial entities) were positioned in the futures markets.
Highlighting the COT Energy data this week is the gains in RBOB Gasoline speculative positions. Gasoline speculator bets jumped this week by the largest one-week gain (+9,145 contracts) of the past fifty-three weeks and rose for the sixth time in ten weeks. These gains have pushed the current speculative net standing (+54,214 contracts) to its highest level of the past twenty weeks, dating back to June 29th. RBOB Gasoline futures prices, like many energy markets, have been on a strong uptrend since bottoming in early 2020 and recently hit the highest level since 2014 in October.
| Nov-16-2021 | OI | OI-Index | Spec-Net | Spec-Index | Com-Net | COM-Index | Smalls-Net | Smalls-Index |
|---|---|---|---|---|---|---|---|---|
| WTI Crude | 2,057,633 | 18 | 415,785 | 44 | -470,324 | 41 | 54,539 | 92 |
| Gold | 612,612 | 54 | 259,780 | 73 | -287,539 | 27 | 27,759 | 48 |
| Silver | 152,404 | 18 | 45,625 | 68 | -66,148 | 34 | 20,523 | 61 |
| Copper | 208,066 | 32 | 20,337 | 57 | -30,805 | 38 | 10,468 | 86 |
| Palladium | 11,840 | 24 | -2,038 | 7 | 1,976 | 91 | 62 | 48 |
| Platinum | 62,284 | 26 | 21,013 | 33 | -28,225 | 69 | 7,212 | 63 |
| Natural Gas | 1,308,708 | 45 | -144,620 | 35 | 98,415 | 62 | 46,205 | 96 |
| Brent | 199,930 | 39 | -12,900 | 98 | 7,412 | 0 | 5,488 | 94 |
| Heating Oil | 380,887 | 26 | 17,029 | 67 | -37,010 | 32 | 19,981 | 68 |
| Soybeans | 662,972 | 13 | 46,917 | 42 | -4,927 | 65 | -41,990 | 2 |
| Corn | 1,598,926 | 38 | 399,186 | 81 | -340,672 | 23 | -58,514 | 9 |
| Coffee | 286,343 | 48 | 66,081 | 97 | -70,075 | 5 | 3,994 | 16 |
| Sugar | 906,385 | 21 | 227,389 | 83 | -276,185 | 16 | 48,796 | 68 |
| Wheat | 427,786 | 49 | 36,761 | 78 | -27,999 | 14 | -8,762 | 60 |
WTI Crude Oil Futures:
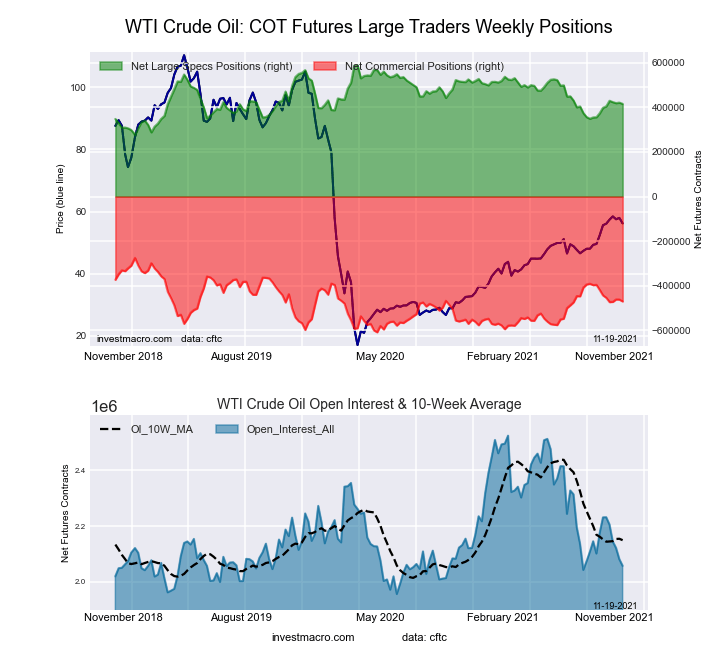 The WTI Crude Oil Futures large speculator standing this week resulted in a net position of 415,785 contracts in the data reported through Tuesday. This was a weekly decrease of -5,527 contracts from the previous week which had a total of 421,312 net contracts.
Free Reports:
 Download Our Metatrader 4 Indicators – Put Our Free MetaTrader 4 Custom Indicators on your charts when you join our Weekly Newsletter
 Get our Weekly Commitment of Traders Reports - See where the biggest traders (Hedge Funds and Commercial Hedgers) are positioned in the futures markets on a weekly basis.
This week’s current strength score (the trader positioning range over the past three years, measured from 0 to 100) shows the speculators are currently Bearish with a score of 44.4 percent. The commercials are Bearish with a score of 41.5 percent and the small traders (not shown in chart) are Bullish-Extreme with a score of 91.9 percent.
| WTI Crude Oil Futures Statistics | SPECULATORS | COMMERCIALS | SMALL TRADERS |
| – Percent of Open Interest Longs: | 24.8 | 34.6 | 5.0 |
| – Percent of Open Interest Shorts: | 4.6 | 57.4 | 2.4 |
| – Net Position: | 415,785 | -470,324 | 54,539 |
| – Gross Longs: | 510,169 | 711,066 | 103,722 |
| – Gross Shorts: | 94,384 | 1,181,390 | 49,183 |
| – Long to Short Ratio: | 5.4 to 1 | 0.6 to 1 | 2.1 to 1 |
| NET POSITION TREND: | |||
| – COT Index Score (3 Year Range Pct): | 44.4 | 41.5 | 91.9 |
| – COT Index Reading (3 Year Range): | Bearish | Bearish | Bullish-Extreme |
| NET POSITION MOVEMENT INDEX: | |||
| – 6-Week Change in Strength Index: | 5.6 | -8.1 | 13.5 |
Brent Crude Oil Futures:
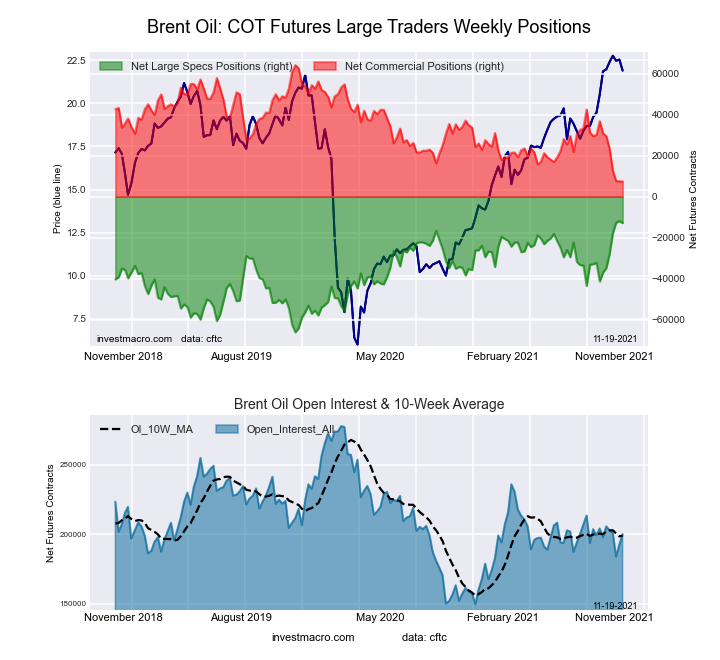 The Brent Crude Oil Futures large speculator standing this week resulted in a net position of -12,900 contracts in the data reported through Tuesday. This was a weekly reduction of -1,049 contracts from the previous week which had a total of -11,851 net contracts.
This week’s current strength score (the trader positioning range over the past three years, measured from 0 to 100) shows the speculators are currently Bullish-Extreme with a score of 98.1 percent. The commercials are Bearish-Extreme with a score of 0.0 percent and the small traders (not shown in chart) are Bullish-Extreme with a score of 94.1 percent.
| Brent Crude Oil Futures Statistics | SPECULATORS | COMMERCIALS | SMALL TRADERS |
| – Percent of Open Interest Longs: | 22.6 | 40.8 | 4.4 |
| – Percent of Open Interest Shorts: | 29.1 | 37.1 | 1.7 |
| – Net Position: | -12,900 | 7,412 | 5,488 |
| – Gross Longs: | 45,201 | 81,608 | 8,790 |
| – Gross Shorts: | 58,101 | 74,196 | 3,302 |
| – Long to Short Ratio: | 0.8 to 1 | 1.1 to 1 | 2.7 to 1 |
| NET POSITION TREND: | |||
| – COT Index Score (3 Year Range Pct): | 98.1 | 0.0 | 94.1 |
| – COT Index Reading (3 Year Range): | Bullish-Extreme | Bearish-Extreme | Bullish-Extreme |
| NET POSITION MOVEMENT INDEX: | |||
| – 6-Week Change in Strength Index: | 44.4 | -41.4 | -5.9 |
Natural Gas Futures:
 The Natural Gas Futures large speculator standing this week resulted in a net position of -144,620 contracts in the data reported through Tuesday. This was a weekly fall of -2,429 contracts from the previous week which had a total of -142,191 net contracts.
This week’s current strength score (the trader positioning range over the past three years, measured from 0 to 100) shows the speculators are currently Bearish with a score of 35.2 percent. The commercials are Bullish with a score of 61.9 percent and the small traders (not shown in chart) are Bullish-Extreme with a score of 95.9 percent.
| Natural Gas Futures Statistics | SPECULATORS | COMMERCIALS | SMALL TRADERS |
| – Percent of Open Interest Longs: | 19.2 | 43.8 | 5.1 |
| – Percent of Open Interest Shorts: | 30.3 | 36.2 | 1.6 |
| – Net Position: | -144,620 | 98,415 | 46,205 |
| – Gross Longs: | 251,501 | 572,761 | 67,164 |
| – Gross Shorts: | 396,121 | 474,346 | 20,959 |
| – Long to Short Ratio: | 0.6 to 1 | 1.2 to 1 | 3.2 to 1 |
| NET POSITION TREND: | |||
| – COT Index Score (3 Year Range Pct): | 35.2 | 61.9 | 95.9 |
| – COT Index Reading (3 Year Range): | Bearish | Bullish | Bullish-Extreme |
| NET POSITION MOVEMENT INDEX: | |||
| – 6-Week Change in Strength Index: | -3.3 | 0.6 | 23.1 |
Gasoline Blendstock Futures:
 The Gasoline Blendstock Futures large speculator standing this week resulted in a net position of 54,214 contracts in the data reported through Tuesday. This was a weekly increase of 9,145 contracts from the previous week which had a total of 45,069 net contracts.
This week’s current strength score (the trader positioning range over the past three years, measured from 0 to 100) shows the speculators are currently Bearish with a score of 25.3 percent. The commercials are Bullish with a score of 74.9 percent and the small traders (not shown in chart) are Bullish with a score of 58.8 percent.
| Nasdaq Mini Futures Statistics | SPECULATORS | COMMERCIALS | SMALL TRADERS |
| – Percent of Open Interest Longs: | 32.1 | 45.7 | 6.6 |
| – Percent of Open Interest Shorts: | 16.0 | 64.2 | 4.2 |
| – Net Position: | 54,214 | -62,114 | 7,900 |
| – Gross Longs: | 108,162 | 153,833 | 22,091 |
| – Gross Shorts: | 53,948 | 215,947 | 14,191 |
| – Long to Short Ratio: | 2.0 to 1 | 0.7 to 1 | 1.6 to 1 |
| NET POSITION TREND: | |||
| – COT Index Score (3 Year Range Pct): | 25.3 | 74.9 | 58.8 |
| – COT Index Reading (3 Year Range): | Bearish | Bullish | Bullish |
| NET POSITION MOVEMENT INDEX: | |||
| – 6-Week Change in Strength Index: | 3.2 | -3.3 | 0.7 |
#2 Heating Oil NY-Harbor Futures:
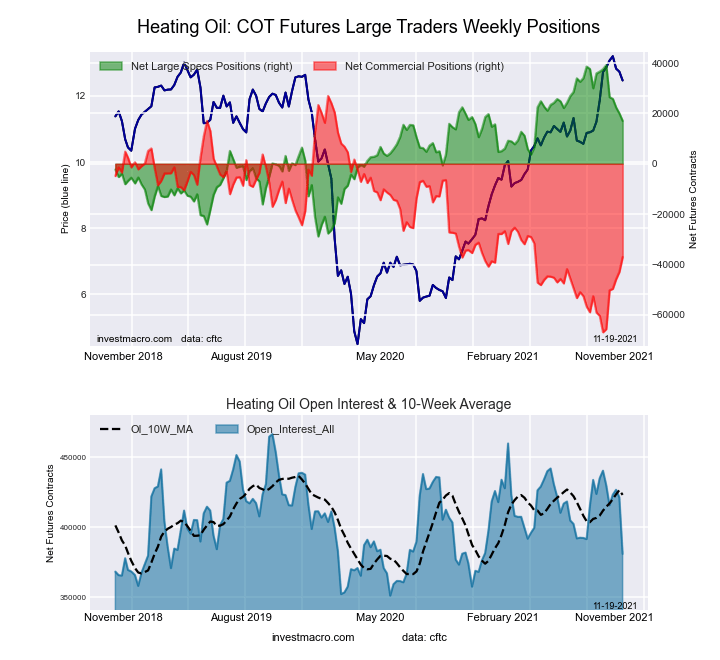 The #2 Heating Oil NY-Harbor Futures large speculator standing this week resulted in a net position of 17,029 contracts in the data reported through Tuesday. This was a weekly lowering of -2,993 contracts from the previous week which had a total of 20,022 net contracts.
This week’s current strength score (the trader positioning range over the past three years, measured from 0 to 100) shows the speculators are currently Bullish with a score of 67.5 percent. The commercials are Bearish with a score of 31.8 percent and the small traders (not shown in chart) are Bullish with a score of 67.6 percent.
| Heating Oil Futures Statistics | SPECULATORS | COMMERCIALS | SMALL TRADERS |
| – Percent of Open Interest Longs: | 14.0 | 52.3 | 12.3 |
| – Percent of Open Interest Shorts: | 9.6 | 62.0 | 7.1 |
| – Net Position: | 17,029 | -37,010 | 19,981 |
| – Gross Longs: | 53,501 | 199,252 | 46,852 |
| – Gross Shorts: | 36,472 | 236,262 | 26,871 |
| – Long to Short Ratio: | 1.5 to 1 | 0.8 to 1 | 1.7 to 1 |
| NET POSITION TREND: | |||
| – COT Index Score (3 Year Range Pct): | 67.5 | 31.8 | 67.6 |
| – COT Index Reading (3 Year Range): | Bullish | Bearish | Bullish |
| NET POSITION MOVEMENT INDEX: | |||
| – 6-Week Change in Strength Index: | -30.2 | 31.8 | -32.4 |
Bloomberg Commodity Index Futures:
 The Bloomberg Commodity Index Futures large speculator standing this week resulted in a net position of -13,973 contracts in the data reported through Tuesday. This was a weekly increase of 218 contracts from the previous week which had a total of -14,191 net contracts.
This week’s current strength score (the trader positioning range over the past three years, measured from 0 to 100) shows the speculators are currently Bearish with a score of 35.2 percent. The commercials are Bullish with a score of 63.7 percent and the small traders (not shown in chart) are Bullish with a score of 56.0 percent.
| Bloomberg Index Futures Statistics | SPECULATORS | COMMERCIALS | SMALL TRADERS |
| – Percent of Open Interest Longs: | 55.7 | 37.9 | 1.9 |
| – Percent of Open Interest Shorts: | 90.4 | 5.0 | 0.1 |
| – Net Position: | -13,973 | 13,252 | 721 |
| – Gross Longs: | 22,471 | 15,268 | 772 |
| – Gross Shorts: | 36,444 | 2,016 | 51 |
| – Long to Short Ratio: | 0.6 to 1 | 7.6 to 1 | 15.1 to 1 |
| NET POSITION TREND: | |||
| – COT Index Score (3 Year Range Pct): | 35.2 | 63.7 | 56.0 |
| – COT Index Reading (3 Year Range): | Bearish | Bullish | Bullish |
| NET POSITION MOVEMENT INDEX: | |||
| – 6-Week Change in Strength Index: | -3.2 | 2.6 | 12.3 |
Article By InvestMacro – Receive our weekly COT Reports by Email
*COT Report: The COT data, released weekly to the public each Friday, is updated through the most recent Tuesday (data is 3 days old) and shows a quick view of how large speculators or non-commercials (for-profit traders) were positioned in the futures markets.
The CFTC categorizes trader positions according to commercial hedgers (traders who use futures contracts for hedging as part of the business), non-commercials (large traders who speculate to realize trading profits) and nonreportable traders (usually small traders/speculators) as well as their open interest (contracts open in the market at time of reporting).See CFTC criteria here.

- The Bank of Canada kept its interest rate unchanged. Platinum prices reached a three‑week high Jul 16, 2026
- Stock indices rose after the release of US inflation data. China’s GDP slowed sharply Jul 15, 2026
- GBP/USD Awaits Political News: What Will Happen Next Jul 15, 2026
- USD/JPY Holds at Highs: Pressure Lingers on Yen Jul 14, 2026
- Oil prices jumped 4% amid a new wave of escalation between the US and Iran Jul 13, 2026
- EUR/USD: US Inflation Will Determine Everything Jul 13, 2026
- COT Metals Charts: Weekly Speculator Bets see small gains for Silver & Gold Jul 12, 2026
- COT Bonds Charts: Speculator Bets led by SOFR 3-Months & 2-Year Bonds Jul 12, 2026
- COT Energy Charts: Weekly Speculator Changes led by Brent Oil Jul 12, 2026
- COT Soft Commodities Charts: Weekly Speculator Changes led by Sugar, Corn & Soybeans Jul 12, 2026