
By InvestMacro | COT | Data Tables | COT Leaders | Downloads | COT Newsletter
Here are the latest charts and statistics for the Commitment of Traders (COT) data published by the Commodities Futures Trading Commission (CFTC).
The latest COT data is updated through Tuesday November 9th 2021 and shows a quick view of how large traders (for-profit speculators and commercial entities) were positioned in the futures markets. This week’s reports are delayed due to last week’s Veteran’s Day holiday.
Highlighting this week’s COT data for Soft Commodities is the continued strength of Coffee, Cotton and Sugar. All three of these markets remain in very bullish territory for speculators and are over the extreme strength index reading of 80+ percent each. Coffee and Cotton have been having great runs in price as their ETF prices have risen by 41 and 36 percent, respectively over the past 90 days. Sugar has been not quite as hot with a 90-day gain of 16.53 percent.
| Nov-09-2021 | OI | OI-Index | Spec-Net | Spec-Index | Com-Net | COM-Index | Smalls-Net | Smalls-Index |
|---|---|---|---|---|---|---|---|---|
| WTI Crude | 2,081,385 | 22 | 421,312 | 46 | -461,964 | 44 | 40,652 | 72 |
| Gold | 571,025 | 43 | 250,181 | 71 | -275,489 | 30 | 25,308 | 42 |
| Silver | 144,370 | 11 | 36,915 | 59 | -53,669 | 46 | 16,754 | 38 |
| Copper | 213,365 | 36 | 22,789 | 59 | -33,194 | 37 | 10,405 | 85 |
| Palladium | 11,819 | 24 | -2,954 | 2 | 3,003 | 97 | -49 | 42 |
| Platinum | 57,866 | 18 | 17,630 | 28 | -24,263 | 74 | 6,633 | 55 |
| Natural Gas | 1,305,687 | 45 | -142,191 | 36 | 98,418 | 62 | 43,773 | 90 |
| Brent | 192,398 | 33 | -11,851 | 100 | 7,567 | 0 | 4,284 | 82 |
| Heating Oil | 421,299 | 61 | 20,022 | 72 | -42,921 | 26 | 22,899 | 78 |
| Soybeans | 644,317 | 9 | 27,584 | 37 | 9,085 | 68 | -36,669 | 11 |
| Corn | 1,540,731 | 28 | 375,298 | 78 | -320,877 | 26 | -54,421 | 12 |
| Coffee | 312,143 | 67 | 60,820 | 93 | -65,365 | 9 | 4,545 | 20 |
| Sugar | 897,739 | 22 | 212,031 | 80 | -260,761 | 19 | 48,730 | 68 |
| Wheat | 405,438 | 37 | 19,203 | 63 | -13,409 | 28 | -5,794 | 74 |
CORN Futures:
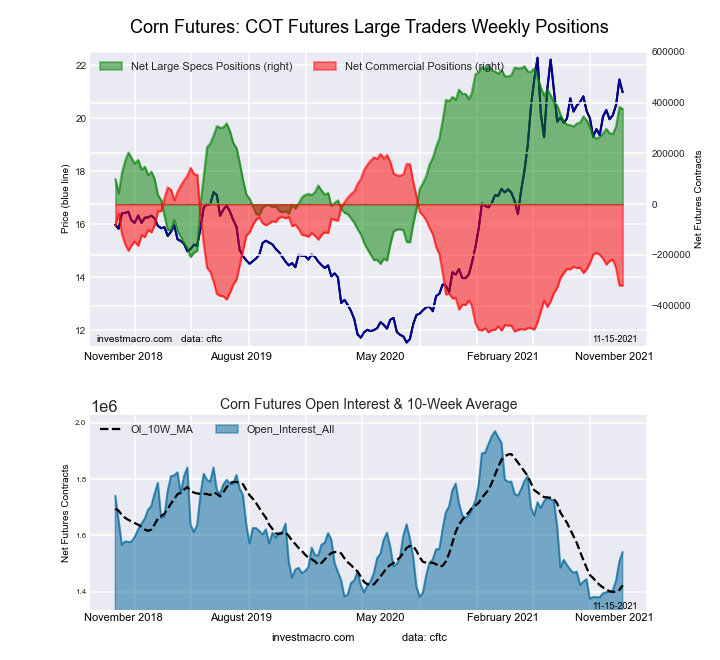 The CORN large speculator standing this week totaled a net position of 375,298 contracts in the data reported through Tuesday. This was a weekly decline of -7,811 contracts from the previous week which had a total of 383,109 net contracts.
Free Reports:
 Download Our Metatrader 4 Indicators – Put Our Free MetaTrader 4 Custom Indicators on your charts when you join our Weekly Newsletter
 Get our Weekly Commitment of Traders Reports - See where the biggest traders (Hedge Funds and Commercial Hedgers) are positioned in the futures markets on a weekly basis.
This week’s current strength score (the trader positioning range over the past three years, measured from 0 to 100) shows the speculators are currently Bullish with a score of 78.0 percent. The commercials are Bearish with a score of 26.2 percent and the small traders (not shown in chart) are Bearish-Extreme with a score of 11.7 percent.
| CORN Futures Statistics | SPECULATORS | COMMERCIALS | SMALL TRADERS |
| – Percent of Open Interest Longs: | 30.9 | 45.8 | 9.0 |
| – Percent of Open Interest Shorts: | 6.6 | 66.7 | 12.5 |
| – Net Position: | 375,298 | -320,877 | -54,421 |
| – Gross Longs: | 476,313 | 706,074 | 138,767 |
| – Gross Shorts: | 101,015 | 1,026,951 | 193,188 |
| – Long to Short Ratio: | 4.7 to 1 | 0.7 to 1 | 0.7 to 1 |
| NET POSITION TREND: | |||
| – COT Index Score (3 Year Range Pct): | 78.0 | 26.2 | 11.7 |
| – COT Index Reading (3 Year Range): | Bullish | Bearish | Bearish-Extreme |
| NET POSITION MOVEMENT INDEX: | |||
| – 6-Week Change in Strength Index: | 12.4 | -15.1 | 5.2 |
SUGAR Futures:
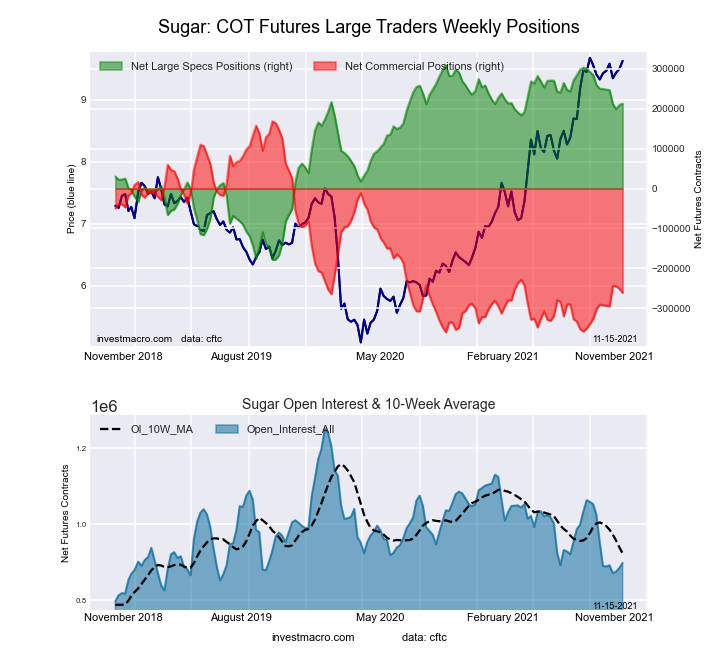 The SUGAR large speculator standing this week totaled a net position of 212,031 contracts in the data reported through Tuesday. This was a weekly increase of 2,970 contracts from the previous week which had a total of 209,061 net contracts.
This week’s current strength score (the trader positioning range over the past three years, measured from 0 to 100) shows the speculators are currently Bullish-Extreme with a score of 80.2 percent. The commercials are Bearish-Extreme with a score of 18.7 percent and the small traders (not shown in chart) are Bullish with a score of 68.1 percent.
| SUGAR Futures Statistics | SPECULATORS | COMMERCIALS | SMALL TRADERS |
| – Percent of Open Interest Longs: | 29.9 | 43.7 | 11.0 |
| – Percent of Open Interest Shorts: | 6.3 | 72.8 | 5.6 |
| – Net Position: | 212,031 | -260,761 | 48,730 |
| – Gross Longs: | 268,559 | 392,370 | 98,602 |
| – Gross Shorts: | 56,528 | 653,131 | 49,872 |
| – Long to Short Ratio: | 4.8 to 1 | 0.6 to 1 | 2.0 to 1 |
| NET POSITION TREND: | |||
| – COT Index Score (3 Year Range Pct): | 80.2 | 18.7 | 68.1 |
| – COT Index Reading (3 Year Range): | Bullish-Extreme | Bearish-Extreme | Bullish |
| NET POSITION MOVEMENT INDEX: | |||
| – 6-Week Change in Strength Index: | -7.6 | 5.9 | 7.3 |
COFFEE Futures:
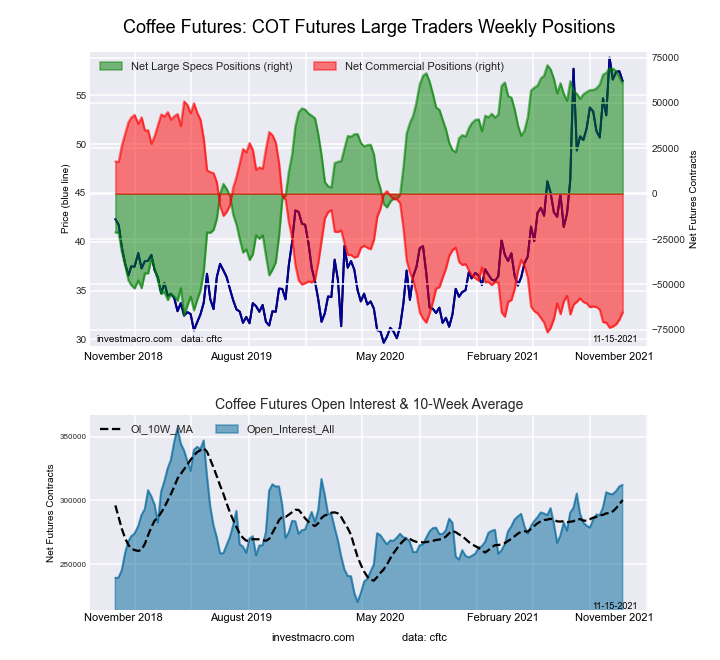 The COFFEE large speculator standing this week totaled a net position of 60,820 contracts in the data reported through Tuesday. This was a weekly lowering of -3,533 contracts from the previous week which had a total of 64,353 net contracts.
This week’s current strength score (the trader positioning range over the past three years, measured from 0 to 100) shows the speculators are currently Bullish-Extreme with a score of 92.8 percent. The commercials are Bearish-Extreme with a score of 8.6 percent and the small traders (not shown in chart) are Bearish-Extreme with a score of 19.8 percent.
| COFFEE Futures Statistics | SPECULATORS | COMMERCIALS | SMALL TRADERS |
| – Percent of Open Interest Longs: | 25.1 | 44.1 | 4.0 |
| – Percent of Open Interest Shorts: | 5.6 | 65.1 | 2.6 |
| – Net Position: | 60,820 | -65,365 | 4,545 |
| – Gross Longs: | 78,364 | 137,701 | 12,604 |
| – Gross Shorts: | 17,544 | 203,066 | 8,059 |
| – Long to Short Ratio: | 4.5 to 1 | 0.7 to 1 | 1.6 to 1 |
| NET POSITION TREND: | |||
| – COT Index Score (3 Year Range Pct): | 92.8 | 8.6 | 19.8 |
| – COT Index Reading (3 Year Range): | Bullish-Extreme | Bearish-Extreme | Bearish-Extreme |
| NET POSITION MOVEMENT INDEX: | |||
| – 6-Week Change in Strength Index: | -3.5 | 4.2 | -3.8 |
SOYBEANS Futures:
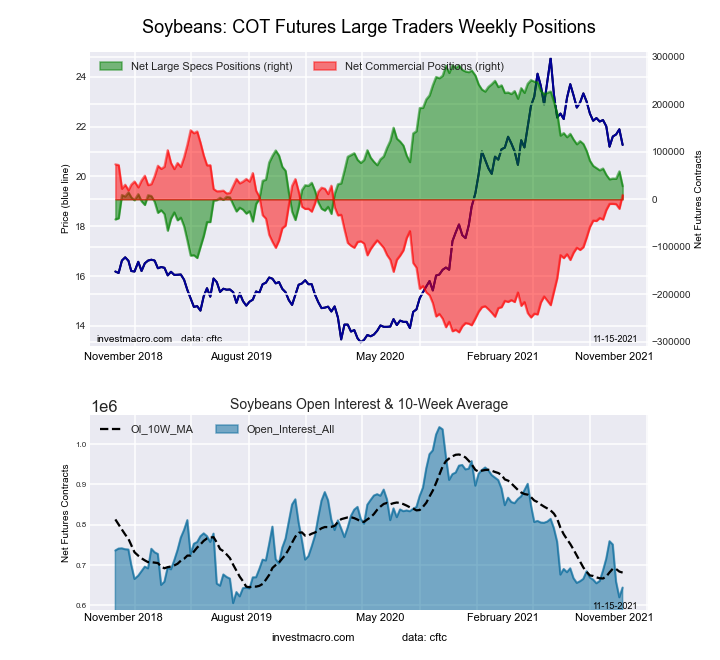 The SOYBEANS large speculator standing this week totaled a net position of 27,584 contracts in the data reported through Tuesday. This was a weekly decline of -31,172 contracts from the previous week which had a total of 58,756 net contracts.
This week’s current strength score (the trader positioning range over the past three years, measured from 0 to 100) shows the speculators are currently Bearish with a score of 37.2 percent. The commercials are Bullish with a score of 68.0 percent and the small traders (not shown in chart) are Bearish-Extreme with a score of 10.8 percent.
| SOYBEANS Futures Statistics | SPECULATORS | COMMERCIALS | SMALL TRADERS |
| – Percent of Open Interest Longs: | 19.2 | 59.0 | 7.2 |
| – Percent of Open Interest Shorts: | 14.9 | 57.6 | 12.9 |
| – Net Position: | 27,584 | 9,085 | -36,669 |
| – Gross Longs: | 123,904 | 379,918 | 46,176 |
| – Gross Shorts: | 96,320 | 370,833 | 82,845 |
| – Long to Short Ratio: | 1.3 to 1 | 1.0 to 1 | 0.6 to 1 |
| NET POSITION TREND: | |||
| – COT Index Score (3 Year Range Pct): | 37.2 | 68.0 | 10.8 |
| – COT Index Reading (3 Year Range): | Bearish | Bullish | Bearish-Extreme |
| NET POSITION MOVEMENT INDEX: | |||
| – 6-Week Change in Strength Index: | -9.2 | 12.2 | -24.1 |
SOYBEAN OIL Futures:
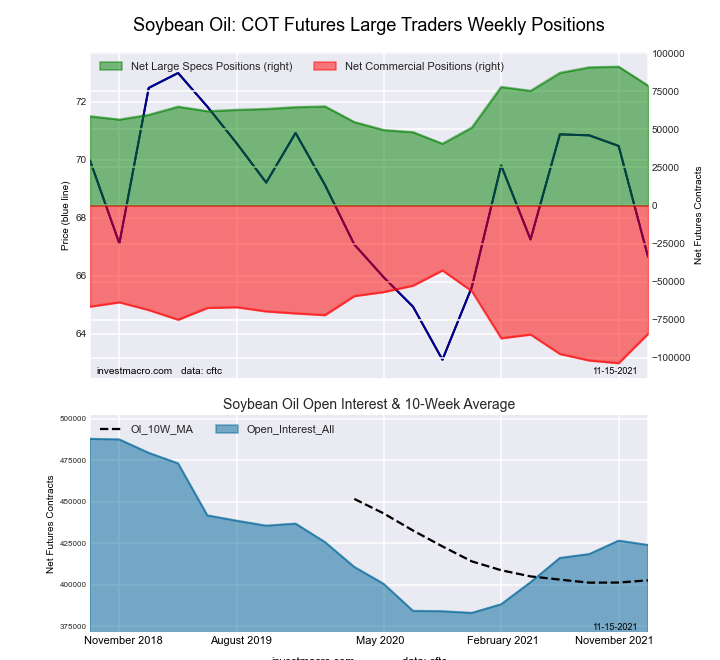 The SOYBEAN OIL large speculator standing this week totaled a net position of 78,712 contracts in the data reported through Tuesday. This was a weekly decrease of -12,419 contracts from the previous week which had a total of 91,131 net contracts.
This week’s current strength score (the trader positioning range over the past three years, measured from 0 to 100) shows the speculators are currently Bullish with a score of 66.3 percent. The commercials are Bearish with a score of 37.6 percent and the small traders (not shown in chart) are Bearish with a score of 34.3 percent.
| SOYBEAN OIL Futures Statistics | SPECULATORS | COMMERCIALS | SMALL TRADERS |
| – Percent of Open Interest Longs: | 27.1 | 48.7 | 6.6 |
| – Percent of Open Interest Shorts: | 8.6 | 68.6 | 5.3 |
| – Net Position: | 78,712 | -84,310 | 5,598 |
| – Gross Longs: | 115,011 | 206,289 | 28,073 |
| – Gross Shorts: | 36,299 | 290,599 | 22,475 |
| – Long to Short Ratio: | 3.2 to 1 | 0.7 to 1 | 1.2 to 1 |
| NET POSITION TREND: | |||
| – COT Index Score (3 Year Range Pct): | 66.3 | 37.6 | 34.3 |
| – COT Index Reading (3 Year Range): | Bullish | Bearish | Bearish |
| NET POSITION MOVEMENT INDEX: | |||
| – 6-Week Change in Strength Index: | 14.9 | -14.0 | 1.8 |
SOYBEAN MEAL Futures:
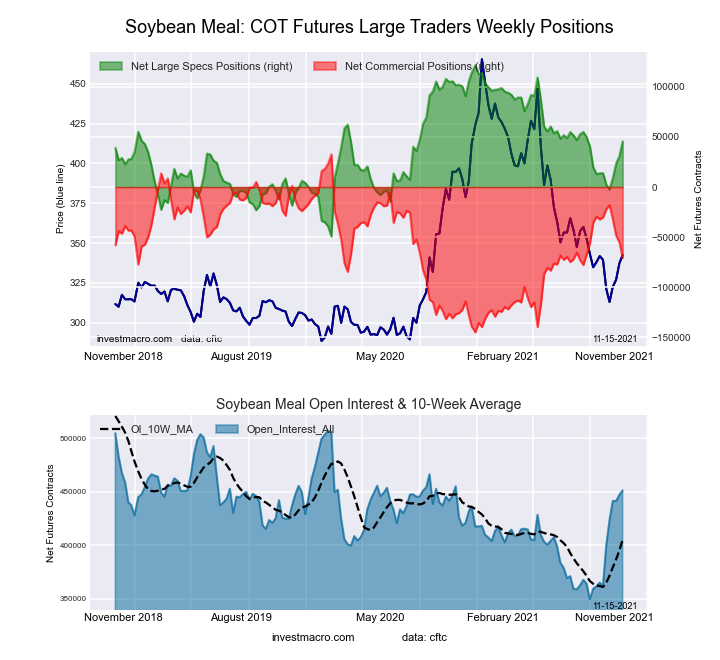 The SOYBEAN MEAL large speculator standing this week totaled a net position of 45,635 contracts in the data reported through Tuesday. This was a weekly rise of 14,864 contracts from the previous week which had a total of 30,771 net contracts.
This week’s current strength score (the trader positioning range over the past three years, measured from 0 to 100) shows the speculators are currently Bullish with a score of 55.5 percent. The commercials are Bearish with a score of 41.9 percent and the small traders (not shown in chart) are Bullish with a score of 70.9 percent.
| SOYBEAN MEAL Futures Statistics | SPECULATORS | COMMERCIALS | SMALL TRADERS |
| – Percent of Open Interest Longs: | 22.2 | 45.2 | 12.1 |
| – Percent of Open Interest Shorts: | 12.1 | 60.9 | 6.6 |
| – Net Position: | 45,635 | -70,647 | 25,012 |
| – Gross Longs: | 100,078 | 203,931 | 54,716 |
| – Gross Shorts: | 54,443 | 274,578 | 29,704 |
| – Long to Short Ratio: | 1.8 to 1 | 0.7 to 1 | 1.8 to 1 |
| NET POSITION TREND: | |||
| – COT Index Score (3 Year Range Pct): | 55.5 | 41.9 | 70.9 |
| – COT Index Reading (3 Year Range): | Bullish | Bearish | Bullish |
| NET POSITION MOVEMENT INDEX: | |||
| – 6-Week Change in Strength Index: | 18.6 | -22.7 | 34.2 |
LIVE CATTLE Futures:
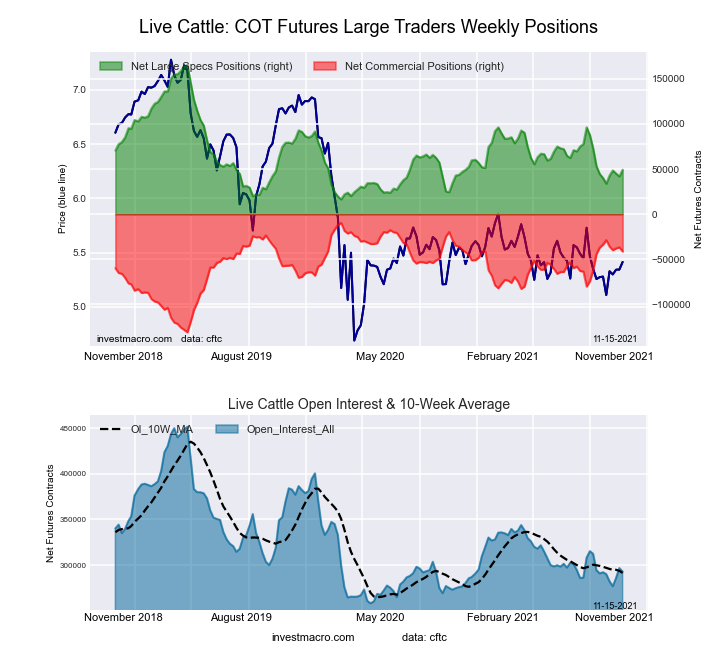 The LIVE CATTLE large speculator standing this week totaled a net position of 49,203 contracts in the data reported through Tuesday. This was a weekly lift of 7,309 contracts from the previous week which had a total of 41,894 net contracts.
This week’s current strength score (the trader positioning range over the past three years, measured from 0 to 100) shows the speculators are currently Bearish with a score of 22.0 percent. The commercials are Bullish with a score of 74.0 percent and the small traders (not shown in chart) are Bullish with a score of 67.8 percent.
| LIVE CATTLE Futures Statistics | SPECULATORS | COMMERCIALS | SMALL TRADERS |
| – Percent of Open Interest Longs: | 33.0 | 40.6 | 10.3 |
| – Percent of Open Interest Shorts: | 16.2 | 54.7 | 13.0 |
| – Net Position: | 49,203 | -41,274 | -7,929 |
| – Gross Longs: | 96,637 | 118,856 | 30,161 |
| – Gross Shorts: | 47,434 | 160,130 | 38,090 |
| – Long to Short Ratio: | 2.0 to 1 | 0.7 to 1 | 0.8 to 1 |
| NET POSITION TREND: | |||
| – COT Index Score (3 Year Range Pct): | 22.0 | 74.0 | 67.8 |
| – COT Index Reading (3 Year Range): | Bearish | Bullish | Bullish |
| NET POSITION MOVEMENT INDEX: | |||
| – 6-Week Change in Strength Index: | 6.1 | -6.2 | -3.7 |
LEAN HOGS Futures:
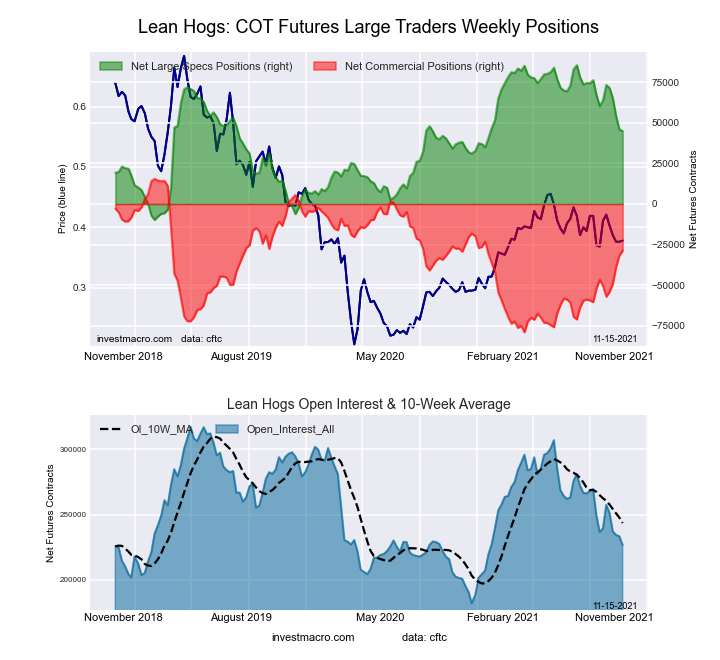 The LEAN HOGS large speculator standing this week totaled a net position of 44,937 contracts in the data reported through Tuesday. This was a weekly decrease of -1,028 contracts from the previous week which had a total of 45,965 net contracts.
This week’s current strength score (the trader positioning range over the past three years, measured from 0 to 100) shows the speculators are currently Bullish with a score of 57.4 percent. The commercials are Bullish with a score of 53.2 percent and the small traders (not shown in chart) are Bearish-Extreme with a score of 5.6 percent.
| LEAN HOGS Futures Statistics | SPECULATORS | COMMERCIALS | SMALL TRADERS |
| – Percent of Open Interest Longs: | 37.7 | 34.0 | 7.3 |
| – Percent of Open Interest Shorts: | 17.9 | 46.7 | 14.4 |
| – Net Position: | 44,937 | -28,767 | -16,170 |
| – Gross Longs: | 85,588 | 77,199 | 16,461 |
| – Gross Shorts: | 40,651 | 105,966 | 32,631 |
| – Long to Short Ratio: | 2.1 to 1 | 0.7 to 1 | 0.5 to 1 |
| NET POSITION TREND: | |||
| – COT Index Score (3 Year Range Pct): | 57.4 | 53.2 | 5.6 |
| – COT Index Reading (3 Year Range): | Bullish | Bullish | Bearish-Extreme |
| NET POSITION MOVEMENT INDEX: | |||
| – 6-Week Change in Strength Index: | -20.0 | 23.0 | -12.2 |
COTTON Futures:
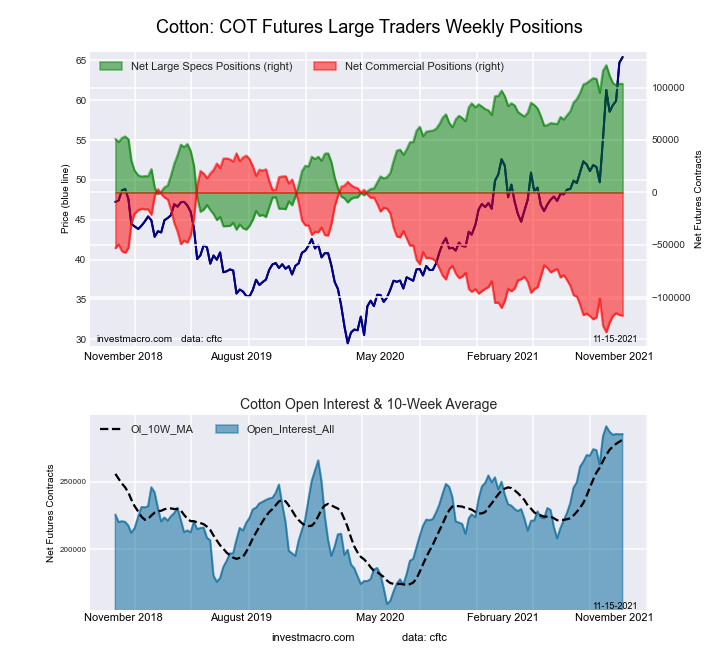 The COTTON large speculator standing this week totaled a net position of 103,513 contracts in the data reported through Tuesday. This was a weekly decline of -40 contracts from the previous week which had a total of 103,553 net contracts.
This week’s current strength score (the trader positioning range over the past three years, measured from 0 to 100) shows the speculators are currently Bullish-Extreme with a score of 88.7 percent. The commercials are Bearish-Extreme with a score of 9.4 percent and the small traders (not shown in chart) are Bullish-Extreme with a score of 99.8 percent.
| COTTON Futures Statistics | SPECULATORS | COMMERCIALS | SMALL TRADERS |
| – Percent of Open Interest Longs: | 40.7 | 38.2 | 8.0 |
| – Percent of Open Interest Shorts: | 4.4 | 79.3 | 3.1 |
| – Net Position: | 103,513 | -117,333 | 13,820 |
| – Gross Longs: | 116,142 | 108,838 | 22,797 |
| – Gross Shorts: | 12,629 | 226,171 | 8,977 |
| – Long to Short Ratio: | 9.2 to 1 | 0.5 to 1 | 2.5 to 1 |
| NET POSITION TREND: | |||
| – COT Index Score (3 Year Range Pct): | 88.7 | 9.4 | 99.8 |
| – COT Index Reading (3 Year Range): | Bullish-Extreme | Bearish-Extreme | Bullish-Extreme |
| NET POSITION MOVEMENT INDEX: | |||
| – 6-Week Change in Strength Index: | -8.1 | 5.7 | 18.0 |
COCOA Futures:
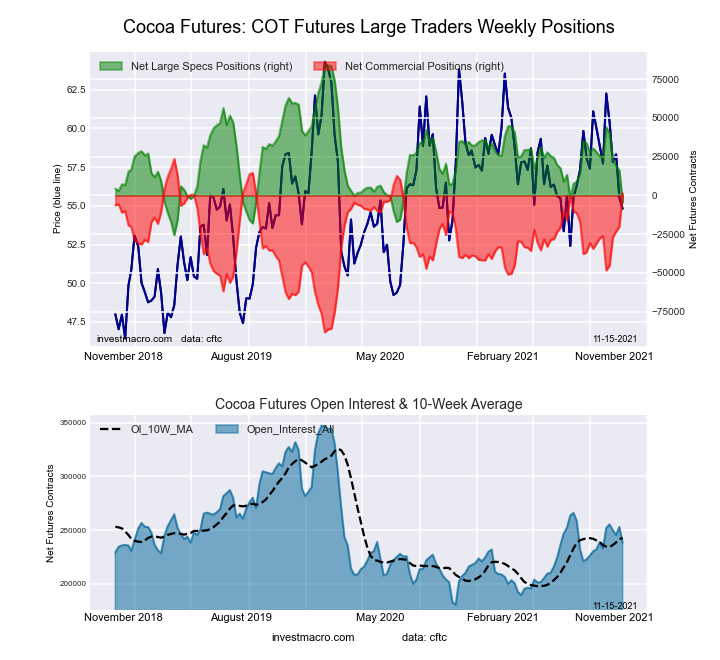 The COCOA large speculator standing this week totaled a net position of -4,621 contracts in the data reported through Tuesday. This was a weekly decrease of -20,695 contracts from the previous week which had a total of 16,074 net contracts.
This week’s current strength score (the trader positioning range over the past three years, measured from 0 to 100) shows the speculators are currently Bearish-Extreme with a score of 19.1 percent. The commercials are Bullish-Extreme with a score of 80.2 percent and the small traders (not shown in chart) are Bearish with a score of 44.7 percent.
| COCOA Futures Statistics | SPECULATORS | COMMERCIALS | SMALL TRADERS |
| – Percent of Open Interest Longs: | 24.0 | 57.8 | 4.9 |
| – Percent of Open Interest Shorts: | 26.0 | 57.2 | 3.6 |
| – Net Position: | -4,621 | 1,434 | 3,187 |
| – Gross Longs: | 57,241 | 137,758 | 11,777 |
| – Gross Shorts: | 61,862 | 136,324 | 8,590 |
| – Long to Short Ratio: | 0.9 to 1 | 1.0 to 1 | 1.4 to 1 |
| NET POSITION TREND: | |||
| – COT Index Score (3 Year Range Pct): | 19.1 | 80.2 | 44.7 |
| – COT Index Reading (3 Year Range): | Bearish-Extreme | Bullish-Extreme | Bearish |
| NET POSITION MOVEMENT INDEX: | |||
| – 6-Week Change in Strength Index: | -26.4 | 24.7 | 14.4 |
WHEAT Futures:
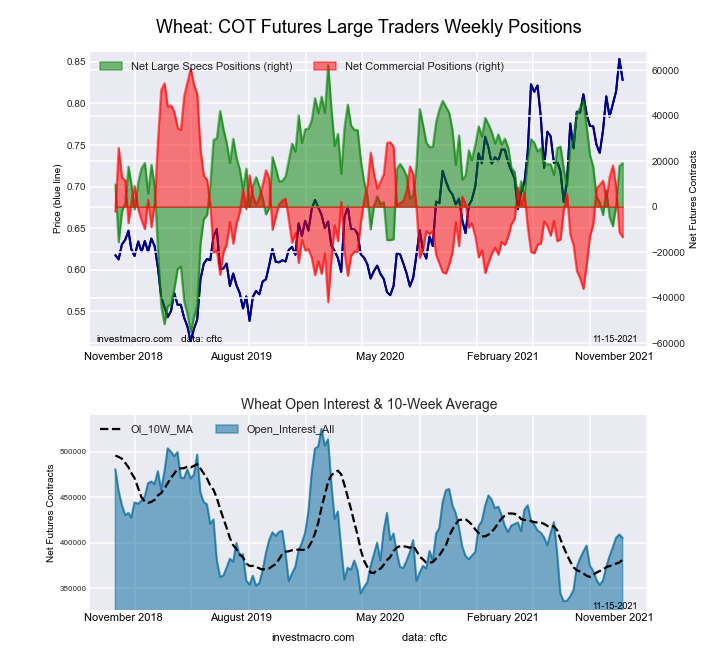 The WHEAT large speculator standing this week totaled a net position of 19,203 contracts in the data reported through Tuesday. This was a weekly lift of 1,307 contracts from the previous week which had a total of 17,896 net contracts.
This week’s current strength score (the trader positioning range over the past three years, measured from 0 to 100) shows the speculators are currently Bullish with a score of 63.4 percent. The commercials are Bearish with a score of 27.8 percent and the small traders (not shown in chart) are Bullish with a score of 73.9 percent.
| WHEAT Futures Statistics | SPECULATORS | COMMERCIALS | SMALL TRADERS |
| – Percent of Open Interest Longs: | 29.0 | 34.4 | 8.7 |
| – Percent of Open Interest Shorts: | 24.2 | 37.7 | 10.2 |
| – Net Position: | 19,203 | -13,409 | -5,794 |
| – Gross Longs: | 117,465 | 139,289 | 35,456 |
| – Gross Shorts: | 98,262 | 152,698 | 41,250 |
| – Long to Short Ratio: | 1.2 to 1 | 0.9 to 1 | 0.9 to 1 |
| NET POSITION TREND: | |||
| – COT Index Score (3 Year Range Pct): | 63.4 | 27.8 | 73.9 |
| – COT Index Reading (3 Year Range): | Bullish | Bearish | Bullish |
| NET POSITION MOVEMENT INDEX: | |||
| – 6-Week Change in Strength Index: | 19.5 | -24.2 | 9.8 |
Article By InvestMacro – Receive our weekly COT Reports by Email
*COT Report: The COT data, released weekly to the public each Friday, is updated through the most recent Tuesday (data is 3 days old) and shows a quick view of how large speculators or non-commercials (for-profit traders) were positioned in the futures markets.
The CFTC categorizes trader positions according to commercial hedgers (traders who use futures contracts for hedging as part of the business), non-commercials (large traders who speculate to realize trading profits) and nonreportable traders (usually small traders/speculators) as well as their open interest (contracts open in the market at time of reporting).See CFTC criteria here.

- COT Metals Charts: Weekly Speculator Bets see small gains for Silver & Gold Jul 12, 2026
- COT Bonds Charts: Speculator Bets led by SOFR 3-Months & 2-Year Bonds Jul 12, 2026
- COT Energy Charts: Weekly Speculator Changes led by Brent Oil Jul 12, 2026
- COT Soft Commodities Charts: Weekly Speculator Changes led by Sugar, Corn & Soybeans Jul 12, 2026
- The US and European stock indices are rising again amid renewed investor interest in the AI industry. Jul 10, 2026
- USD/JPY Falls as Yen Recovers Weekly Losses Jul 10, 2026
- Crude oil prices surged sharply by 7% in reaction to the rapid escalation of the conflict in the Middle East Jul 9, 2026
- Middle East Tensions Weigh on Gold Jul 9, 2026
- Pound Awaits Tighter Policy from Bank of England Jul 8, 2026
- The United States carried out airstrikes on Iran after Iran’s attacked tankers in the Strait of Hormuz. The RBNZ raised the interest rate to 2.5% Jul 8, 2026