By InvestMacro
Here are the latest charts and statistics for the Commitment of Traders (COT) data published by the Commodities Futures Trading Commission (CFTC).
The latest COT data is updated through Tuesday October 11th and shows a quick view of how large market participants (for-profit speculators and commercial traders) were positioned in the futures markets. All currency positions are in direct relation to the US dollar where, for example, a bet for the euro is a bet that the euro will rise versus the dollar while a bet against the euro will be a bet that the euro will decline versus the dollar.
Weekly Speculator Changes led by British pound sterling & Japanese Yen
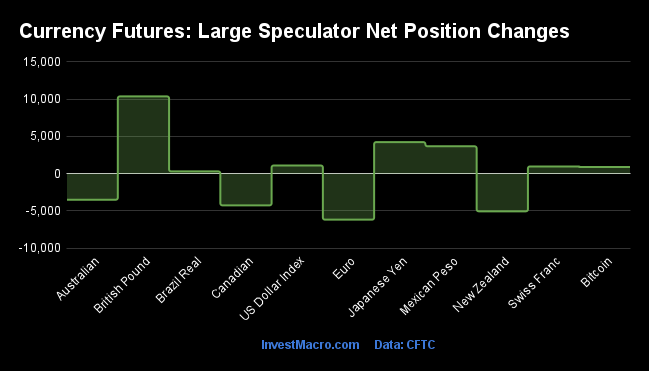
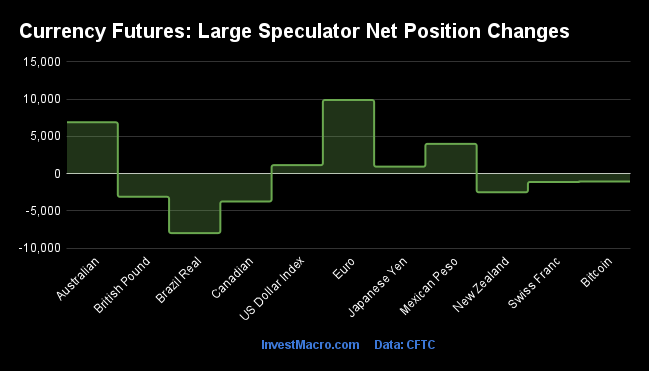
The COT currency market speculator bets were higher this week as seven out of the eleven currency markets we cover had higher positioning while the other four markets had lower speculator contracts.
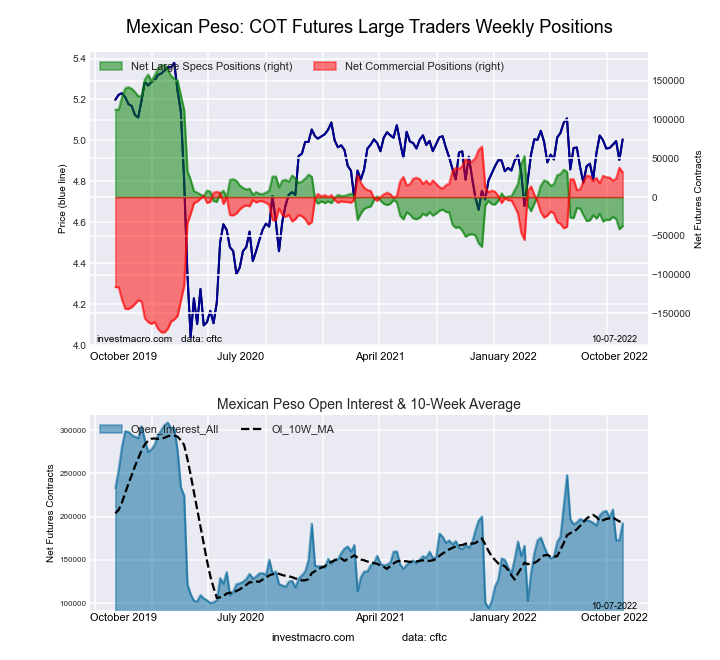
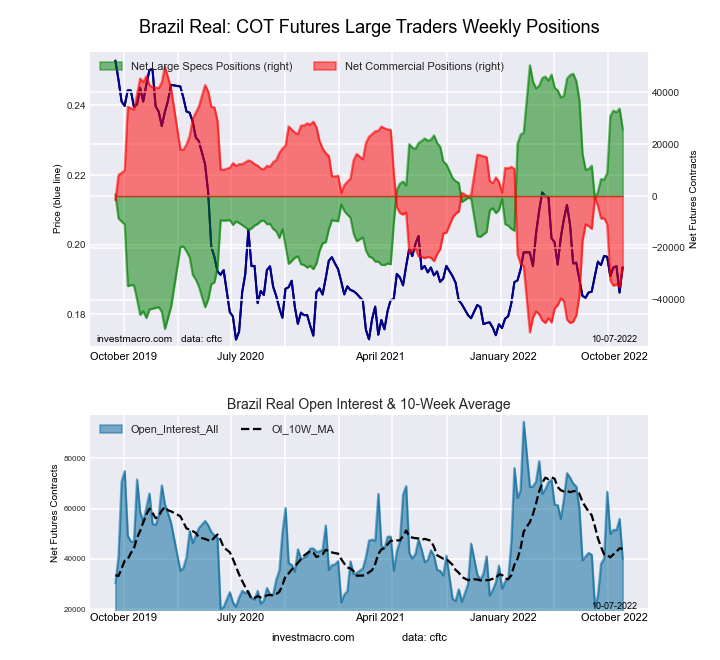
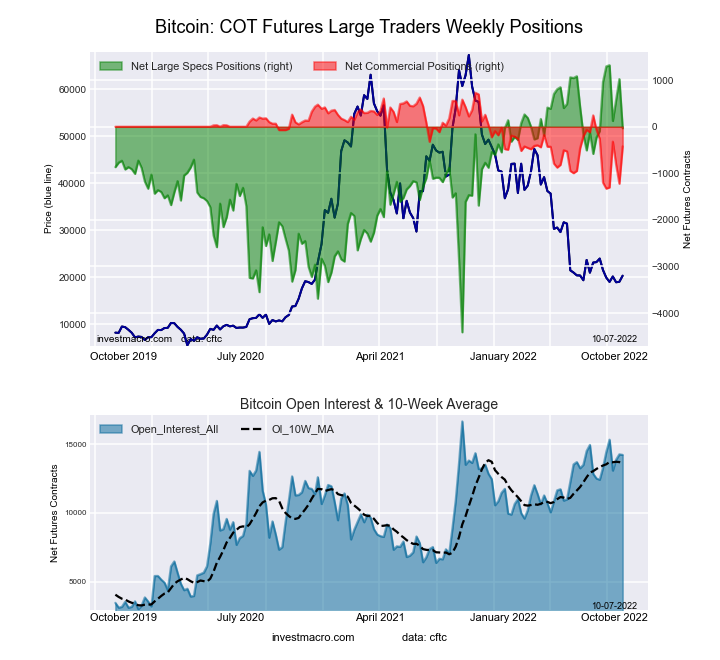
Leading the gains for the currency markets was the British pound sterling (10,369 contracts) with the Japanese yen (4,230 contracts), the Mexican peso (3,667 contracts), the US Dollar Index (1,089 contracts), the Swiss franc (962 contracts), Bitcoin (889 contracts) and the Brazilian real (296 contracts) also showing a positive week.
The currencies leading the declines in speculator bets this week were the Euro (-6,183 contracts) with the New Zealand dollar (-5,064 contracts), the Canadian dollar (-4,265 contracts) and the Australian dollar (-3,507 contracts) also registering lower bets on the week.
Highlighting the COT currencies this week is the weakness for the commodity currencies. The Australian dollar, New Zealand dollar and the Canadian dollar all had lower speculator bets this week and are all firmly in negative territory at the moment.
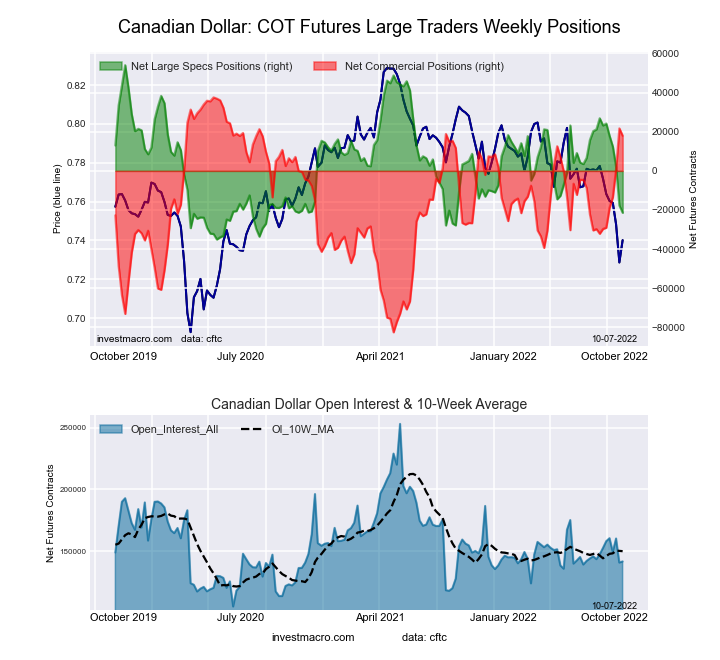
The Canadian dollar speculator positions fell this week for the sixth consecutive week and have declined by a total of -49,851 contracts over that time-period. This recent weakness has brought the CAD bets to their most bearish level in 52 weeks, dating back to October 12th of 2021. The CAD exchange level has been sharply falling as well and dropped this week to its lowest level since May of 2020.
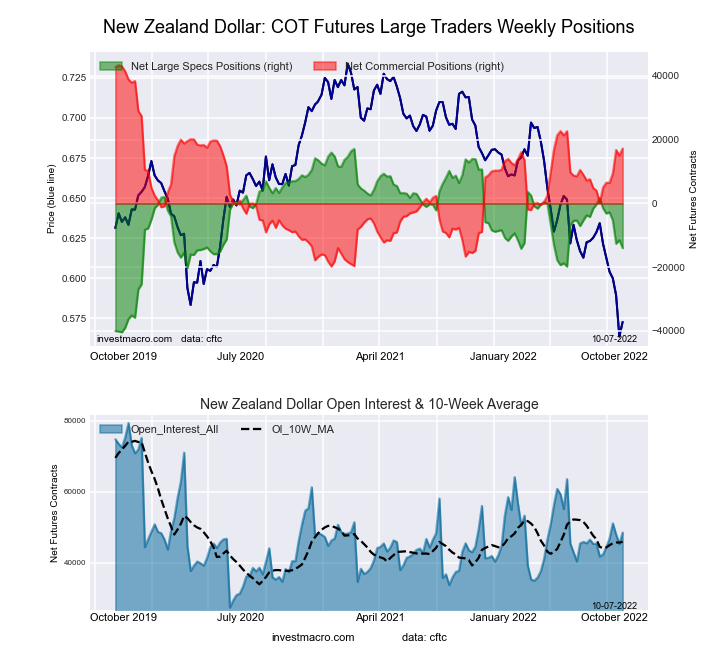
The New Zealand dollar positions declined for the second straight week and for the fourth time in the past five weeks. Speculators have now pushed their overall net positioning (-19,042 contracts) to the most bearish level in the past 18 weeks, dating back to June 7th. NZD spec positions have been bearish for twenty-three out of the last twenty-four weeks. The New Zealand dollar price has been on the defensive and has, in particular, been dropping sharply over the past six weeks (over -500 pips). The NZDUSD currency pair this week also touched the lowest level since the pandemic lows of March 2020 below the 0.5600 exchange rate.
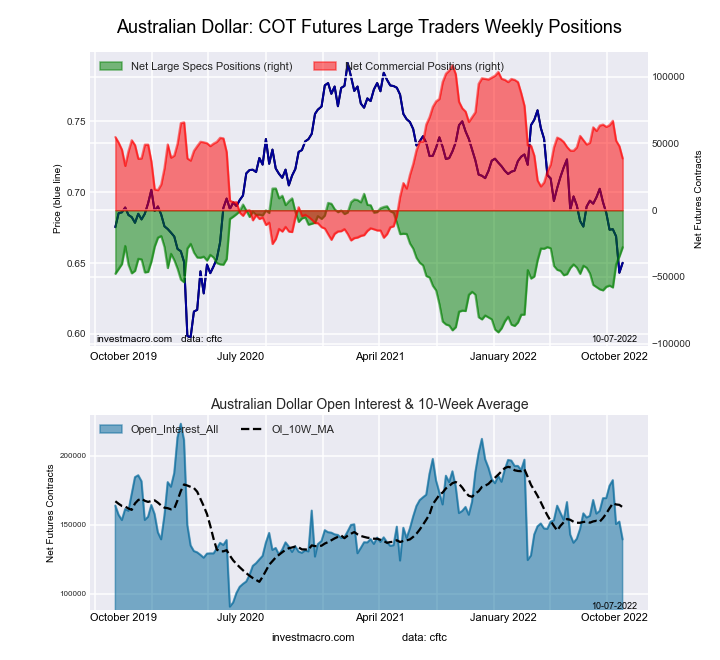
The Australian dollar spec positioning, meanwhile, fell this week for the first time in four weeks. Aussie speculator positions have now been in a continuous bearish level for 73 straight weeks, dating back to May 18th of 2021. Although the current positioning (-31,271 contracts) is near the lower end of the bearish range that has seen levels above -80,000 contracts, the AUD currency price has also been dropping. The AUDUSD currency pair has fallen for five straight weeks and hit its lowest level against the US dollar since April of 2020.
All three of these currencies are currently oversold against the US dollar on the weekly Relative Strength Index (RSI) and worth watching for potential peaks in the weeks and months ahead.
| Oct-11-2022 | OI | OI-Index | Spec-Net | Spec-Index | Com-Net | COM-Index | Smalls-Net | Smalls-Index |
|---|---|---|---|---|---|---|---|---|
| USD Index | 54,615 | 77 | 32,786 | 80 | -36,847 | 17 | 4,061 | 61 |
| EUR | 639,348 | 52 | 37,499 | 47 | -60,161 | 59 | 22,662 | 15 |
| GBP | 255,649 | 71 | -39,170 | 35 | 64,804 | 78 | -25,634 | 8 |
| JPY | 245,007 | 77 | -77,393 | 21 | 94,449 | 82 | -17,056 | 19 |
| CHF | 43,748 | 28 | -5,890 | 42 | 17,983 | 72 | -12,093 | 17 |
| CAD | 144,000 | 26 | -25,672 | 11 | 27,366 | 92 | -1,694 | 27 |
| AUD | 138,320 | 36 | -31,271 | 56 | 42,692 | 51 | -11,421 | 25 |
| NZD | 50,557 | 45 | -19,042 | 37 | 22,517 | 67 | -3,475 | 12 |
| MXN | 206,170 | 52 | -33,654 | 13 | 27,839 | 84 | 5,815 | 68 |
| RUB | 20,930 | 4 | 7,543 | 31 | -7,150 | 69 | -393 | 24 |
| BRL | 41,360 | 28 | 26,075 | 76 | -27,966 | 24 | 1,891 | 87 |
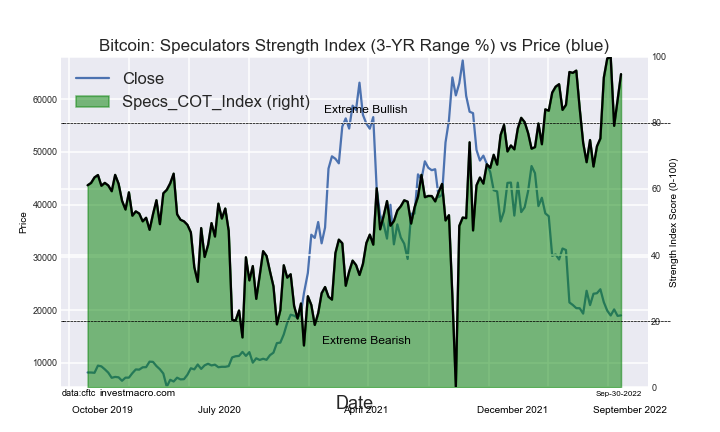
| Bitcoin | 15,756 | 93 | 857 | 92 | -1,077 | 0 | 220 | 18 |
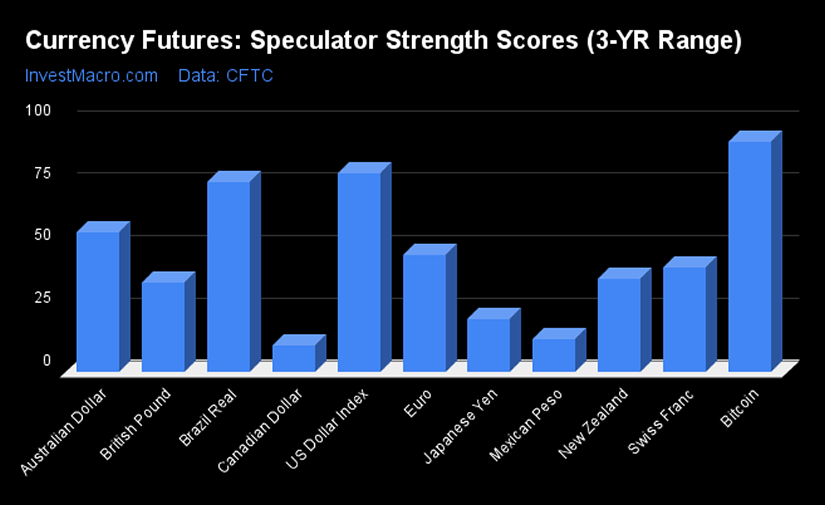
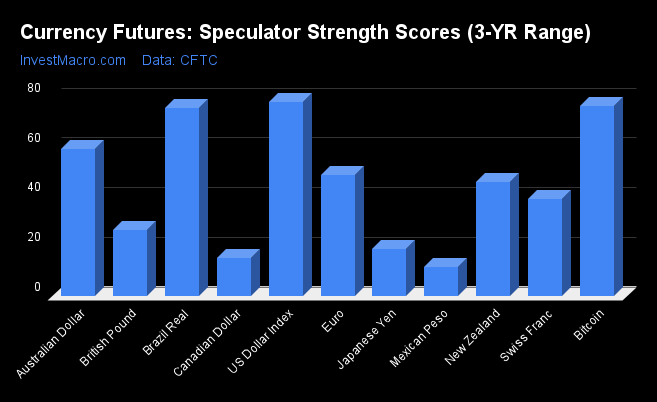
Strength Scores led by Bitcoin, US Dollar Index & Brazilian Real
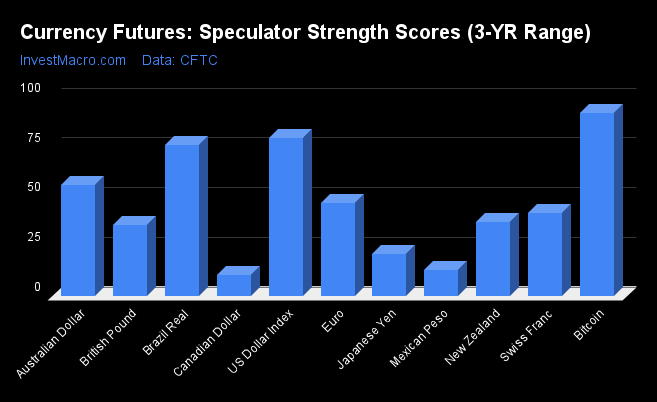
Strength Scores (a normalized measure of Speculator positions over a 3-Year range, from 0 to 100 where above 80 is extreme bullish and below 20 is extreme bearish) showed that Bitcoin (91.9 percent) jumped back to lead the currency markets and is in a bullish extreme position above 80 percent. The US Dollar Index (79.6 percent) and the Brazilian Real (76.0 percent) come in as the next highest in the currency markets for strength scores.
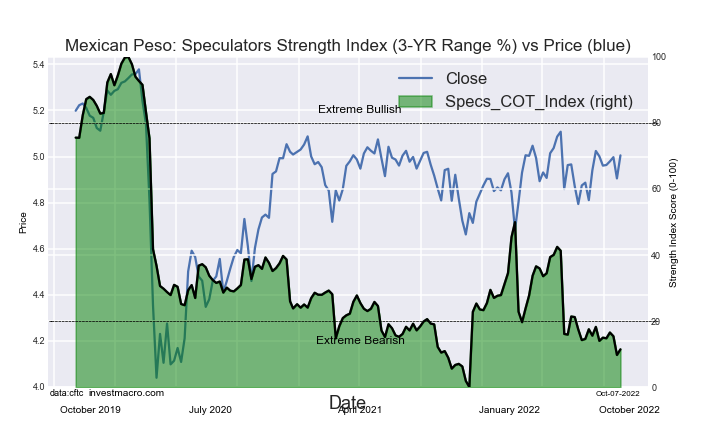
On the downside, the Canadian Dollar (10.5 percent) and the Mexican Peso (13.0 percent) come in at the lowest strength level currently and are both in extreme bearish positions this week.
Strength Statistics:
US Dollar Index (79.6 percent) vs US Dollar Index previous week (77.8 percent)
EuroFX (46.5 percent) vs EuroFX previous week (48.4 percent)
British Pound Sterling (35.4 percent) vs British Pound Sterling previous week (26.5 percent)
Japanese Yen (21.2 percent) vs Japanese Yen previous week (18.6 percent)
Swiss Franc (41.6 percent) vs Swiss Franc previous week (39.1 percent)
Canadian Dollar (10.5 percent) vs Canadian Dollar previous week (15.3 percent)
Australian Dollar (55.8 percent) vs Australian Dollar previous week (59.1 percent)
New Zealand Dollar (37.1 percent) vs New Zealand Dollar previous week (45.9 percent)
Mexican Peso (13.0 percent) vs Mexican Peso previous week (11.4 percent)
Brazilian Real (76.0 percent) vs Brazilian Real previous week (75.7 percent)
Bitcoin (91.9 percent) vs Bitcoin previous week (76.4 percent)
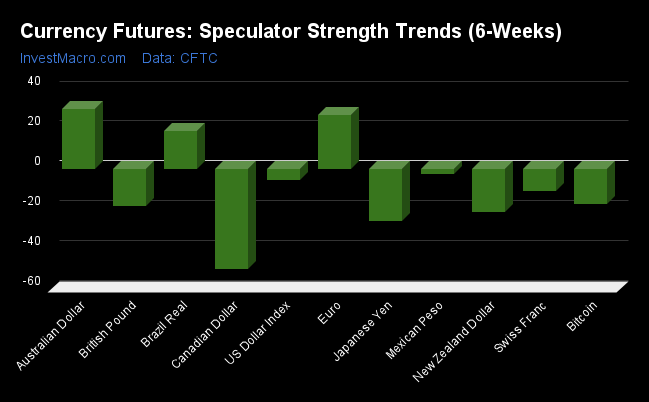
Strength Trends led by EuroFX, Australian Dollar &
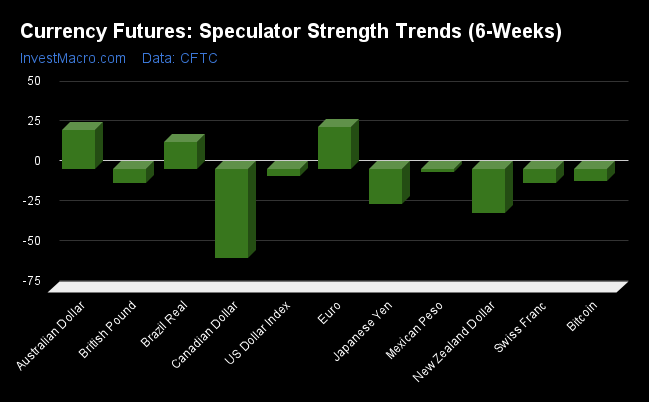
Strength Score Trends (or move index, calculates the 6-week changes in strength scores) show that the EuroFX (26.1 percent) leads the past six weeks trends for the currency markets this week. The Australian Dollar (24.2 percent) and the Brazilian Real (16.9 percent) fill out the next top movers in the latest trends data.
The Canadian Dollar (-56.0 percent) leads the downside trend scores currently while the next markets with lower trend scores were the New Zealand Dollar (-27.7 percent) and the Japanese Yen (-22.1 percent).
Strength Trend Statistics:
US Dollar Index (-4.6 percent) vs US Dollar Index previous week (-5.7 percent)
EuroFX (26.1 percent) vs EuroFX previous week (26.9 percent)
British Pound Sterling (-8.6 percent) vs British Pound Sterling previous week (-18.5 percent)
Japanese Yen (-22.1 percent) vs Japanese Yen previous week (-26.4 percent)
Swiss Franc (-9.2 percent) vs Swiss Franc previous week (-11.3 percent)
Canadian Dollar (-56.0 percent) vs Canadian Dollar previous week (-50.1 percent)
Australian Dollar (24.2 percent) vs Australian Dollar previous week (29.9 percent)
New Zealand Dollar (-27.7 percent) vs New Zealand Dollar previous week (-21.7 percent)
Mexican Peso (-2.0 percent) vs Mexican Peso previous week (-2.6 percent)
Brazilian Real (16.9 percent) vs Brazilian Real previous week (19.1 percent)
Bitcoin (-7.7 percent) vs Bitcoin previous week (-17.4 percent)
Individual COT Forex Markets:
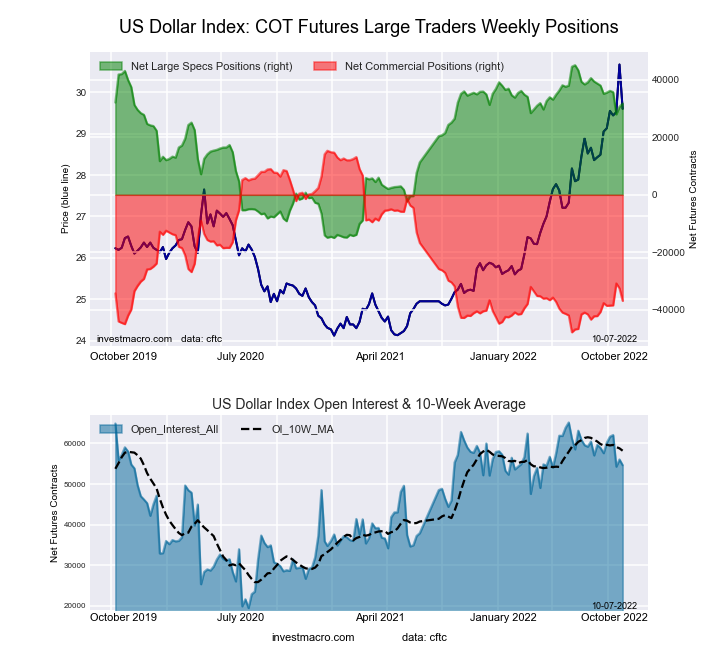
US Dollar Index Futures:
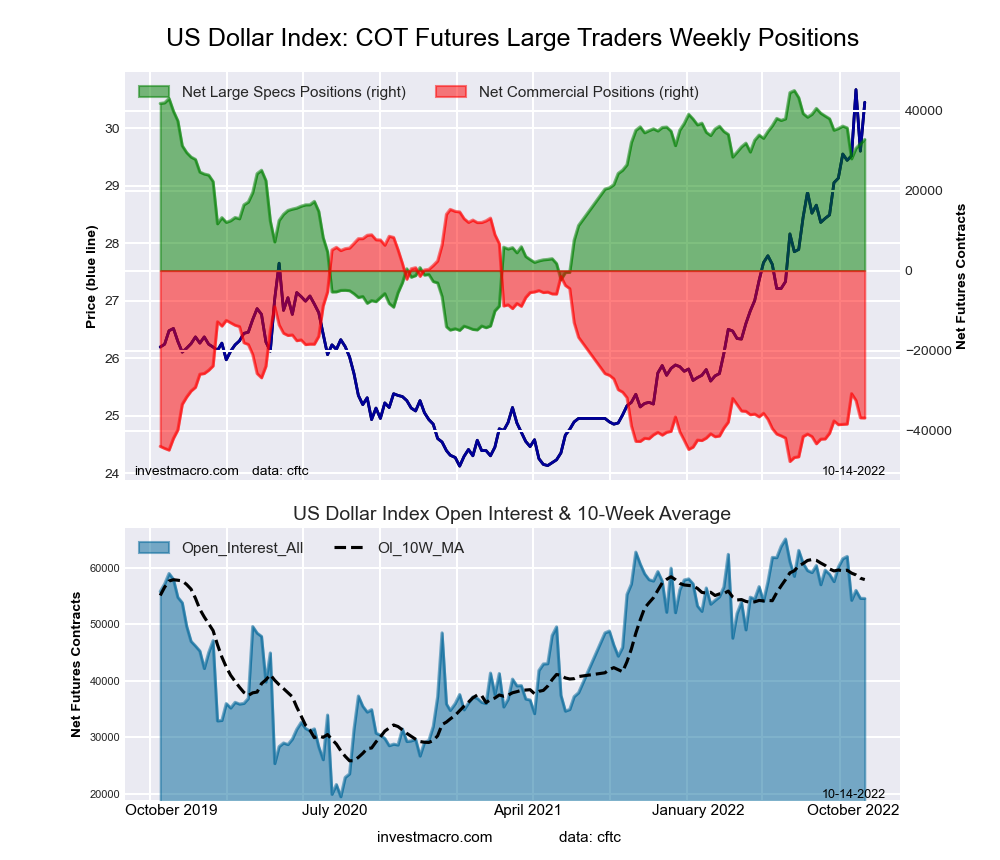 The US Dollar Index large speculator standing this week totaled a net position of 32,786 contracts in the data reported through Tuesday. This was a weekly lift of 1,089 contracts from the previous week which had a total of 31,697 net contracts.
This week’s current strength score (the trader positioning range over the past three years, measured from 0 to 100) shows the speculators are currently Bullish with a score of 79.6 percent. The commercials are Bearish-Extreme with a score of 17.3 percent and the small traders (not shown in chart) are Bullish with a score of 60.9 percent.
| US DOLLAR INDEX Statistics | SPECULATORS | COMMERCIALS | SMALL TRADERS |
| – Percent of Open Interest Longs: | 82.5 | 3.1 | 12.0 |
| – Percent of Open Interest Shorts: | 22.5 | 70.6 | 4.6 |
| – Net Position: | 32,786 | -36,847 | 4,061 |
| – Gross Longs: | 45,079 | 1,708 | 6,563 |
| – Gross Shorts: | 12,293 | 38,555 | 2,502 |
| – Long to Short Ratio: | 3.7 to 1 | 0.0 to 1 | 2.6 to 1 |
| NET POSITION TREND: | |||
| – Strength Index Score (3 Year Range Pct): | 79.6 | 17.3 | 60.9 |
| – Strength Index Reading (3 Year Range): | Bullish | Bearish-Extreme | Bullish |
| NET POSITION MOVEMENT INDEX: | |||
| – 6-Week Change in Strength Index: | -4.6 | 2.7 | 11.4 |
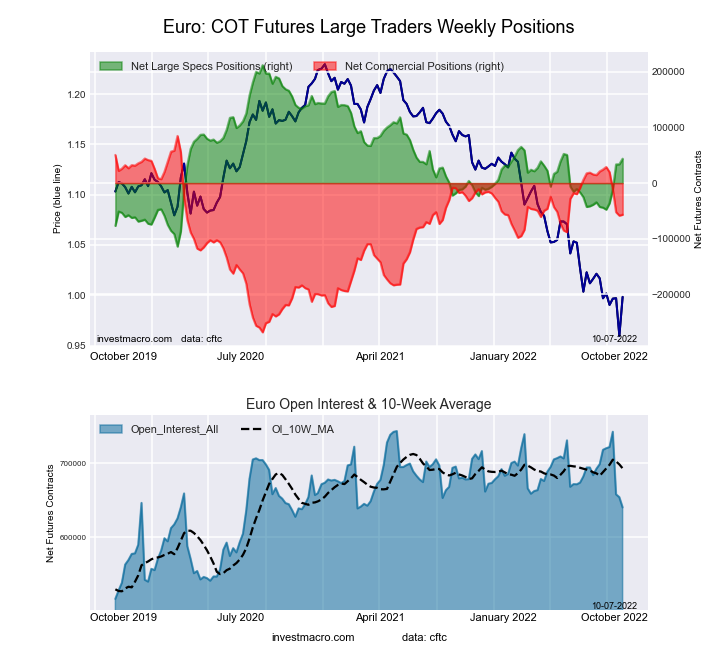
Euro Currency Futures:
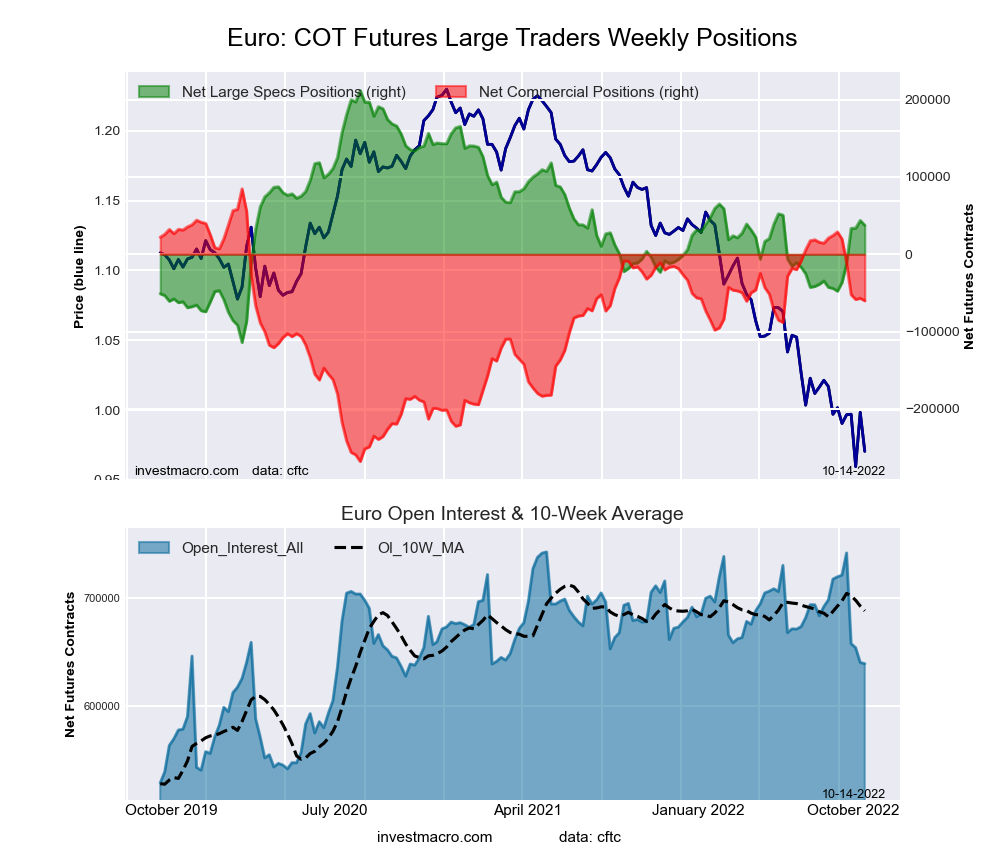 The Euro Currency large speculator standing this week totaled a net position of 37,499 contracts in the data reported through Tuesday. This was a weekly decline of -6,183 contracts from the previous week which had a total of 43,682 net contracts.
This week’s current strength score (the trader positioning range over the past three years, measured from 0 to 100) shows the speculators are currently Bearish with a score of 46.5 percent. The commercials are Bullish with a score of 59.0 percent and the small traders (not shown in chart) are Bearish-Extreme with a score of 15.1 percent.
| EURO Currency Statistics | SPECULATORS | COMMERCIALS | SMALL TRADERS |
| – Percent of Open Interest Longs: | 30.7 | 54.6 | 12.0 |
| – Percent of Open Interest Shorts: | 24.8 | 64.0 | 8.4 |
| – Net Position: | 37,499 | -60,161 | 22,662 |
| – Gross Longs: | 196,136 | 349,091 | 76,656 |
| – Gross Shorts: | 158,637 | 409,252 | 53,994 |
| – Long to Short Ratio: | 1.2 to 1 | 0.9 to 1 | 1.4 to 1 |
| NET POSITION TREND: | |||
| – Strength Index Score (3 Year Range Pct): | 46.5 | 59.0 | 15.1 |
| – Strength Index Reading (3 Year Range): | Bearish | Bullish | Bearish-Extreme |
| NET POSITION MOVEMENT INDEX: | |||
| – 6-Week Change in Strength Index: | 26.1 | -25.3 | 6.1 |
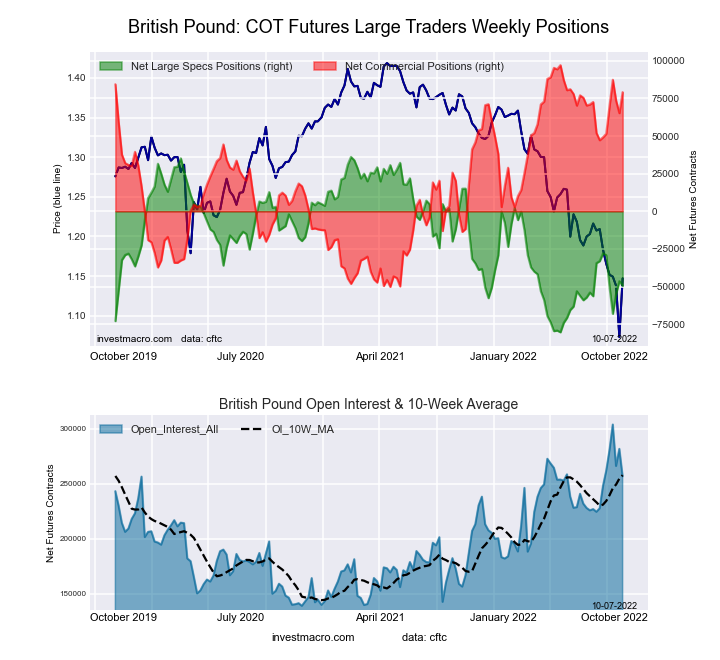
British Pound Sterling Futures:
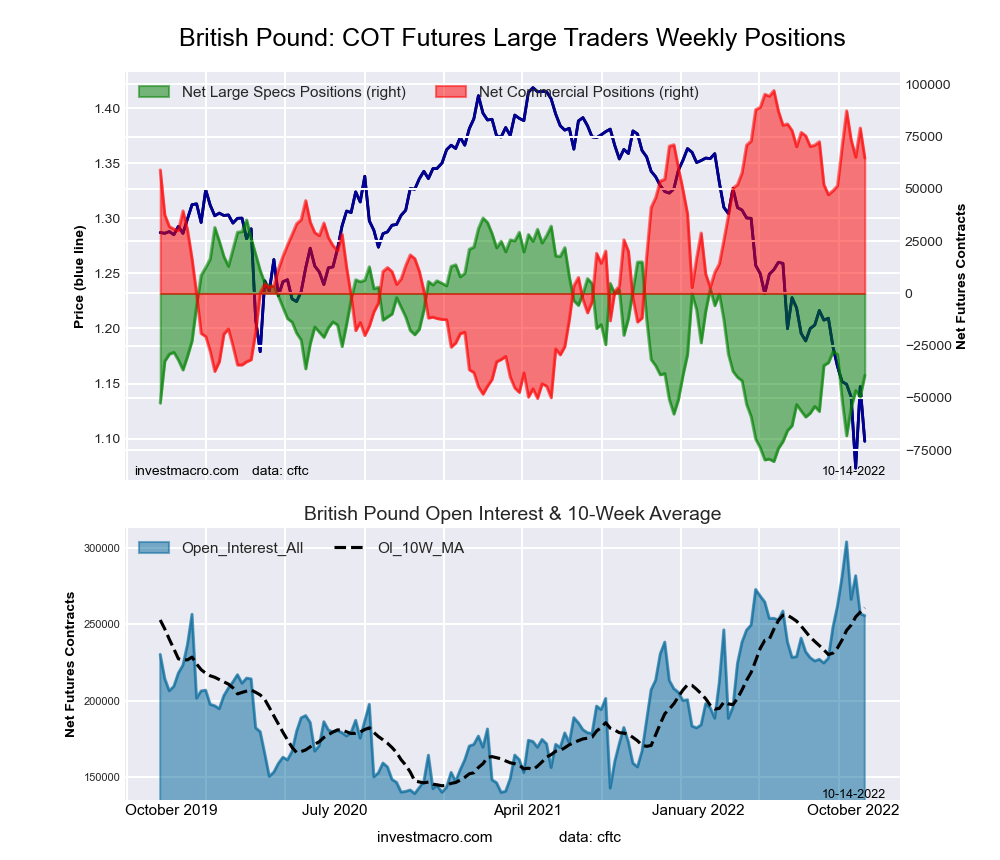 The British Pound Sterling large speculator standing this week totaled a net position of -39,170 contracts in the data reported through Tuesday. This was a weekly advance of 10,369 contracts from the previous week which had a total of -49,539 net contracts.
This week’s current strength score (the trader positioning range over the past three years, measured from 0 to 100) shows the speculators are currently Bearish with a score of 35.4 percent. The commercials are Bullish with a score of 78.1 percent and the small traders (not shown in chart) are Bearish-Extreme with a score of 7.7 percent.
| BRITISH POUND Statistics | SPECULATORS | COMMERCIALS | SMALL TRADERS |
| – Percent of Open Interest Longs: | 19.2 | 70.3 | 7.7 |
| – Percent of Open Interest Shorts: | 34.5 | 44.9 | 17.7 |
| – Net Position: | -39,170 | 64,804 | -25,634 |
| – Gross Longs: | 48,979 | 179,700 | 19,620 |
| – Gross Shorts: | 88,149 | 114,896 | 45,254 |
| – Long to Short Ratio: | 0.6 to 1 | 1.6 to 1 | 0.4 to 1 |
| NET POSITION TREND: | |||
| – Strength Index Score (3 Year Range Pct): | 35.4 | 78.1 | 7.7 |
| – Strength Index Reading (3 Year Range): | Bearish | Bullish | Bearish-Extreme |
| NET POSITION MOVEMENT INDEX: | |||
| – 6-Week Change in Strength Index: | -8.6 | 9.0 | -6.5 |
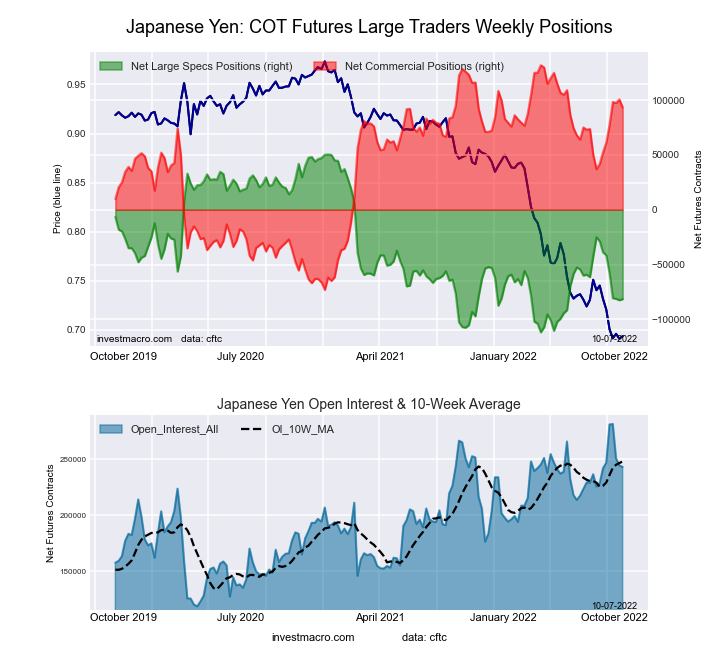
Japanese Yen Futures:
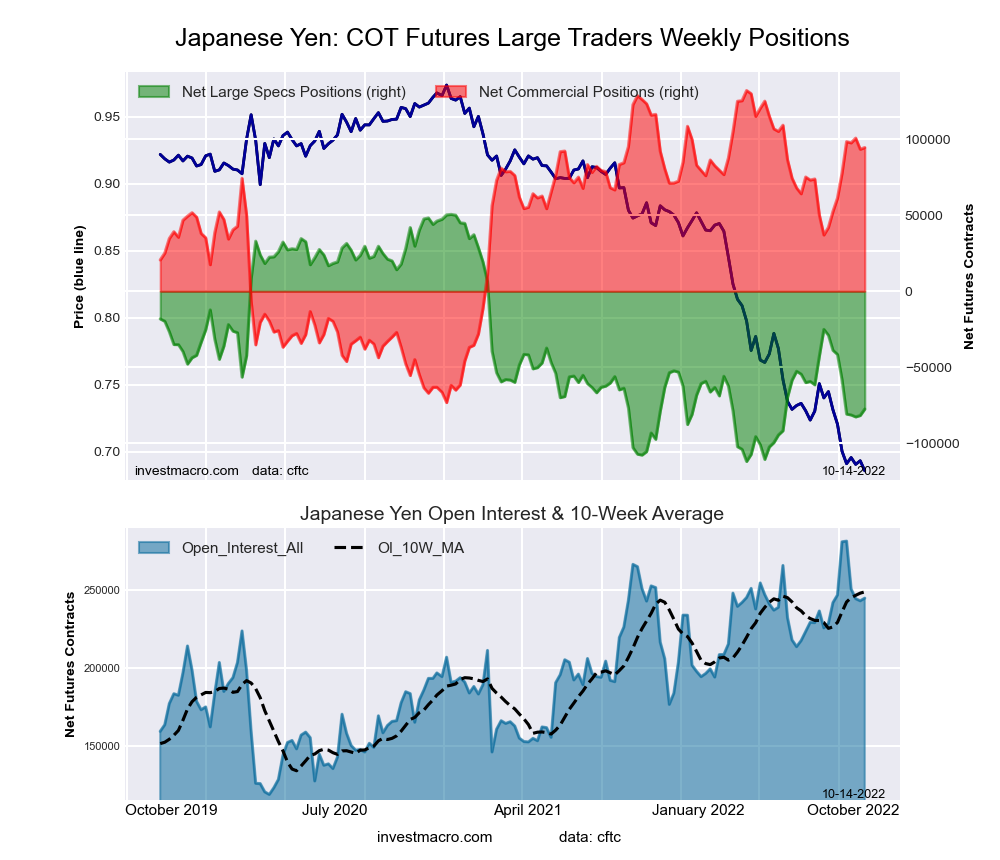 The Japanese Yen large speculator standing this week totaled a net position of -77,393 contracts in the data reported through Tuesday. This was a weekly advance of 4,230 contracts from the previous week which had a total of -81,623 net contracts.
This week’s current strength score (the trader positioning range over the past three years, measured from 0 to 100) shows the speculators are currently Bearish with a score of 21.2 percent. The commercials are Bullish-Extreme with a score of 81.7 percent and the small traders (not shown in chart) are Bearish-Extreme with a score of 18.8 percent.
| JAPANESE YEN Statistics | SPECULATORS | COMMERCIALS | SMALL TRADERS |
| – Percent of Open Interest Longs: | 12.3 | 76.4 | 10.0 |
| – Percent of Open Interest Shorts: | 43.9 | 37.8 | 17.0 |
| – Net Position: | -77,393 | 94,449 | -17,056 |
| – Gross Longs: | 30,149 | 187,119 | 24,526 |
| – Gross Shorts: | 107,542 | 92,670 | 41,582 |
| – Long to Short Ratio: | 0.3 to 1 | 2.0 to 1 | 0.6 to 1 |
| NET POSITION TREND: | |||
| – Strength Index Score (3 Year Range Pct): | 21.2 | 81.7 | 18.8 |
| – Strength Index Reading (3 Year Range): | Bearish | Bullish-Extreme | Bearish-Extreme |
| NET POSITION MOVEMENT INDEX: | |||
| – 6-Week Change in Strength Index: | -22.1 | 16.2 | 5.5 |
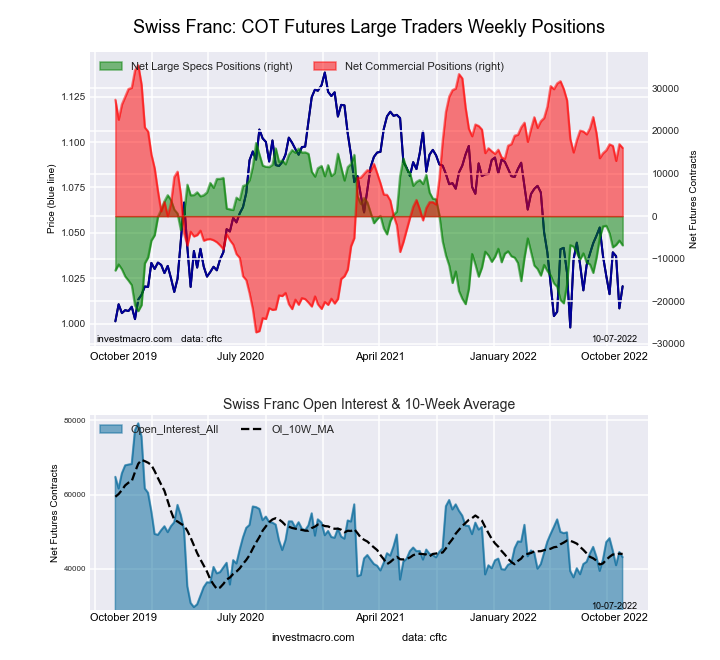
Swiss Franc Futures:
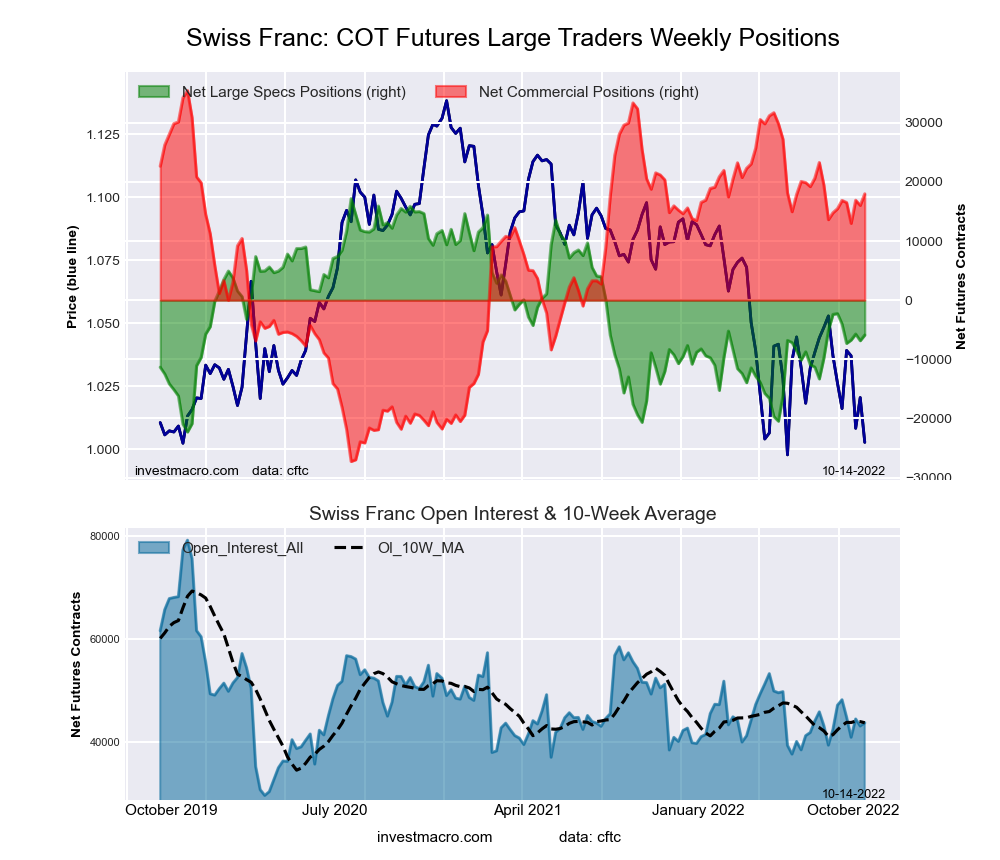 The Swiss Franc large speculator standing this week totaled a net position of -5,890 contracts in the data reported through Tuesday. This was a weekly boost of 962 contracts from the previous week which had a total of -6,852 net contracts.
This week’s current strength score (the trader positioning range over the past three years, measured from 0 to 100) shows the speculators are currently Bearish with a score of 41.6 percent. The commercials are Bullish with a score of 72.2 percent and the small traders (not shown in chart) are Bearish-Extreme with a score of 16.6 percent.
| SWISS FRANC Statistics | SPECULATORS | COMMERCIALS | SMALL TRADERS |
| – Percent of Open Interest Longs: | 12.6 | 67.3 | 20.0 |
| – Percent of Open Interest Shorts: | 26.0 | 26.2 | 47.7 |
| – Net Position: | -5,890 | 17,983 | -12,093 |
| – Gross Longs: | 5,501 | 29,436 | 8,770 |
| – Gross Shorts: | 11,391 | 11,453 | 20,863 |
| – Long to Short Ratio: | 0.5 to 1 | 2.6 to 1 | 0.4 to 1 |
| NET POSITION TREND: | |||
| – Strength Index Score (3 Year Range Pct): | 41.6 | 72.2 | 16.6 |
| – Strength Index Reading (3 Year Range): | Bearish | Bullish | Bearish-Extreme |
| NET POSITION MOVEMENT INDEX: | |||
| – 6-Week Change in Strength Index: | -9.2 | 4.0 | 3.8 |
Canadian Dollar Futures:
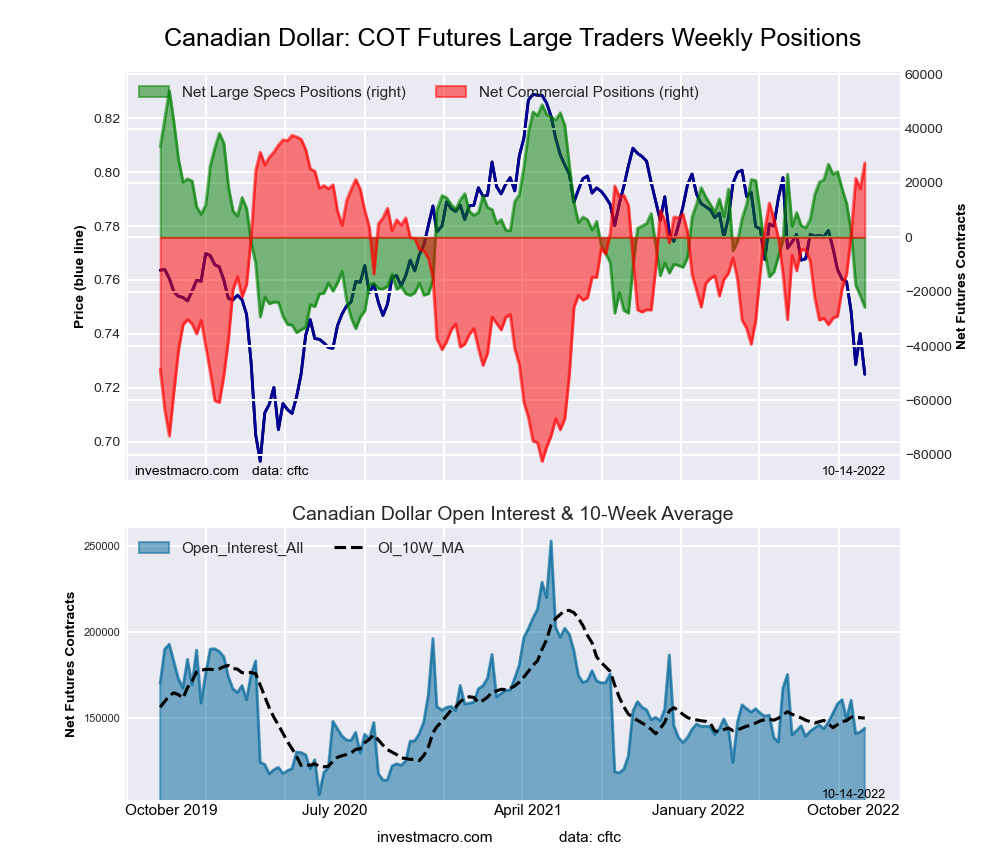 The Canadian Dollar large speculator standing this week totaled a net position of -25,672 contracts in the data reported through Tuesday. This was a weekly decline of -4,265 contracts from the previous week which had a total of -21,407 net contracts.
This week’s current strength score (the trader positioning range over the past three years, measured from 0 to 100) shows the speculators are currently Bearish-Extreme with a score of 10.5 percent. The commercials are Bullish-Extreme with a score of 91.5 percent and the small traders (not shown in chart) are Bearish with a score of 26.7 percent.
| CANADIAN DOLLAR Statistics | SPECULATORS | COMMERCIALS | SMALL TRADERS |
| – Percent of Open Interest Longs: | 22.6 | 54.1 | 21.6 |
| – Percent of Open Interest Shorts: | 40.4 | 35.1 | 22.8 |
| – Net Position: | -25,672 | 27,366 | -1,694 |
| – Gross Longs: | 32,476 | 77,929 | 31,136 |
| – Gross Shorts: | 58,148 | 50,563 | 32,830 |
| – Long to Short Ratio: | 0.6 to 1 | 1.5 to 1 | 0.9 to 1 |
| NET POSITION TREND: | |||
| – Strength Index Score (3 Year Range Pct): | 10.5 | 91.5 | 26.7 |
| – Strength Index Reading (3 Year Range): | Bearish-Extreme | Bullish-Extreme | Bearish |
| NET POSITION MOVEMENT INDEX: | |||
| – 6-Week Change in Strength Index: | -56.0 | 47.0 | -13.2 |
Australian Dollar Futures:
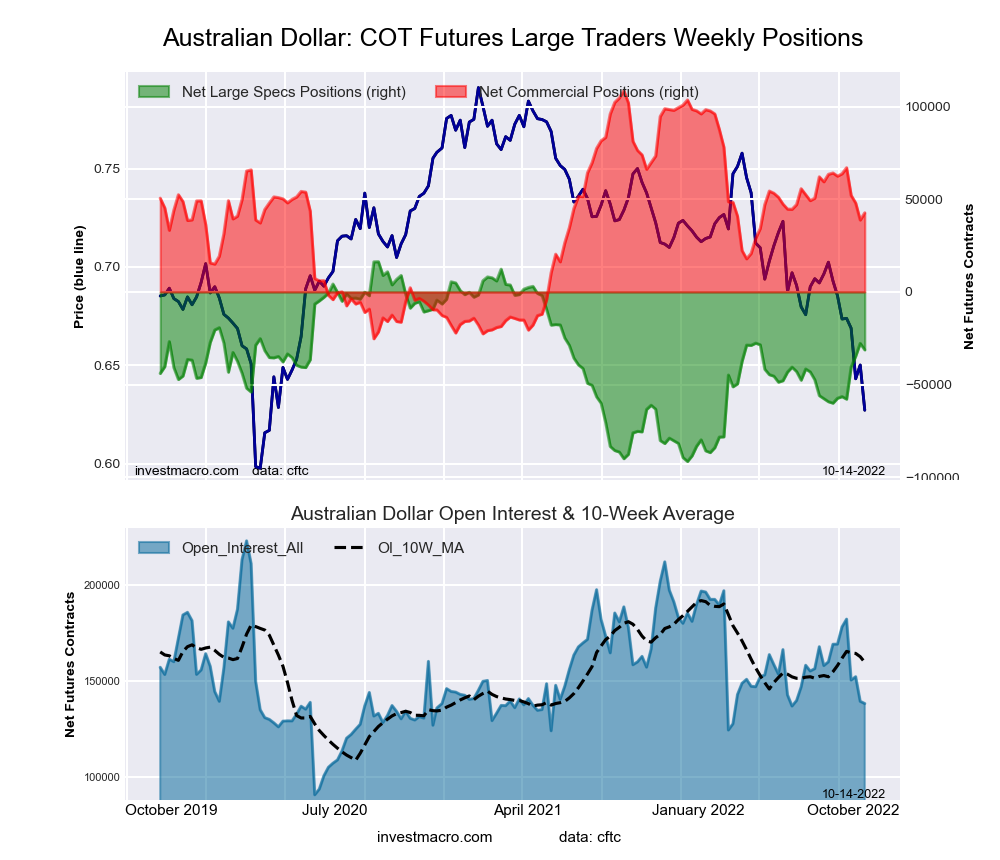 The Australian Dollar large speculator standing this week totaled a net position of -31,271 contracts in the data reported through Tuesday. This was a weekly decrease of -3,507 contracts from the previous week which had a total of -27,764 net contracts.
This week’s current strength score (the trader positioning range over the past three years, measured from 0 to 100) shows the speculators are currently Bullish with a score of 55.8 percent. The commercials are Bullish with a score of 50.7 percent and the small traders (not shown in chart) are Bearish with a score of 24.6 percent.
| AUSTRALIAN DOLLAR Statistics | SPECULATORS | COMMERCIALS | SMALL TRADERS |
| – Percent of Open Interest Longs: | 21.2 | 62.5 | 13.2 |
| – Percent of Open Interest Shorts: | 43.8 | 31.7 | 21.4 |
| – Net Position: | -31,271 | 42,692 | -11,421 |
| – Gross Longs: | 29,325 | 86,475 | 18,245 |
| – Gross Shorts: | 60,596 | 43,783 | 29,666 |
| – Long to Short Ratio: | 0.5 to 1 | 2.0 to 1 | 0.6 to 1 |
| NET POSITION TREND: | |||
| – Strength Index Score (3 Year Range Pct): | 55.8 | 50.7 | 24.6 |
| – Strength Index Reading (3 Year Range): | Bullish | Bullish | Bearish |
| NET POSITION MOVEMENT INDEX: | |||
| – 6-Week Change in Strength Index: | 24.2 | -14.8 | -15.4 |
New Zealand Dollar Futures:
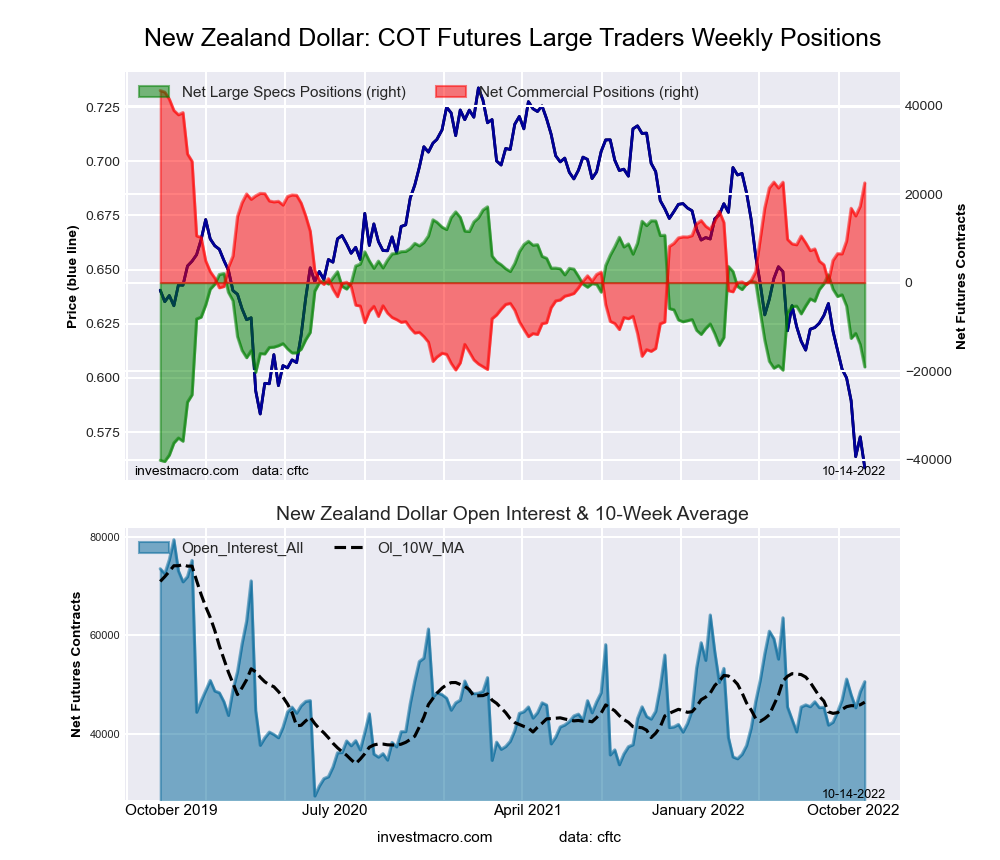 The New Zealand Dollar large speculator standing this week totaled a net position of -19,042 contracts in the data reported through Tuesday. This was a weekly decline of -5,064 contracts from the previous week which had a total of -13,978 net contracts.
This week’s current strength score (the trader positioning range over the past three years, measured from 0 to 100) shows the speculators are currently Bearish with a score of 37.1 percent. The commercials are Bullish with a score of 66.9 percent and the small traders (not shown in chart) are Bearish-Extreme with a score of 11.7 percent.
| NEW ZEALAND DOLLAR Statistics | SPECULATORS | COMMERCIALS | SMALL TRADERS |
| – Percent of Open Interest Longs: | 23.5 | 70.9 | 5.5 |
| – Percent of Open Interest Shorts: | 61.2 | 26.3 | 12.4 |
| – Net Position: | -19,042 | 22,517 | -3,475 |
| – Gross Longs: | 11,894 | 35,834 | 2,771 |
| – Gross Shorts: | 30,936 | 13,317 | 6,246 |
| – Long to Short Ratio: | 0.4 to 1 | 2.7 to 1 | 0.4 to 1 |
| NET POSITION TREND: | |||
| – Strength Index Score (3 Year Range Pct): | 37.1 | 66.9 | 11.7 |
| – Strength Index Reading (3 Year Range): | Bearish | Bullish | Bearish-Extreme |
| NET POSITION MOVEMENT INDEX: | |||
| – 6-Week Change in Strength Index: | -27.7 | 25.3 | -0.8 |
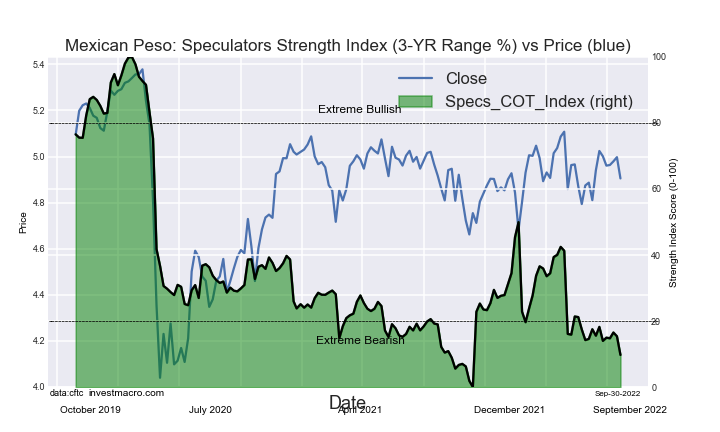
Mexican Peso Futures:
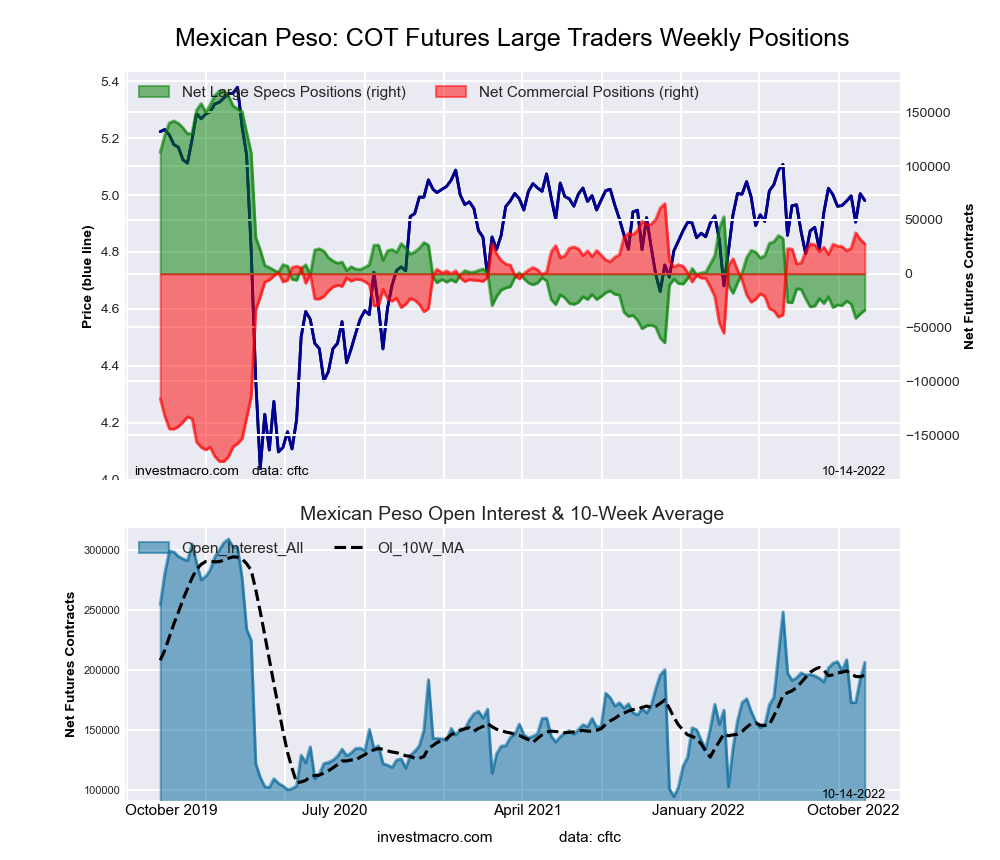 The Mexican Peso large speculator standing this week totaled a net position of -33,654 contracts in the data reported through Tuesday. This was a weekly gain of 3,667 contracts from the previous week which had a total of -37,321 net contracts.
This week’s current strength score (the trader positioning range over the past three years, measured from 0 to 100) shows the speculators are currently Bearish-Extreme with a score of 13.0 percent. The commercials are Bullish-Extreme with a score of 84.4 percent and the small traders (not shown in chart) are Bullish with a score of 67.7 percent.
| MEXICAN PESO Statistics | SPECULATORS | COMMERCIALS | SMALL TRADERS |
| – Percent of Open Interest Longs: | 58.3 | 37.5 | 4.0 |
| – Percent of Open Interest Shorts: | 74.6 | 24.0 | 1.2 |
| – Net Position: | -33,654 | 27,839 | 5,815 |
| – Gross Longs: | 120,239 | 77,393 | 8,294 |
| – Gross Shorts: | 153,893 | 49,554 | 2,479 |
| – Long to Short Ratio: | 0.8 to 1 | 1.6 to 1 | 3.3 to 1 |
| NET POSITION TREND: | |||
| – Strength Index Score (3 Year Range Pct): | 13.0 | 84.4 | 67.7 |
| – Strength Index Reading (3 Year Range): | Bearish-Extreme | Bullish-Extreme | Bullish |
| NET POSITION MOVEMENT INDEX: | |||
| – 6-Week Change in Strength Index: | -2.0 | 0.9 | 10.8 |
Brazilian Real Futures:
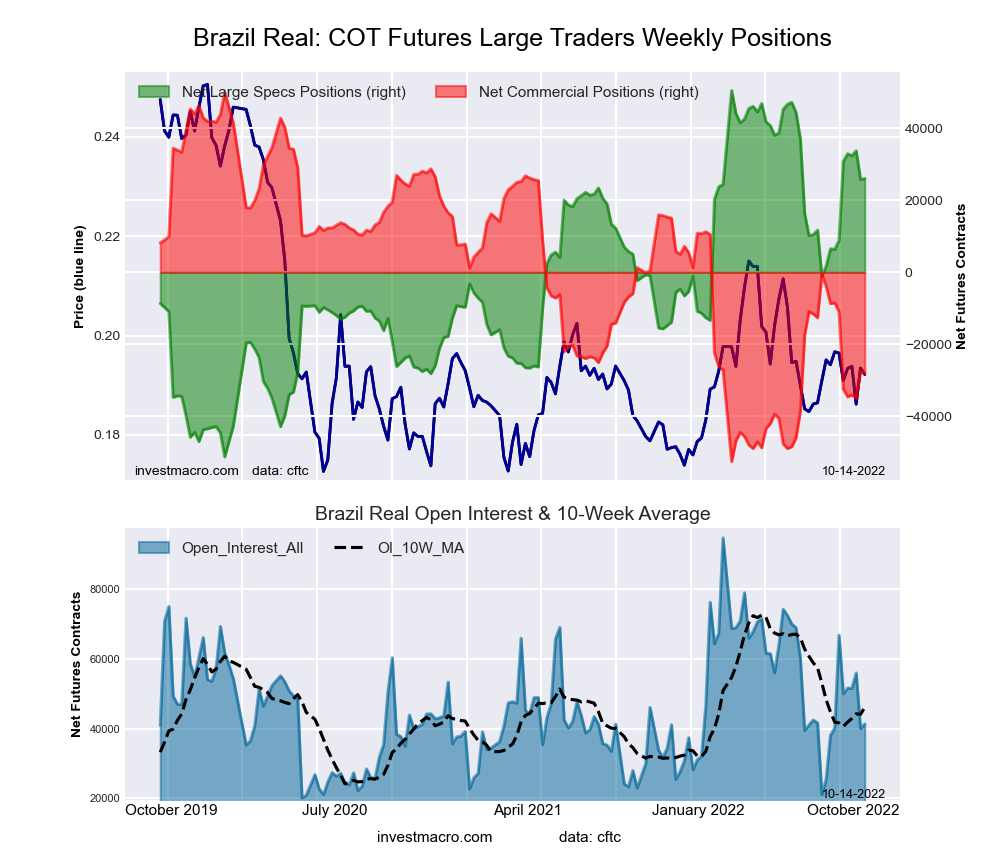 The Brazilian Real large speculator standing this week totaled a net position of 26,075 contracts in the data reported through Tuesday. This was a weekly increase of 296 contracts from the previous week which had a total of 25,779 net contracts.
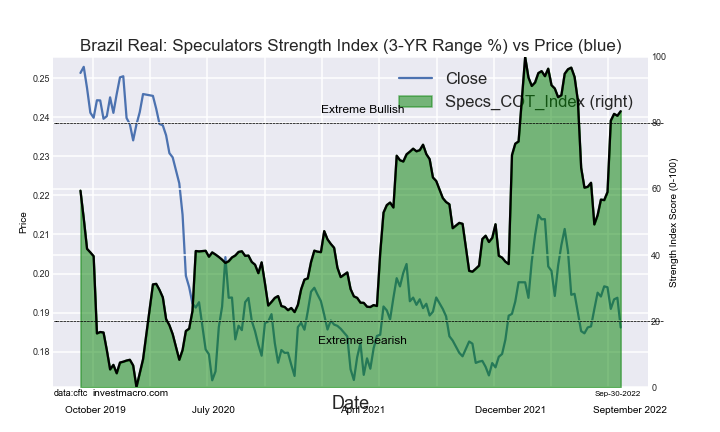
This week’s current strength score (the trader positioning range over the past three years, measured from 0 to 100) shows the speculators are currently Bullish with a score of 76.0 percent. The commercials are Bearish with a score of 24.0 percent and the small traders (not shown in chart) are Bullish-Extreme with a score of 86.9 percent.
| BRAZIL REAL Statistics | SPECULATORS | COMMERCIALS | SMALL TRADERS |
| – Percent of Open Interest Longs: | 69.7 | 21.0 | 7.7 |
| – Percent of Open Interest Shorts: | 6.7 | 88.6 | 3.1 |
| – Net Position: | 26,075 | -27,966 | 1,891 |
| – Gross Longs: | 28,829 | 8,697 | 3,182 |
| – Gross Shorts: | 2,754 | 36,663 | 1,291 |
| – Long to Short Ratio: | 10.5 to 1 | 0.2 to 1 | 2.5 to 1 |
| NET POSITION TREND: | |||
| – Strength Index Score (3 Year Range Pct): | 76.0 | 24.0 | 86.9 |
| – Strength Index Reading (3 Year Range): | Bullish | Bearish | Bullish-Extreme |
| NET POSITION MOVEMENT INDEX: | |||
| – 6-Week Change in Strength Index: | 16.9 | -16.6 | -2.0 |
Bitcoin Futures:
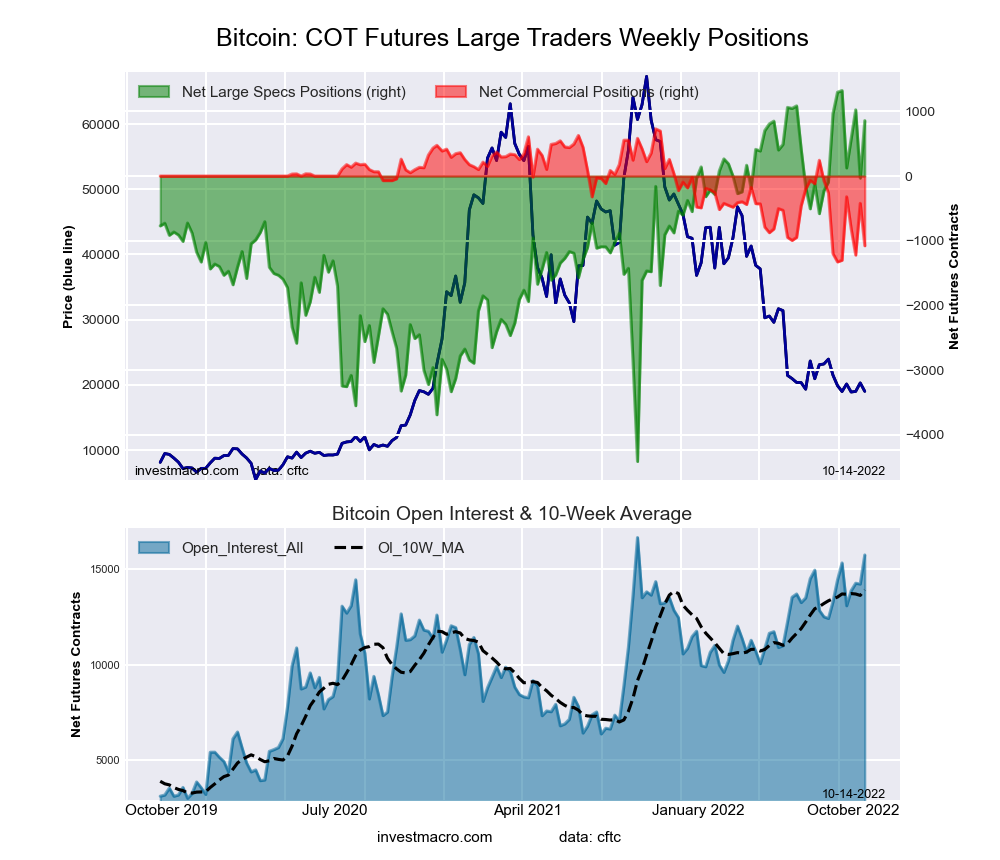 The Bitcoin large speculator standing this week totaled a net position of 857 contracts in the data reported through Tuesday. This was a weekly increase of 889 contracts from the previous week which had a total of -32 net contracts.
This week’s current strength score (the trader positioning range over the past three years, measured from 0 to 100) shows the speculators are currently Bullish-Extreme with a score of 91.9 percent. The commercials are Bearish-Extreme with a score of 12.2 percent and the small traders (not shown in chart) are Bearish-Extreme with a score of 17.9 percent.
| BITCOIN Statistics | SPECULATORS | COMMERCIALS | SMALL TRADERS |
| – Percent of Open Interest Longs: | 80.6 | 0.2 | 6.4 |
| – Percent of Open Interest Shorts: | 75.2 | 7.0 | 5.0 |
| – Net Position: | 857 | -1,077 | 220 |
| – Gross Longs: | 12,704 | 33 | 1,007 |
| – Gross Shorts: | 11,847 | 1,110 | 787 |
| – Long to Short Ratio: | 1.1 to 1 | 0.0 to 1 | 1.3 to 1 |
| NET POSITION TREND: | |||
| – Strength Index Score (3 Year Range Pct): | 91.9 | 12.2 | 17.9 |
| – Strength Index Reading (3 Year Range): | Bullish-Extreme | Bearish-Extreme | Bearish-Extreme |
| NET POSITION MOVEMENT INDEX: | |||
| – 6-Week Change in Strength Index: | -7.7 | 12.2 | 4.3 |
Article By InvestMacro – Receive our weekly COT Newsletter
*COT Report: The COT data, released weekly to the public each Friday, is updated through the most recent Tuesday (data is 3 days old) and shows a quick view of how large speculators or non-commercials (for-profit traders) were positioned in the futures markets.
The CFTC categorizes trader positions according to commercial hedgers (traders who use futures contracts for hedging as part of the business), non-commercials (large traders who speculate to realize trading profits) and nonreportable traders (usually small traders/speculators) as well as their open interest (contracts open in the market at time of reporting). See CFTC criteria here.


