
By InvestMacro
Here are the latest charts and statistics for the Commitment of Traders (COT) data published by the Commodities Futures Trading Commission (CFTC).
The latest COT data is updated through Tuesday January 10th and shows a quick view of how large traders (for-profit speculators and commercial entities) were positioned in the futures markets.
Weekly Speculator Changes led by Gold & Palladium
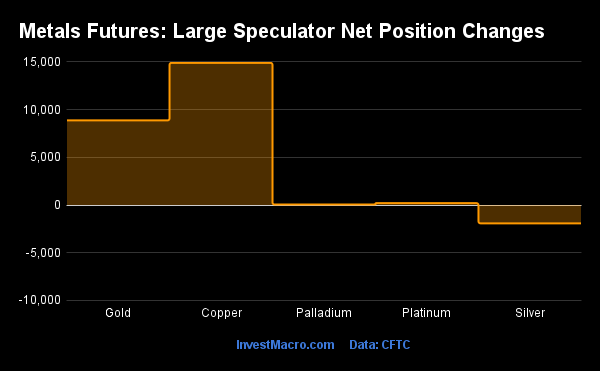
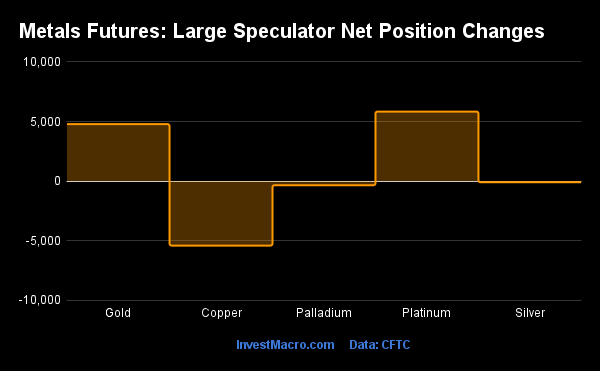
The COT metals markets speculator bets were higher this week as four out of the five precious metals markets we cover had higher positioning while only one market had lower speculator contracts.
Leading the gains for the metals was Copper (14,902 contracts) with Gold (8,869 contracts), Palladium (52 contracts) and Platinum (199 contracts) also showing positive weeks.
The market with a decline in speculator bets for the week was Silver with a drop by -1,921 contracts on the week.
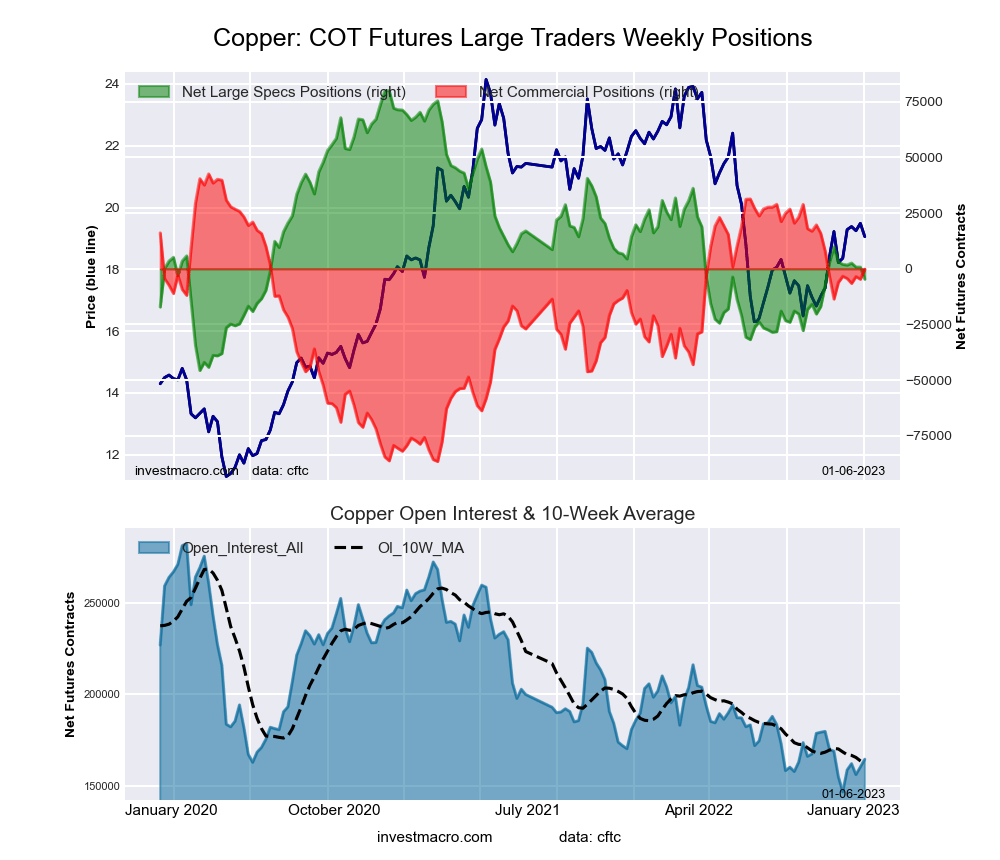
Highlighting the COT metals data this week is the boost the the Copper positions got this week. The large speculator position in Copper futures rose this week for only the first time in the past four weeks but represented the highest one-week gain of the past 64 weeks, dating back to October of 2019.
Copper speculators pushed the overall position back into bullish territory after a week spent in bearish levels on January 3rd. Copper had been in bearish territory in 29 out of the previous 37 weeks before this week’s gain.
The Copper futures price jumped by over 7 percent this week to around the $4.20 per pound level and the highest weekly close since June. Copper is also up by over 30 percent since hitting a recent low in July of 2022. The opening of China’s economy (after discarding its zero-covid policies) has been a positive development for the price outlook as China is one of the leading countries in both producing and consuming Copper.
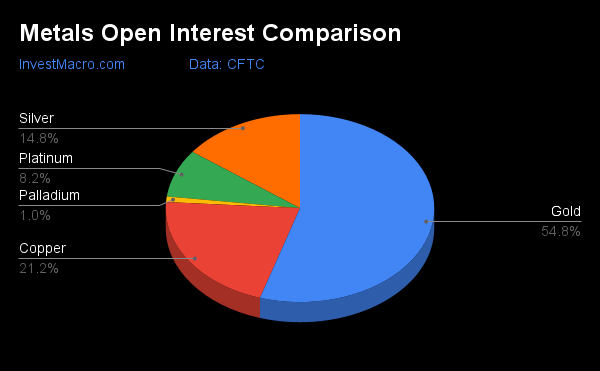
| Jan-10-2023 | OI | OI-Index | Spec-Net | Spec-Index | Com-Net | COM-Index | Smalls-Net | Smalls-Index |
|---|---|---|---|---|---|---|---|---|
| Gold | 481,519 | 16 | 150,535 | 33 | -172,478 | 66 | 21,943 | 35 |
| Silver | 129,961 | 7 | 29,013 | 46 | -42,925 | 55 | 13,912 | 40 |
| Copper | 186,383 | 29 | 10,227 | 44 | -16,253 | 54 | 6,026 | 60 |
| Palladium | 8,352 | 12 | -2,490 | 11 | 2,337 | 85 | 153 | 51 |
| Platinum | 72,216 | 43 | 30,702 | 50 | -34,346 | 53 | 3,644 | 17 |
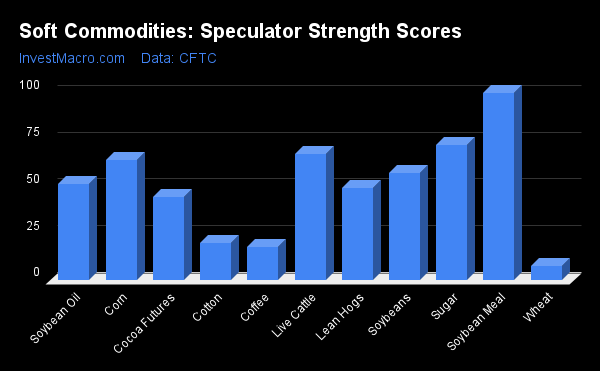
Strength Scores led by Platinum & Silver
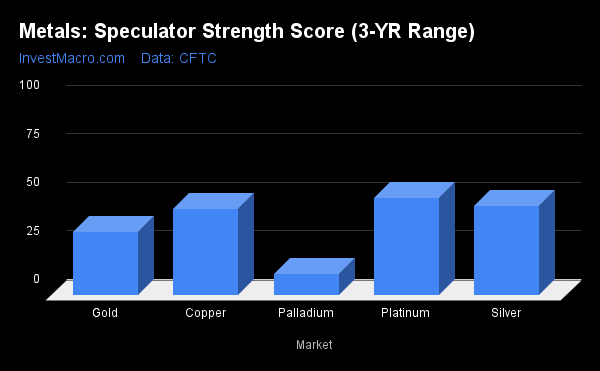
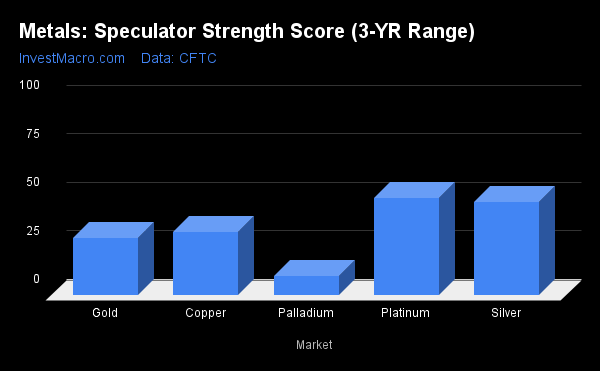
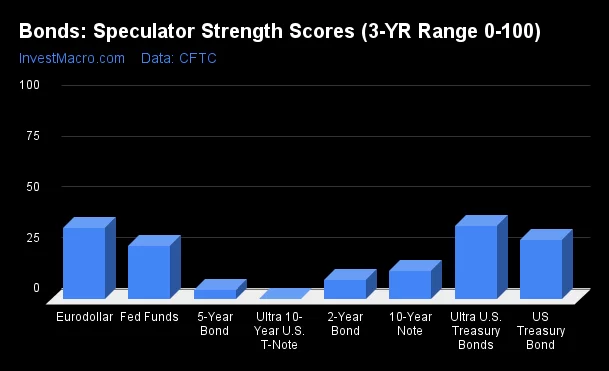
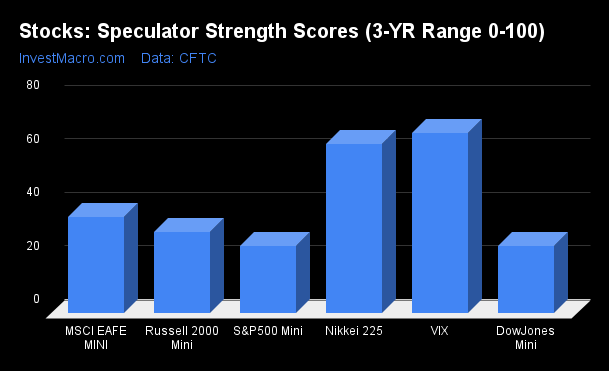
COT Strength Scores (a normalized measure of Speculator positions over a 3-Year range, from 0 to 100 where above 80 is Extreme-Bullish and below 20 is Extreme-Bearish) showed that Platinum (50 percent) leads the metals markets this week. Silver (46 percent) comes in as the next highest in the weekly strength scores.
On the downside, Palladium (11 percent) comes in at the lowest strength level currently and is in Extreme-Bearish territory (below 20 percent). The next lowest strength score was Gold (33 percent).
Strength Statistics:
Gold (32.6 percent) vs Gold previous week (29.7 percent)
Silver (46.1 percent) vs Silver previous week (48.2 percent)
Copper (44.5 percent) vs Copper previous week (32.6 percent)
Platinum (50.4 percent) vs Platinum previous week (50.1 percent)
Palladium (11.3 percent) vs Palladium previous week (10.9 percent)
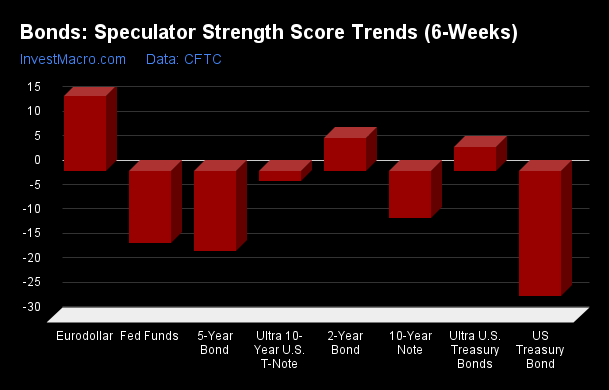
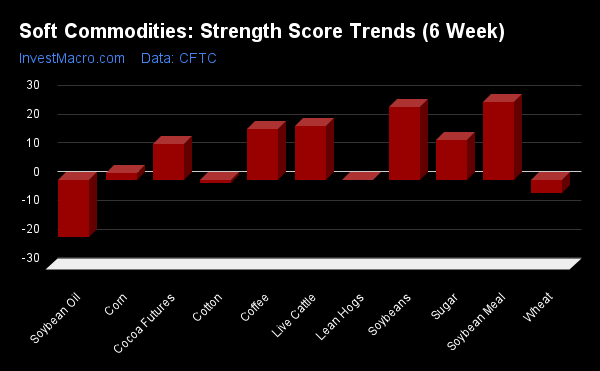
Gold & Silver top the 6-Week Strength Trends
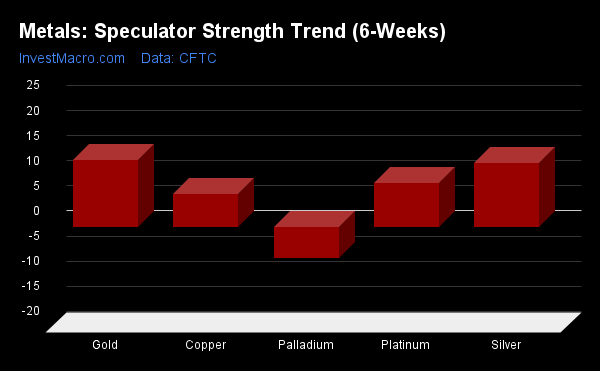
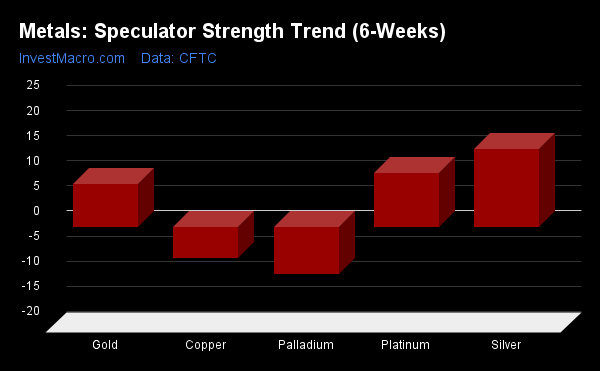
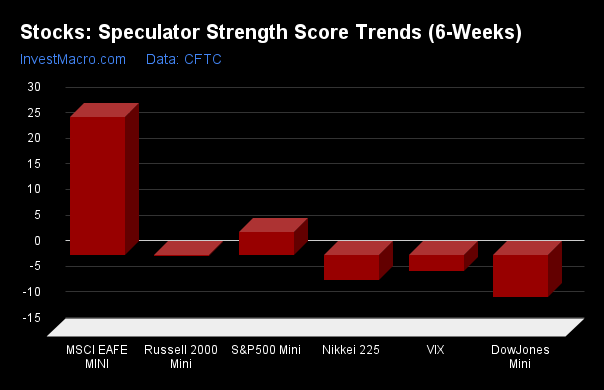
COT Strength Score Trends (or move index, calculates the 6-week changes in strength scores) showed that Gold (13.4 percent) leads the past six weeks trends for metals. Silver (12.7 percent) is the next highest positive mover in the latest trends data.
Palladium (-6.2 percent) leads the downside trend scores currently and is the only negative mover over the past six weeks.
Move Statistics:
Gold (13.4 percent) vs Gold previous week (8.5 percent)
Silver (12.7 percent) vs Silver previous week (15.6 percent)
Copper (6.6 percent) vs Copper previous week (-6.2 percent)
Platinum (8.7 percent) vs Platinum previous week (10.8 percent)
Palladium (-6.2 percent) vs Palladium previous week (-10.3 percent)
Individual Markets:
Gold Comex Futures:
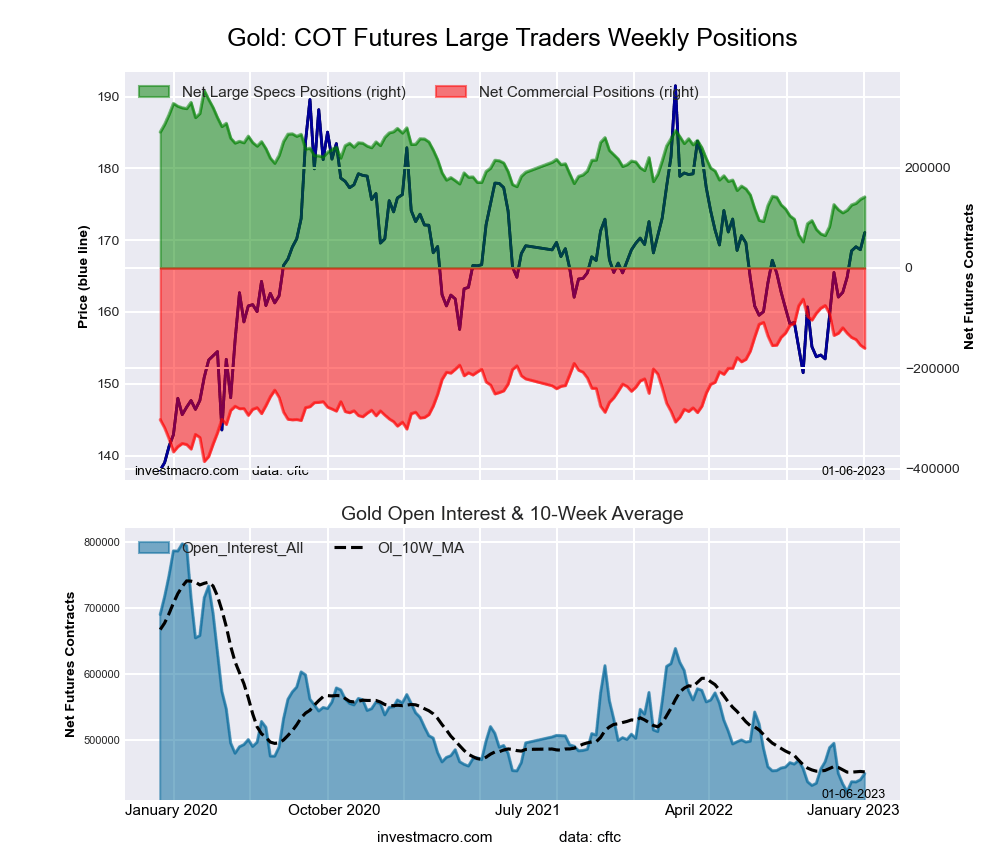
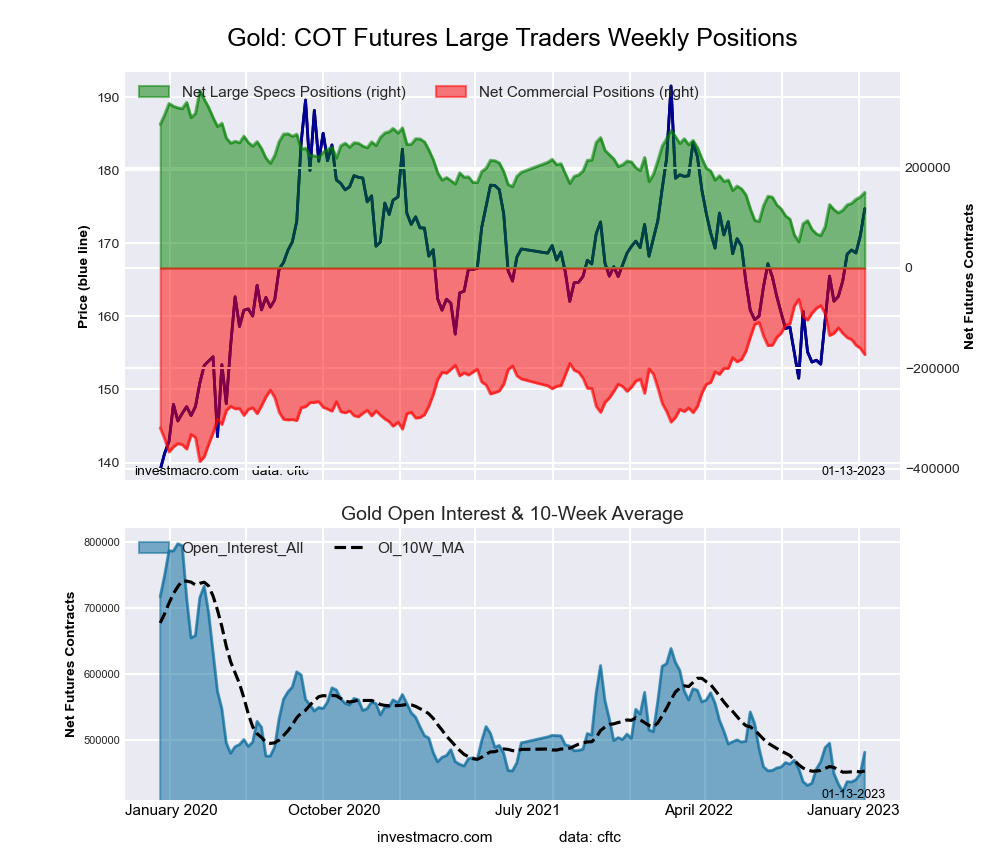 The Gold Comex Futures large speculator standing this week recorded a net position of 150,535 contracts in the data reported through Tuesday. This was a weekly lift of 8,869 contracts from the previous week which had a total of 141,666 net contracts.
This week’s current strength score (the trader positioning range over the past three years, measured from 0 to 100) shows the speculators are currently Bearish with a score of 32.6 percent. The commercials are Bullish with a score of 65.9 percent and the small traders (not shown in chart) are Bearish with a score of 34.9 percent.
| Gold Futures Statistics | SPECULATORS | COMMERCIALS | SMALL TRADERS |
| – Percent of Open Interest Longs: | 50.6 | 23.2 | 9.6 |
| – Percent of Open Interest Shorts: | 19.3 | 59.0 | 5.1 |
| – Net Position: | 150,535 | -172,478 | 21,943 |
| – Gross Longs: | 243,566 | 111,718 | 46,373 |
| – Gross Shorts: | 93,031 | 284,196 | 24,430 |
| – Long to Short Ratio: | 2.6 to 1 | 0.4 to 1 | 1.9 to 1 |
| NET POSITION TREND: | |||
| – Strength Index Score (3 Year Range Pct): | 32.6 | 65.9 | 34.9 |
| – Strength Index Reading (3 Year Range): | Bearish | Bullish | Bearish |
| NET POSITION MOVEMENT INDEX: | |||
| – 6-Week Change in Strength Index: | 13.4 | -16.5 | 32.0 |
Silver Comex Futures:
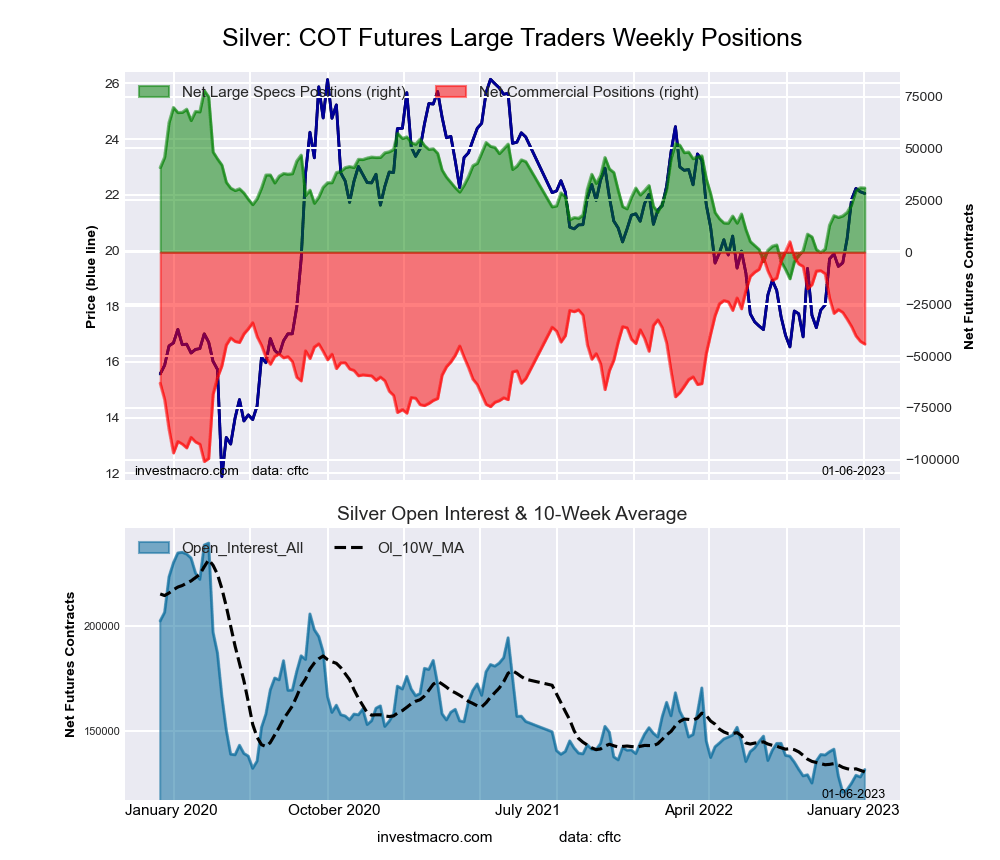
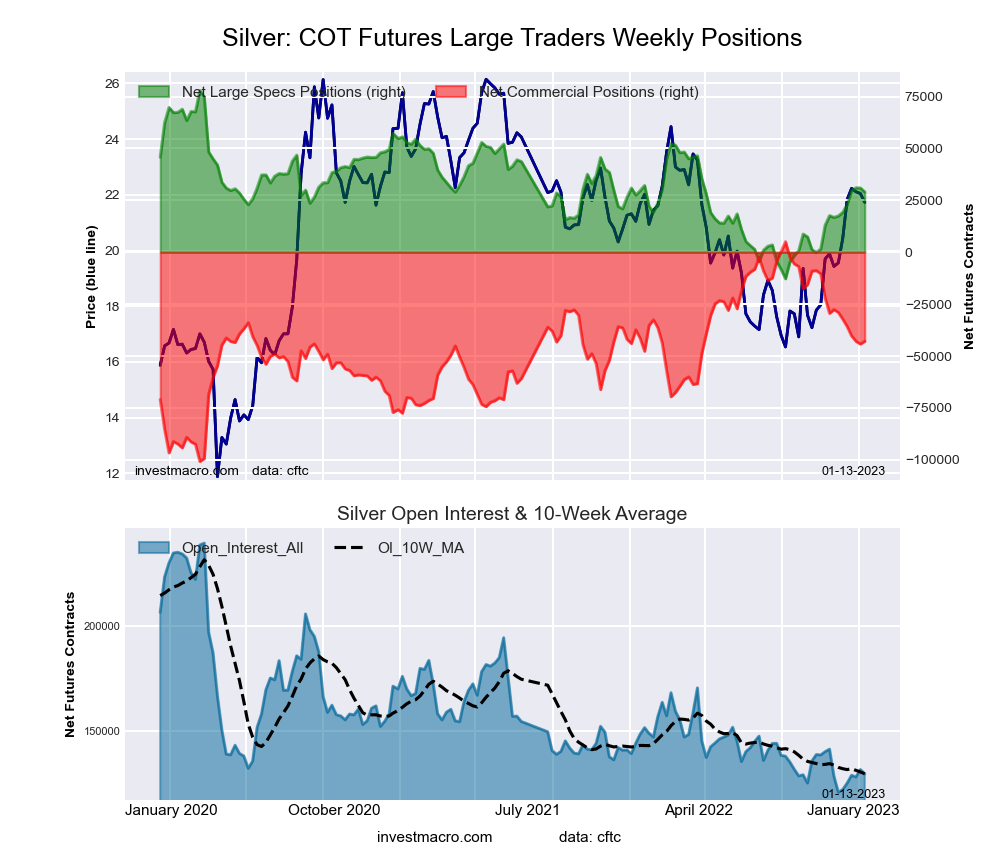 The Silver Comex Futures large speculator standing this week recorded a net position of 29,013 contracts in the data reported through Tuesday. This was a weekly reduction of -1,921 contracts from the previous week which had a total of 30,934 net contracts.
This week’s current strength score (the trader positioning range over the past three years, measured from 0 to 100) shows the speculators are currently Bearish with a score of 46.1 percent. The commercials are Bullish with a score of 54.7 percent and the small traders (not shown in chart) are Bearish with a score of 39.7 percent.
| Silver Futures Statistics | SPECULATORS | COMMERCIALS | SMALL TRADERS |
| – Percent of Open Interest Longs: | 43.7 | 32.8 | 18.4 |
| – Percent of Open Interest Shorts: | 21.4 | 65.8 | 7.7 |
| – Net Position: | 29,013 | -42,925 | 13,912 |
| – Gross Longs: | 56,770 | 42,599 | 23,938 |
| – Gross Shorts: | 27,757 | 85,524 | 10,026 |
| – Long to Short Ratio: | 2.0 to 1 | 0.5 to 1 | 2.4 to 1 |
| NET POSITION TREND: | |||
| – Strength Index Score (3 Year Range Pct): | 46.1 | 54.7 | 39.7 |
| – Strength Index Reading (3 Year Range): | Bearish | Bullish | Bearish |
| NET POSITION MOVEMENT INDEX: | |||
| – 6-Week Change in Strength Index: | 12.7 | -13.2 | 12.2 |
Copper Grade #1 Futures:
 The Copper Grade #1 Futures large speculator standing this week recorded a net position of 10,227 contracts in the data reported through Tuesday. This was a weekly gain of 14,902 contracts from the previous week which had a total of -4,675 net contracts.
This week’s current strength score (the trader positioning range over the past three years, measured from 0 to 100) shows the speculators are currently Bearish with a score of 44.5 percent. The commercials are Bullish with a score of 54.4 percent and the small traders (not shown in chart) are Bullish with a score of 60.1 percent.
| Copper Futures Statistics | SPECULATORS | COMMERCIALS | SMALL TRADERS |
| – Percent of Open Interest Longs: | 40.1 | 37.4 | 10.6 |
| – Percent of Open Interest Shorts: | 34.6 | 46.2 | 7.3 |
| – Net Position: | 10,227 | -16,253 | 6,026 |
| – Gross Longs: | 74,753 | 69,787 | 19,691 |
| – Gross Shorts: | 64,526 | 86,040 | 13,665 |
| – Long to Short Ratio: | 1.2 to 1 | 0.8 to 1 | 1.4 to 1 |
| NET POSITION TREND: | |||
| – Strength Index Score (3 Year Range Pct): | 44.5 | 54.4 | 60.1 |
| – Strength Index Reading (3 Year Range): | Bearish | Bullish | Bullish |
| NET POSITION MOVEMENT INDEX: | |||
| – 6-Week Change in Strength Index: | 6.6 | -10.0 | 26.9 |
Platinum Futures:
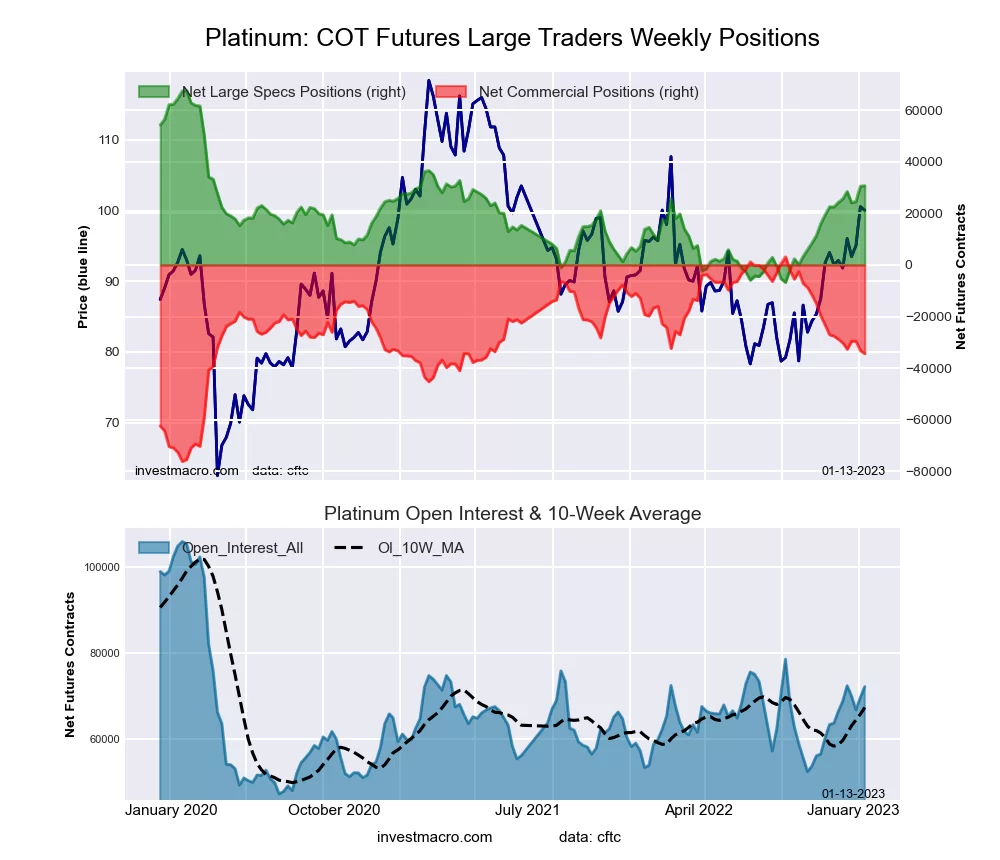 The Platinum Futures large speculator standing this week recorded a net position of 30,702 contracts in the data reported through Tuesday. This was a weekly advance of 199 contracts from the previous week which had a total of 30,503 net contracts.
This week’s current strength score (the trader positioning range over the past three years, measured from 0 to 100) shows the speculators are currently Bullish with a score of 50.4 percent. The commercials are Bullish with a score of 52.7 percent and the small traders (not shown in chart) are Bearish-Extreme with a score of 17.0 percent.
| Platinum Futures Statistics | SPECULATORS | COMMERCIALS | SMALL TRADERS |
| – Percent of Open Interest Longs: | 60.6 | 26.5 | 9.5 |
| – Percent of Open Interest Shorts: | 18.1 | 74.0 | 4.4 |
| – Net Position: | 30,702 | -34,346 | 3,644 |
| – Gross Longs: | 43,745 | 19,128 | 6,832 |
| – Gross Shorts: | 13,043 | 53,474 | 3,188 |
| – Long to Short Ratio: | 3.4 to 1 | 0.4 to 1 | 2.1 to 1 |
| NET POSITION TREND: | |||
| – Strength Index Score (3 Year Range Pct): | 50.4 | 52.7 | 17.0 |
| – Strength Index Reading (3 Year Range): | Bullish | Bullish | Bearish-Extreme |
| NET POSITION MOVEMENT INDEX: | |||
| – 6-Week Change in Strength Index: | 8.7 | -7.0 | -11.4 |
Palladium Futures:
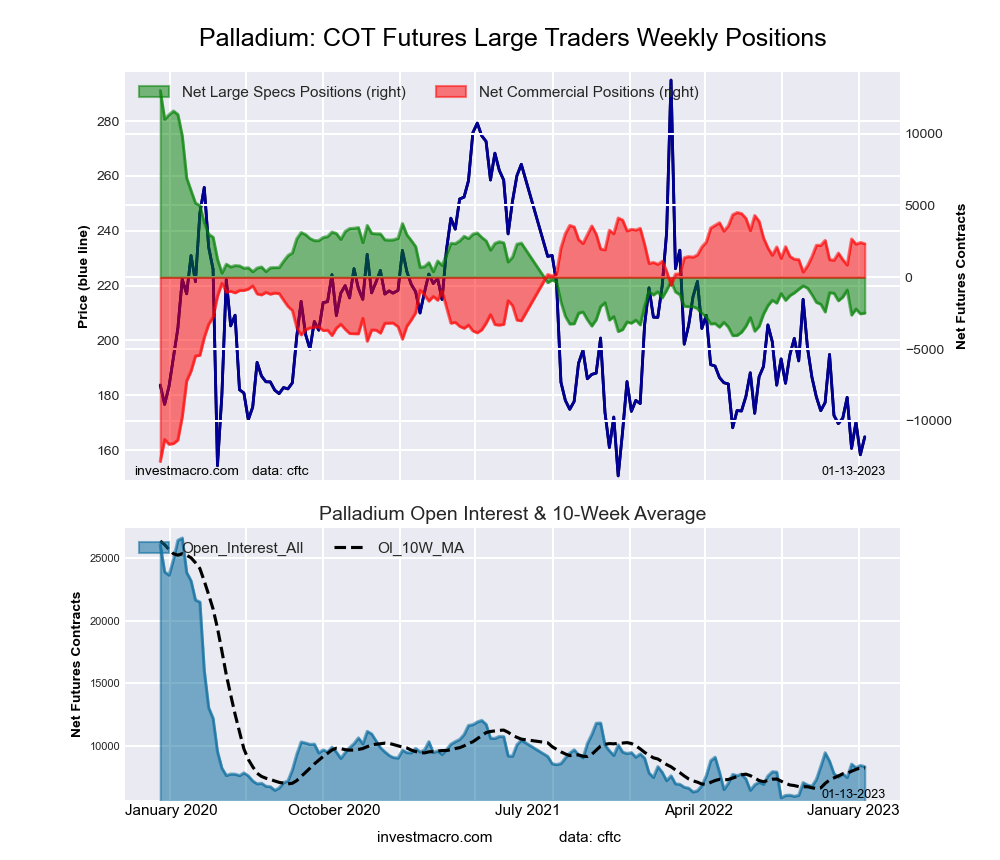 The Palladium Futures large speculator standing this week recorded a net position of -2,490 contracts in the data reported through Tuesday. This was a weekly lift of 52 contracts from the previous week which had a total of -2,542 net contracts.
This week’s current strength score (the trader positioning range over the past three years, measured from 0 to 100) shows the speculators are currently Bearish-Extreme with a score of 11.3 percent. The commercials are Bullish-Extreme with a score of 84.7 percent and the small traders (not shown in chart) are Bullish with a score of 50.9 percent.
| Palladium Futures Statistics | SPECULATORS | COMMERCIALS | SMALL TRADERS |
| – Percent of Open Interest Longs: | 25.3 | 53.3 | 16.3 |
| – Percent of Open Interest Shorts: | 55.1 | 25.3 | 14.5 |
| – Net Position: | -2,490 | 2,337 | 153 |
| – Gross Longs: | 2,114 | 4,452 | 1,362 |
| – Gross Shorts: | 4,604 | 2,115 | 1,209 |
| – Long to Short Ratio: | 0.5 to 1 | 2.1 to 1 | 1.1 to 1 |
| NET POSITION TREND: | |||
| – Strength Index Score (3 Year Range Pct): | 11.3 | 84.7 | 50.9 |
| – Strength Index Reading (3 Year Range): | Bearish-Extreme | Bullish-Extreme | Bullish |
| NET POSITION MOVEMENT INDEX: | |||
| – 6-Week Change in Strength Index: | -6.2 | 4.6 | 12.6 |
Article By InvestMacro – Receive our weekly COT Newsletter
*COT Report: The COT data, released weekly to the public each Friday, is updated through the most recent Tuesday (data is 3 days old) and shows a quick view of how large speculators or non-commercials (for-profit traders) were positioned in the futures markets.
The CFTC categorizes trader positions according to commercial hedgers (traders who use futures contracts for hedging as part of the business), non-commercials (large traders who speculate to realize trading profits) and nonreportable traders (usually small traders/speculators) as well as their open interest (contracts open in the market at time of reporting). See CFTC criteria here.


