
By InvestMacro

Here are the latest charts and statistics for the Commitment of Traders (COT) data published by the Commodities Futures Trading Commission (CFTC).
The latest COT data is updated through Tuesday October 25th and shows a quick view of how large market participants (for-profit speculators and commercial traders) were positioned in the futures markets. All currency positions are in direct relation to the US dollar where, for example, a bet for the euro is a bet that the euro will rise versus the dollar while a bet against the euro will be a bet that the euro will decline versus the dollar.
Weekly Speculator Changes led by Mexican Peso & Euro
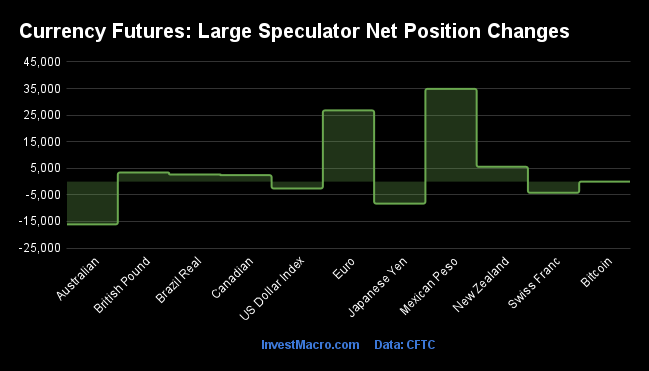
The COT currency market speculator bets were mostly higher this week as seven out of the eleven currency markets we cover had higher positioning while the other four markets had lower speculator contracts.
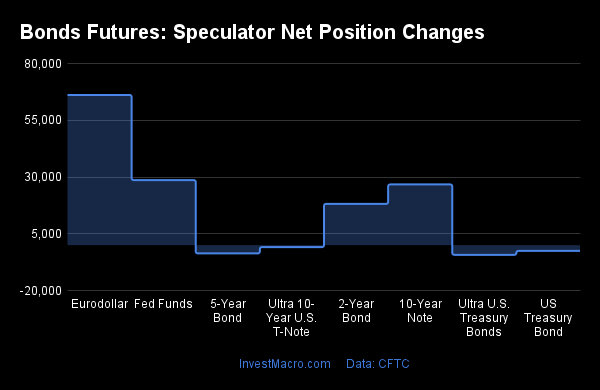
Leading the gains for the currency markets was the Mexican peso (34,868 contracts) with the Euro (26,759 contracts), the New Zealand dollar (5,561 contracts), the British pound sterling (3,406 contracts), the Brazilian real (2,681 contracts), the Canadian dollar (2,418 contracts) and Bitcoin (1 contracts) also showing positive weeks.
The currencies leading the declines in speculator bets this week were the Australian dollar (-16,087 contracts) with the Japanese yen (-8,282 contracts), the Swiss franc (-4,214 contracts) and the US Dollar Index (-2,592 contracts) also registering lower bets on the week.
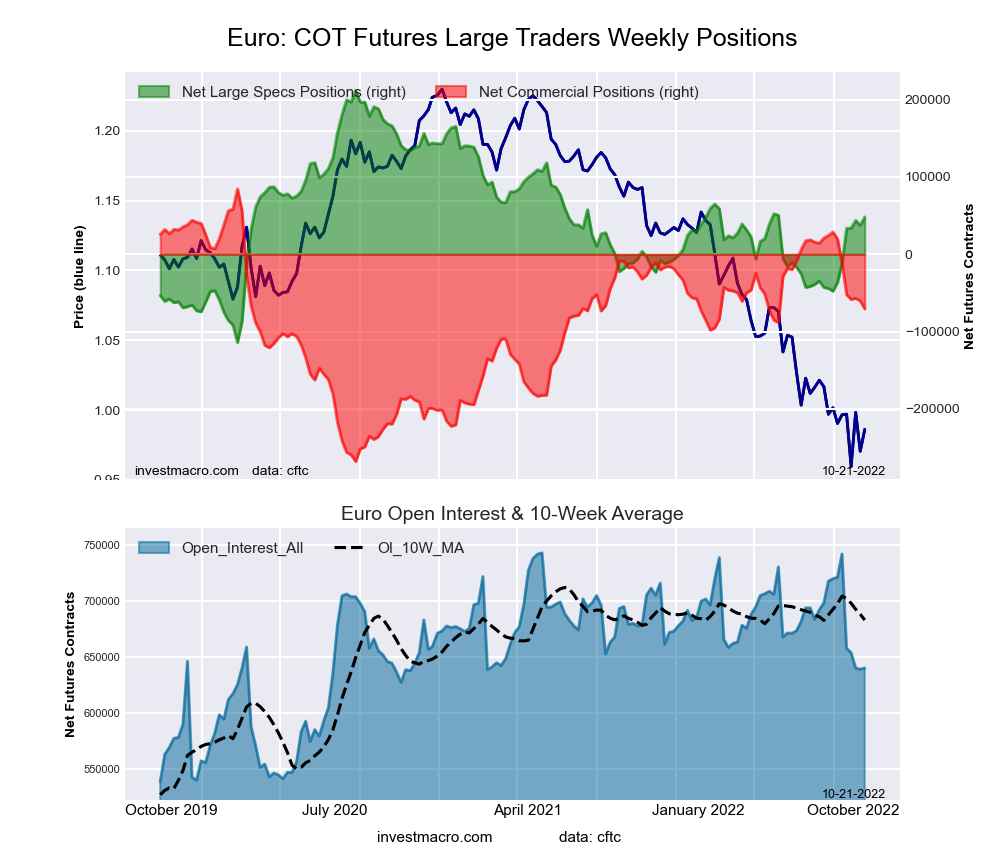
Highlighting the COT currency positioning this week is the further push higher for the Euro speculators. The large speculator position in Euro futures jumped again this week and is higher for the seventh time in the past eight weeks. This week’s rise by over +26,000 contracts follows a gain by over +10,000 contracts last week. The past eight-week gains for Euro speculator bets now stands at +122,585 contracts and the current bullish position (+74,909 contracts currently) is at the most bullish level in 68-weeks, dating back to July 6th of 2021.
The strong bullishness in the Euro is despite the Euro price remaining at parity against the US Dollar (near 20-year lows). The European Central Bank raised their interest rate by 75 basis points on Thursday to try and offset high inflation in the Eurozone and brought the interest rate differential with the US Dollar a little narrower. Going forward, this divergence in the speculator positioning and the weak Euro price brings up some interesting questions. Does the sharply improving speculator sentiment foreshadow an improvement in the Euro price or will it set up a short squeeze with prices going lower if the speculators throw in the towel and bail out of their bullish bets?
| Oct-25-2022 | OI | OI-Index | Spec-Net | Spec-Index | Com-Net | COM-Index | Smalls-Net | Smalls-Index |
|---|---|---|---|---|---|---|---|---|
| USD Index | 59,053 | 87 | 30,098 | 75 | -34,360 | 21 | 4,262 | 63 |
| EUR | 666,719 | 62 | 74,909 | 58 | -93,832 | 49 | 18,923 | 9 |
| GBP | 258,969 | 73 | -47,805 | 28 | 66,560 | 79 | -18,755 | 21 |
| JPY | 272,597 | 94 | -102,618 | 6 | 118,082 | 93 | -15,464 | 22 |
| CHF | 46,594 | 34 | -11,300 | 28 | 23,161 | 80 | -11,861 | 17 |
| CAD | 143,417 | 26 | -18,155 | 19 | 18,053 | 84 | 102 | 30 |
| AUD | 166,961 | 58 | -51,446 | 37 | 66,319 | 68 | -14,873 | 16 |
| NZD | 50,620 | 45 | -12,884 | 46 | 16,289 | 59 | -3,405 | 12 |
| MXN | 248,910 | 72 | 12,574 | 33 | -19,809 | 65 | 7,235 | 74 |
| RUB | 20,930 | 4 | 7,543 | 31 | -7,150 | 69 | -393 | 24 |
| BRL | 43,644 | 32 | 29,179 | 79 | -31,590 | 20 | 2,411 | 93 |
| Bitcoin | 14,854 | 87 | 23 | 77 | -380 | 0 | 357 | 21 |
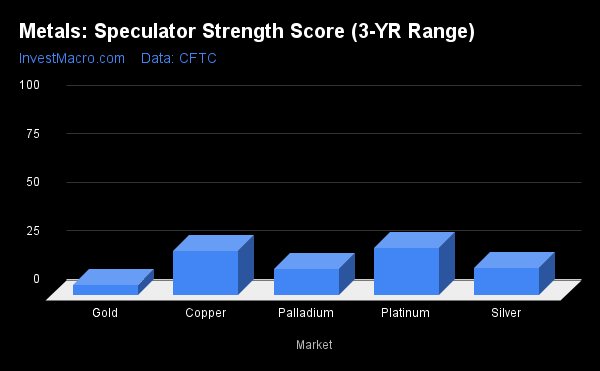
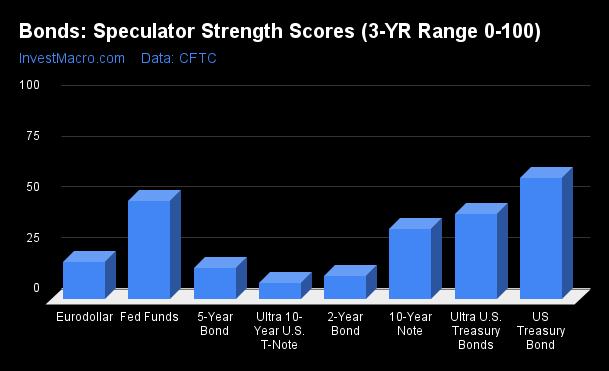
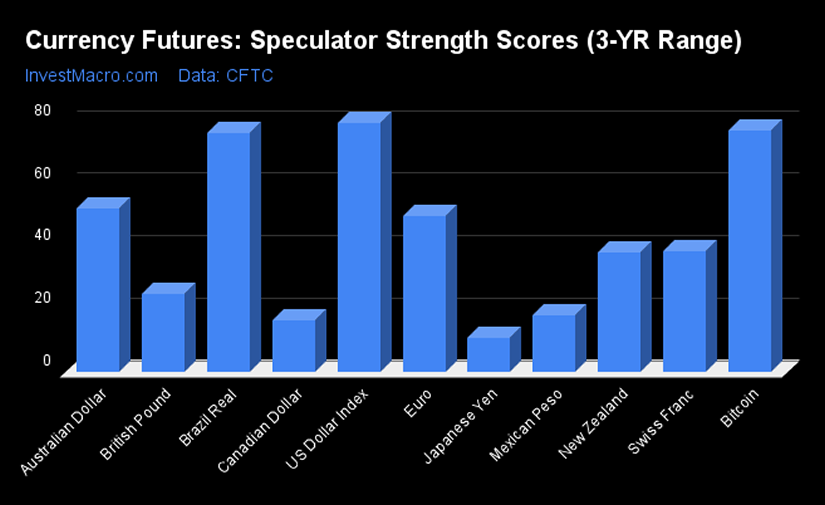
Brazilian Real, Bitcoin and US Dollar Index lead Strength Scores
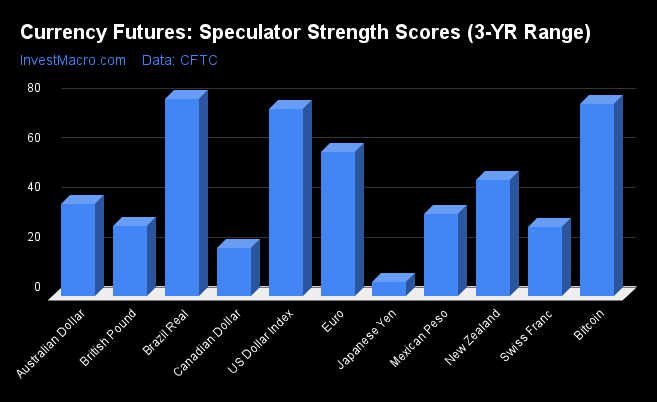
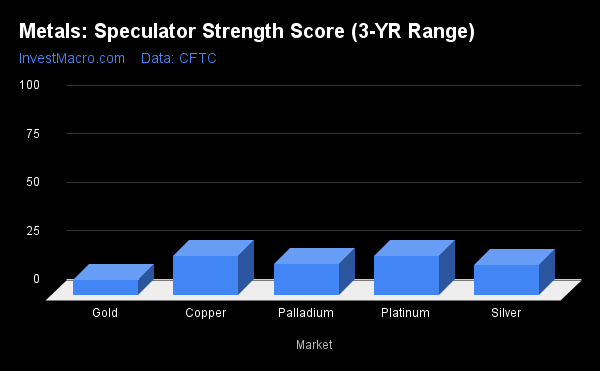
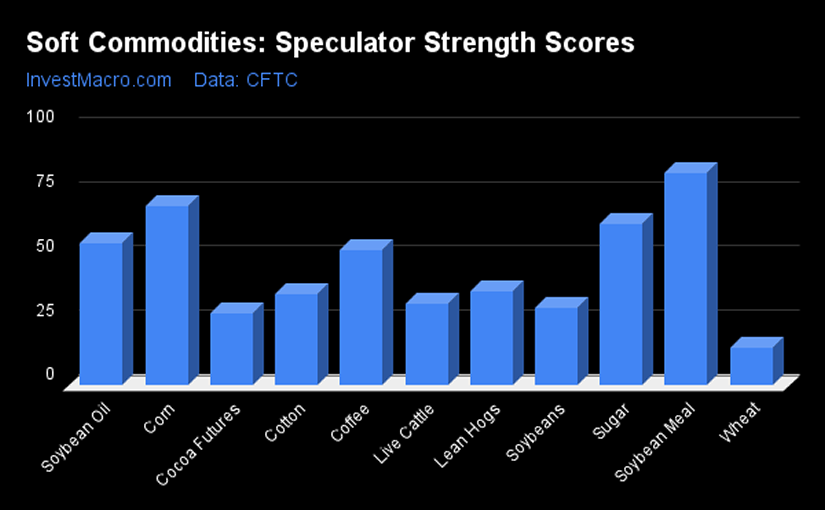
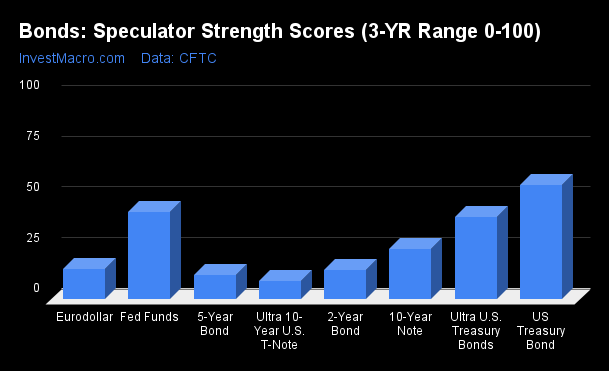
Strength Scores (a normalized measure of Speculator positions over a 3-Year range, from 0 to 100 where above 80 is extreme bullish and below 20 is extreme bearish) showed that Brazilian Real (79.1 percent), Bitcoin (77.3 percent) and the US Dollar Index (75.1 percent) lead the currency markets near the top of their respective ranges. The EuroFX (58.0 percent) comes in as the next highest in the currency markets in strength scores and above the 50 percent level.
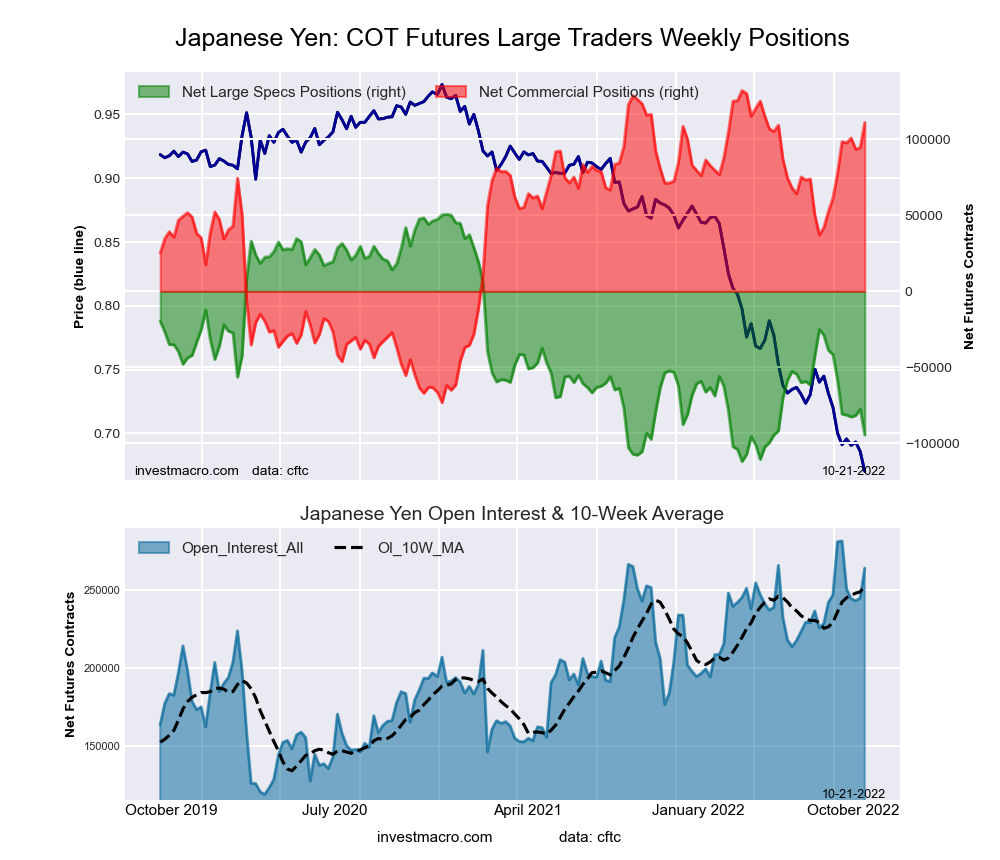
On the downside, the Japanese Yen (5.7 percent) comes in at the lowest strength level currently and is in an extreme bearish position below 20 percent.
Strength Statistics:
US Dollar Index (75.1 percent) vs US Dollar Index previous week (79.5 percent)
EuroFX (58.0 percent) vs EuroFX previous week (49.8 percent)
British Pound Sterling (28.0 percent) vs British Pound Sterling previous week (25.0 percent)
Japanese Yen (5.7 percent) vs Japanese Yen previous week (10.8 percent)
Swiss Franc (27.8 percent) vs Swiss Franc previous week (38.5 percent)
Canadian Dollar (19.0 percent) vs Canadian Dollar previous week (16.3 percent)
Australian Dollar (37.1 percent) vs Australian Dollar previous week (52.1 percent)
New Zealand Dollar (46.5 percent) vs New Zealand Dollar previous week (36.6 percent)
Mexican Peso (32.7 percent) vs Mexican Peso previous week (17.8 percent)
Brazilian Real (79.1 percent) vs Brazilian Real previous week (76.4 percent)
Bitcoin (77.3 percent) vs Bitcoin previous week (77.3 percent)
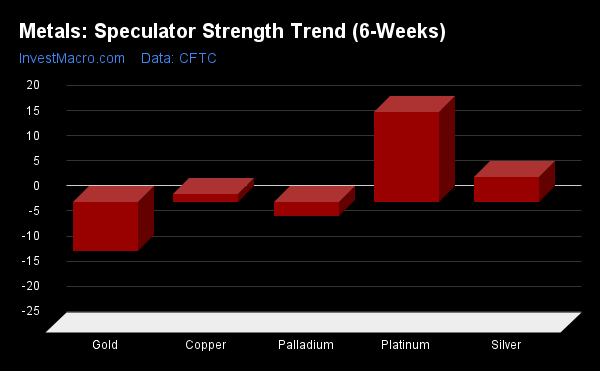
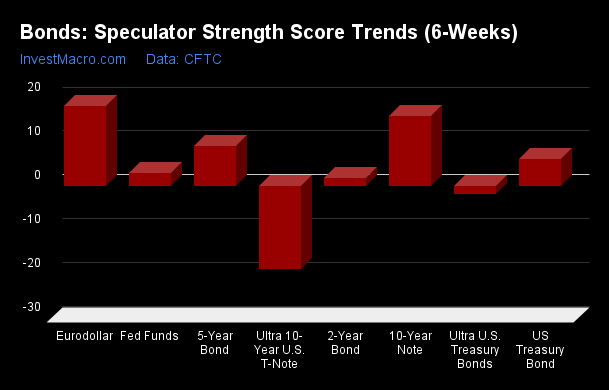
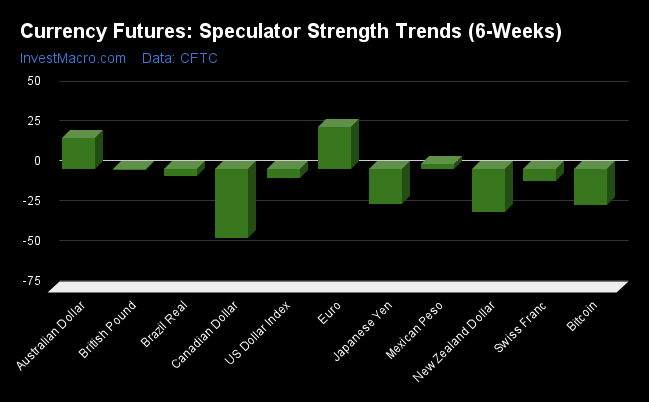
Euro leads the Strength Trends
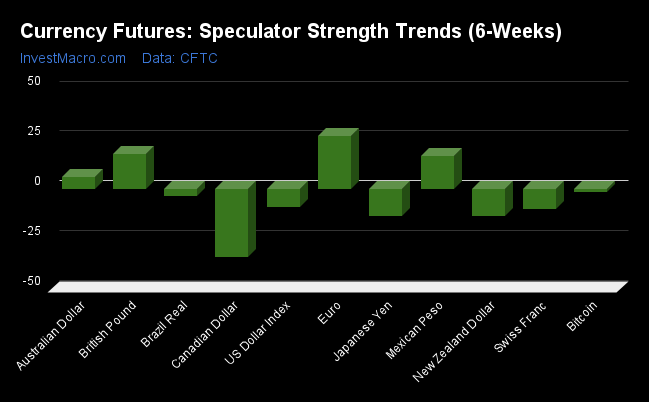
Strength Score Trends (or move index, calculates the 6-week changes in strength scores) show that the EuroFX (26.6 percent) leads the past six weeks trends for the currency markets this week. The British Pound Sterling (17.4 percent), the Mexican Peso (16.2 percent) and the Australian Dollar (5.9 percent) fill out the other positive movers in the latest trends data.
The Canadian Dollar (-34.3 percent) leads the downside trend scores currently while the next market with lower trend scores were the New Zealand Dollar (-13.5 percent), Japanese Yen (-13.5 percent) and the Swiss Franc (-10.1 percent).
Strength Trend Statistics:
US Dollar Index (-9.3 percent) vs US Dollar Index previous week (-5.7 percent)
EuroFX (26.6 percent) vs EuroFX previous week (25.9 percent)
British Pound Sterling (17.4 percent) vs British Pound Sterling previous week (-0.7 percent)
Japanese Yen (-13.5 percent) vs Japanese Yen previous week (-22.3 percent)
Swiss Franc (-10.1 percent) vs Swiss Franc previous week (-7.7 percent)
Canadian Dollar (-34.3 percent) vs Canadian Dollar previous week (-43.2 percent)
Australian Dollar (5.9 percent) vs Australian Dollar previous week (19.6 percent)
New Zealand Dollar (-13.5 percent) vs New Zealand Dollar previous week (-28.0 percent)
Mexican Peso (16.2 percent) vs Mexican Peso previous week (3.1 percent)
Brazilian Real (-3.7 percent) vs Brazilian Real previous week (-4.3 percent)
Bitcoin (-1.8 percent) vs Bitcoin previous week (-22.7 percent)
Individual COT Forex Markets:
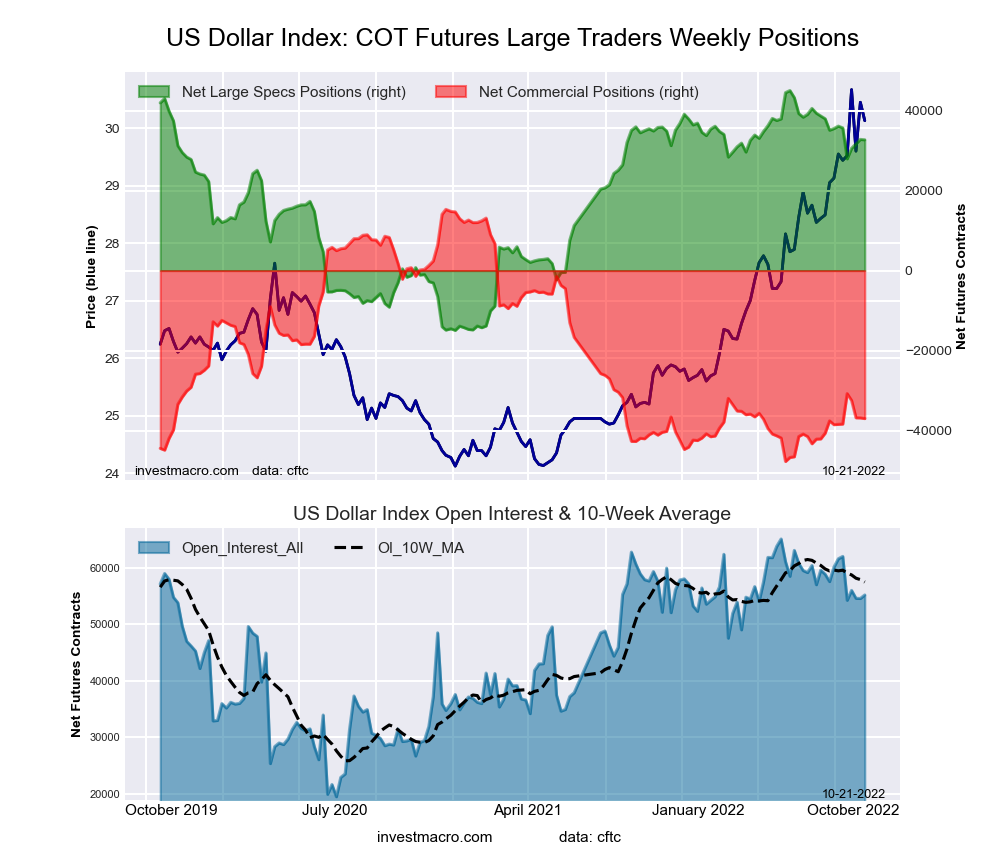
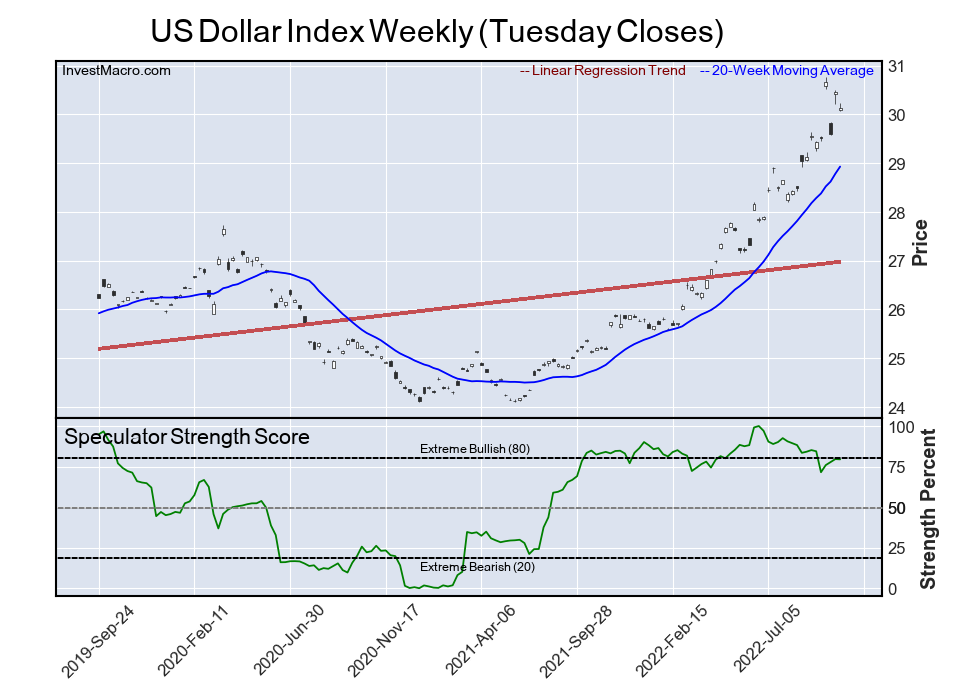
US Dollar Index Futures:
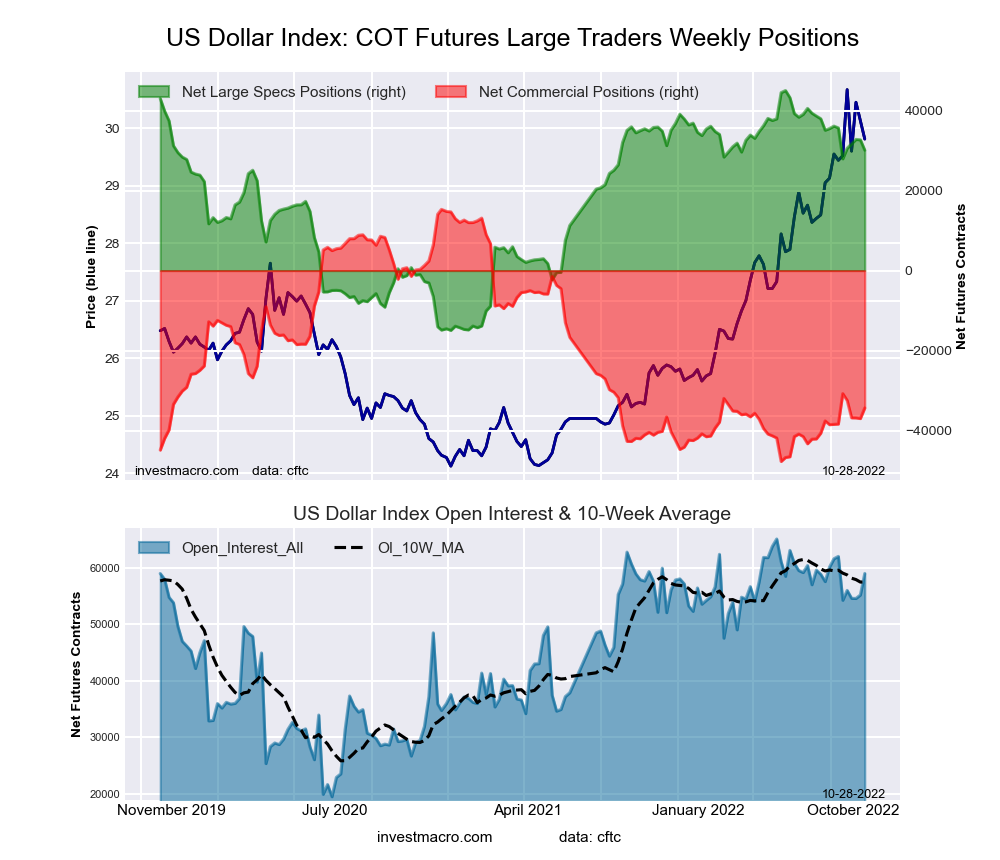 The US Dollar Index large speculator standing this week equaled a net position of 30,098 contracts in the data reported through Tuesday. This was a weekly lowering of -2,592 contracts from the previous week which had a total of 32,690 net contracts.
This week’s current strength score (the trader positioning range over the past three years, measured from 0 to 100) shows the speculators are currently Bullish with a score of 75.1 percent. The commercials are Bearish with a score of 21.2 percent and the small traders (not shown in chart) are Bullish with a score of 63.1 percent.
| US DOLLAR INDEX Statistics | SPECULATORS | COMMERCIALS | SMALL TRADERS |
| – Percent of Open Interest Longs: | 76.2 | 9.5 | 11.7 |
| – Percent of Open Interest Shorts: | 25.2 | 67.6 | 4.5 |
| – Net Position: | 30,098 | -34,360 | 4,262 |
| – Gross Longs: | 44,998 | 5,587 | 6,921 |
| – Gross Shorts: | 14,900 | 39,947 | 2,659 |
| – Long to Short Ratio: | 3.0 to 1 | 0.1 to 1 | 2.6 to 1 |
| NET POSITION TREND: | |||
| – Strength Index Score (3 Year Range Pct): | 75.1 | 21.2 | 63.1 |
| – Strength Index Reading (3 Year Range): | Bullish | Bearish | Bullish |
| NET POSITION MOVEMENT INDEX: | |||
| – 6-Week Change in Strength Index: | -9.3 | 6.4 | 17.0 |
Euro Currency Futures:
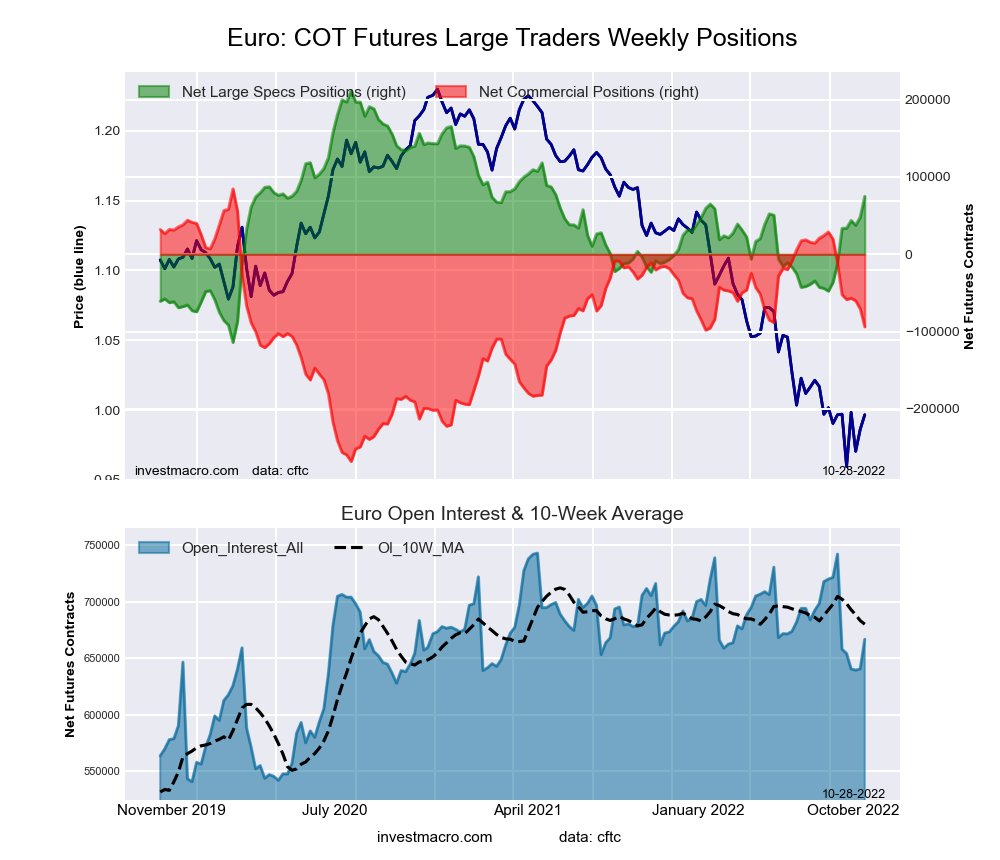 The Euro Currency large speculator standing this week equaled a net position of 74,909 contracts in the data reported through Tuesday. This was a weekly increase of 26,759 contracts from the previous week which had a total of 48,150 net contracts.
This week’s current strength score (the trader positioning range over the past three years, measured from 0 to 100) shows the speculators are currently Bullish with a score of 58.0 percent. The commercials are Bearish with a score of 49.4 percent and the small traders (not shown in chart) are Bearish-Extreme with a score of 9.2 percent.
| EURO Currency Statistics | SPECULATORS | COMMERCIALS | SMALL TRADERS |
| – Percent of Open Interest Longs: | 34.0 | 52.0 | 11.4 |
| – Percent of Open Interest Shorts: | 22.8 | 66.1 | 8.5 |
| – Net Position: | 74,909 | -93,832 | 18,923 |
| – Gross Longs: | 226,734 | 346,949 | 75,890 |
| – Gross Shorts: | 151,825 | 440,781 | 56,967 |
| – Long to Short Ratio: | 1.5 to 1 | 0.8 to 1 | 1.3 to 1 |
| NET POSITION TREND: | |||
| – Strength Index Score (3 Year Range Pct): | 58.0 | 49.4 | 9.2 |
| – Strength Index Reading (3 Year Range): | Bullish | Bearish | Bearish-Extreme |
| NET POSITION MOVEMENT INDEX: | |||
| – 6-Week Change in Strength Index: | 26.6 | -23.4 | -6.9 |
British Pound Sterling Futures:
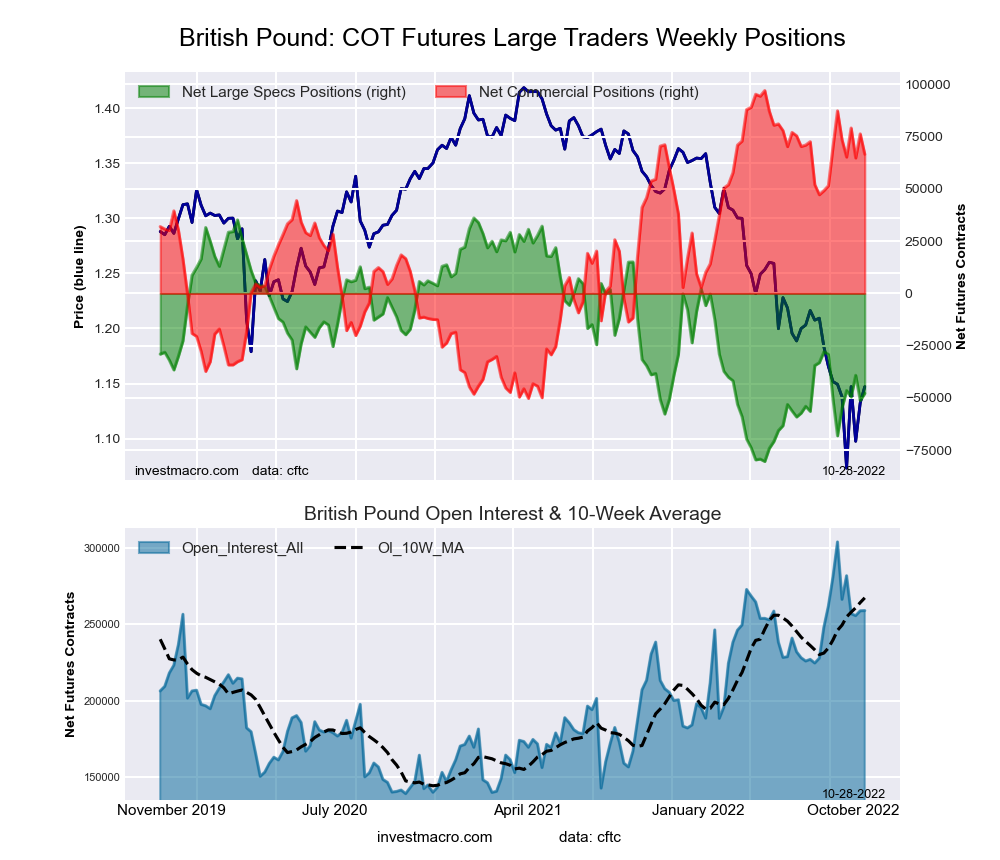 The British Pound Sterling large speculator standing this week equaled a net position of -47,805 contracts in the data reported through Tuesday. This was a weekly boost of 3,406 contracts from the previous week which had a total of -51,211 net contracts.
This week’s current strength score (the trader positioning range over the past three years, measured from 0 to 100) shows the speculators are currently Bearish with a score of 28.0 percent. The commercials are Bullish with a score of 79.3 percent and the small traders (not shown in chart) are Bearish with a score of 21.2 percent.
| BRITISH POUND Statistics | SPECULATORS | COMMERCIALS | SMALL TRADERS |
| – Percent of Open Interest Longs: | 16.8 | 73.0 | 8.1 |
| – Percent of Open Interest Shorts: | 35.3 | 47.3 | 15.4 |
| – Net Position: | -47,805 | 66,560 | -18,755 |
| – Gross Longs: | 43,511 | 189,146 | 21,012 |
| – Gross Shorts: | 91,316 | 122,586 | 39,767 |
| – Long to Short Ratio: | 0.5 to 1 | 1.5 to 1 | 0.5 to 1 |
| NET POSITION TREND: | |||
| – Strength Index Score (3 Year Range Pct): | 28.0 | 79.3 | 21.2 |
| – Strength Index Reading (3 Year Range): | Bearish | Bullish | Bearish |
| NET POSITION MOVEMENT INDEX: | |||
| – 6-Week Change in Strength Index: | 17.4 | -14.1 | 0.9 |
Japanese Yen Futures:
 The Japanese Yen large speculator standing this week equaled a net position of -102,618 contracts in the data reported through Tuesday. This was a weekly decline of -8,282 contracts from the previous week which had a total of -94,336 net contracts.
This week’s current strength score (the trader positioning range over the past three years, measured from 0 to 100) shows the speculators are currently Bearish-Extreme with a score of 5.7 percent. The commercials are Bullish-Extreme with a score of 93.3 percent and the small traders (not shown in chart) are Bearish with a score of 22.0 percent.
| JAPANESE YEN Statistics | SPECULATORS | COMMERCIALS | SMALL TRADERS |
| – Percent of Open Interest Longs: | 13.8 | 75.2 | 9.4 |
| – Percent of Open Interest Shorts: | 51.4 | 31.9 | 15.0 |
| – Net Position: | -102,618 | 118,082 | -15,464 |
| – Gross Longs: | 37,579 | 205,120 | 25,555 |
| – Gross Shorts: | 140,197 | 87,038 | 41,019 |
| – Long to Short Ratio: | 0.3 to 1 | 2.4 to 1 | 0.6 to 1 |
| NET POSITION TREND: | |||
| – Strength Index Score (3 Year Range Pct): | 5.7 | 93.3 | 22.0 |
| – Strength Index Reading (3 Year Range): | Bearish-Extreme | Bullish-Extreme | Bearish |
| NET POSITION MOVEMENT INDEX: | |||
| – 6-Week Change in Strength Index: | -13.5 | 9.6 | 4.4 |
Swiss Franc Futures:
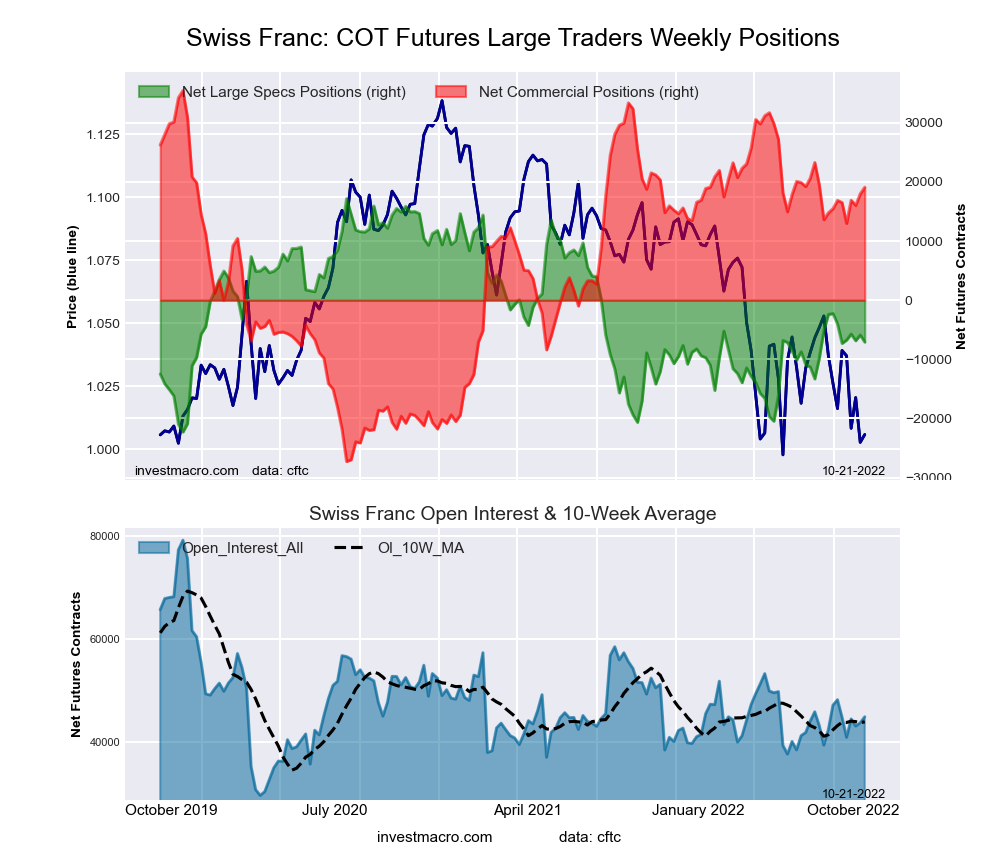
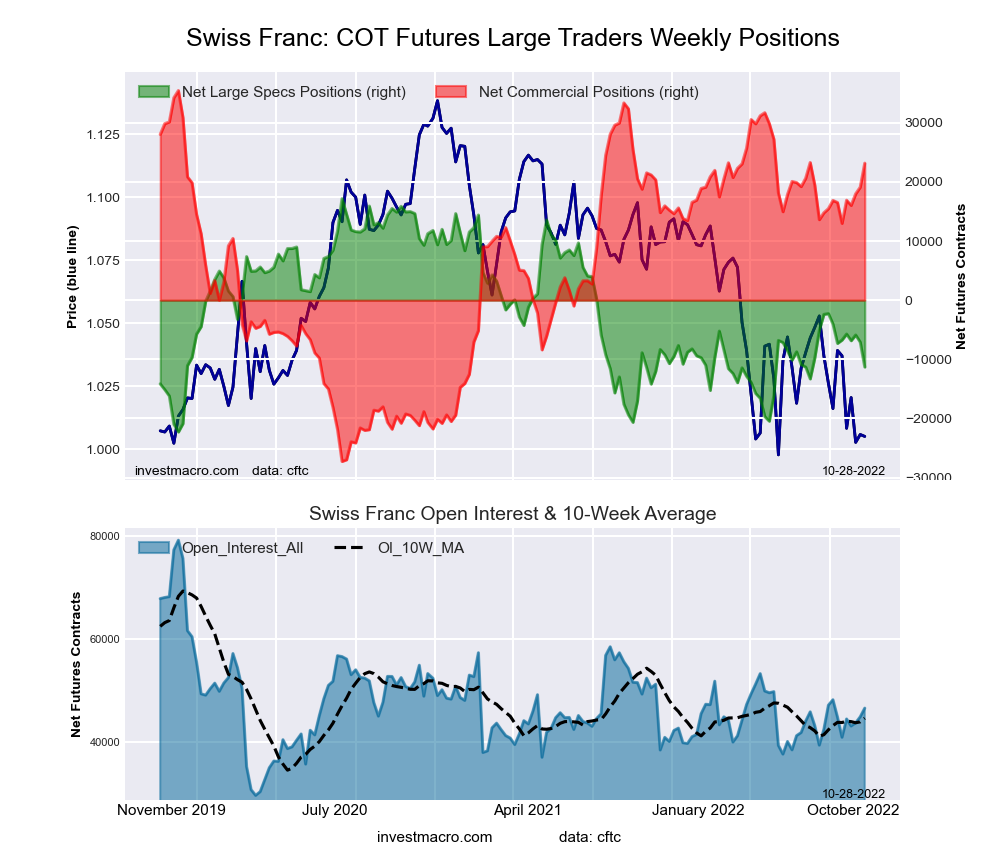 The Swiss Franc large speculator standing this week equaled a net position of -11,300 contracts in the data reported through Tuesday. This was a weekly reduction of -4,214 contracts from the previous week which had a total of -7,086 net contracts.
This week’s current strength score (the trader positioning range over the past three years, measured from 0 to 100) shows the speculators are currently Bearish with a score of 27.8 percent. The commercials are Bullish-Extreme with a score of 80.4 percent and the small traders (not shown in chart) are Bearish-Extreme with a score of 17.4 percent.
| SWISS FRANC Statistics | SPECULATORS | COMMERCIALS | SMALL TRADERS |
| – Percent of Open Interest Longs: | 11.9 | 68.3 | 19.5 |
| – Percent of Open Interest Shorts: | 36.1 | 18.6 | 45.0 |
| – Net Position: | -11,300 | 23,161 | -11,861 |
| – Gross Longs: | 5,538 | 31,843 | 9,097 |
| – Gross Shorts: | 16,838 | 8,682 | 20,958 |
| – Long to Short Ratio: | 0.3 to 1 | 3.7 to 1 | 0.4 to 1 |
| NET POSITION TREND: | |||
| – Strength Index Score (3 Year Range Pct): | 27.8 | 80.4 | 17.4 |
| – Strength Index Reading (3 Year Range): | Bearish | Bullish-Extreme | Bearish-Extreme |
| NET POSITION MOVEMENT INDEX: | |||
| – 6-Week Change in Strength Index: | -10.1 | 10.6 | -9.0 |
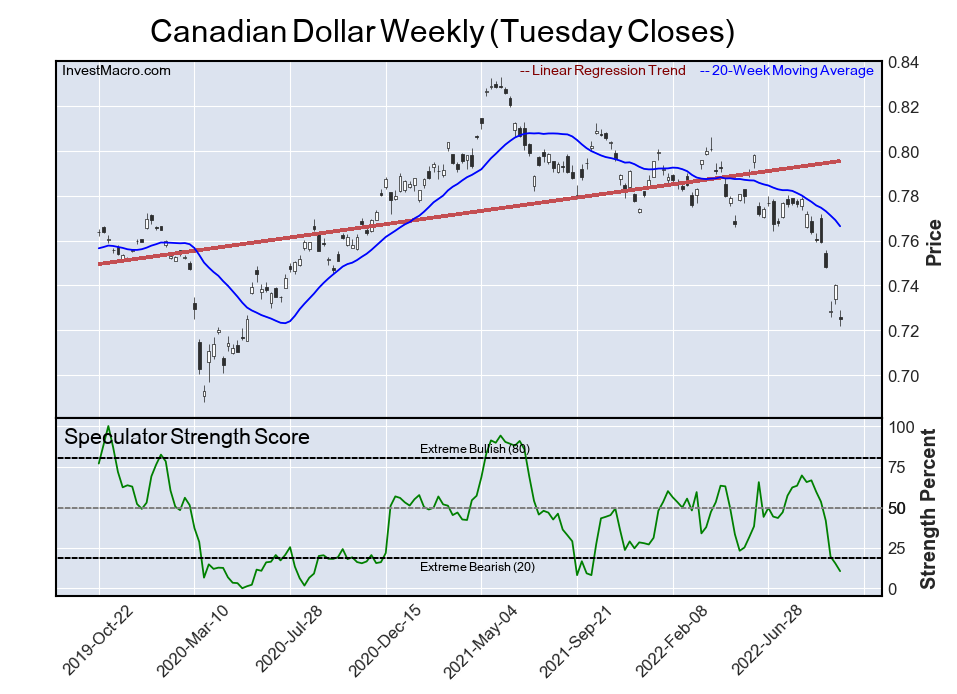
Canadian Dollar Futures:
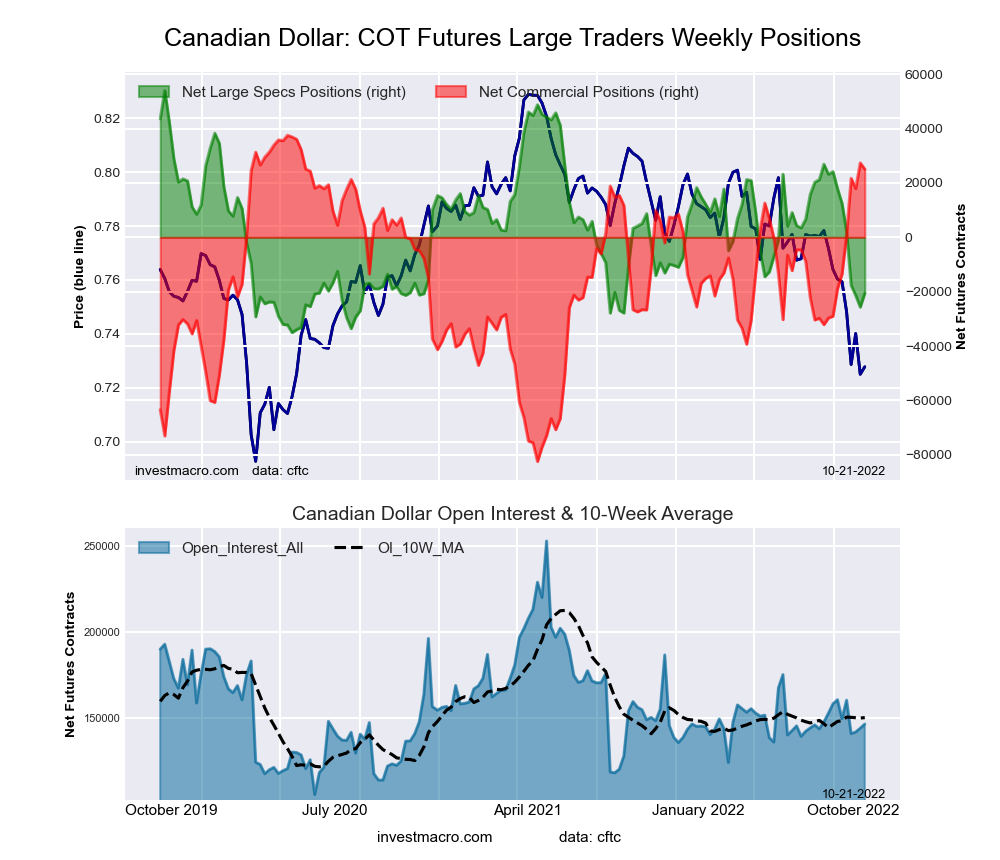
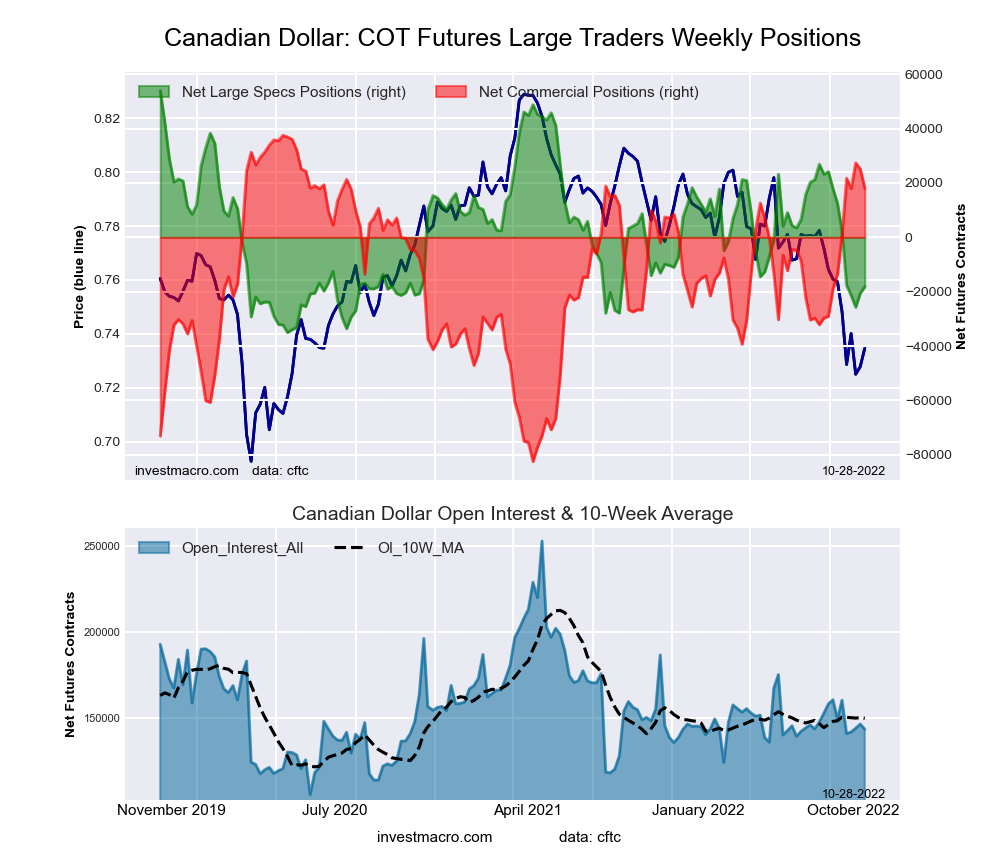 The Canadian Dollar large speculator standing this week equaled a net position of -18,155 contracts in the data reported through Tuesday. This was a weekly gain of 2,418 contracts from the previous week which had a total of -20,573 net contracts.
This week’s current strength score (the trader positioning range over the past three years, measured from 0 to 100) shows the speculators are currently Bearish-Extreme with a score of 19.0 percent. The commercials are Bullish-Extreme with a score of 83.8 percent and the small traders (not shown in chart) are Bearish with a score of 30.3 percent.
| CANADIAN DOLLAR Statistics | SPECULATORS | COMMERCIALS | SMALL TRADERS |
| – Percent of Open Interest Longs: | 24.8 | 51.6 | 21.7 |
| – Percent of Open Interest Shorts: | 37.5 | 39.1 | 21.6 |
| – Net Position: | -18,155 | 18,053 | 102 |
| – Gross Longs: | 35,607 | 74,064 | 31,123 |
| – Gross Shorts: | 53,762 | 56,011 | 31,021 |
| – Long to Short Ratio: | 0.7 to 1 | 1.3 to 1 | 1.0 to 1 |
| NET POSITION TREND: | |||
| – Strength Index Score (3 Year Range Pct): | 19.0 | 83.8 | 30.3 |
| – Strength Index Reading (3 Year Range): | Bearish-Extreme | Bullish-Extreme | Bearish |
| NET POSITION MOVEMENT INDEX: | |||
| – 6-Week Change in Strength Index: | -34.3 | 26.3 | -1.9 |
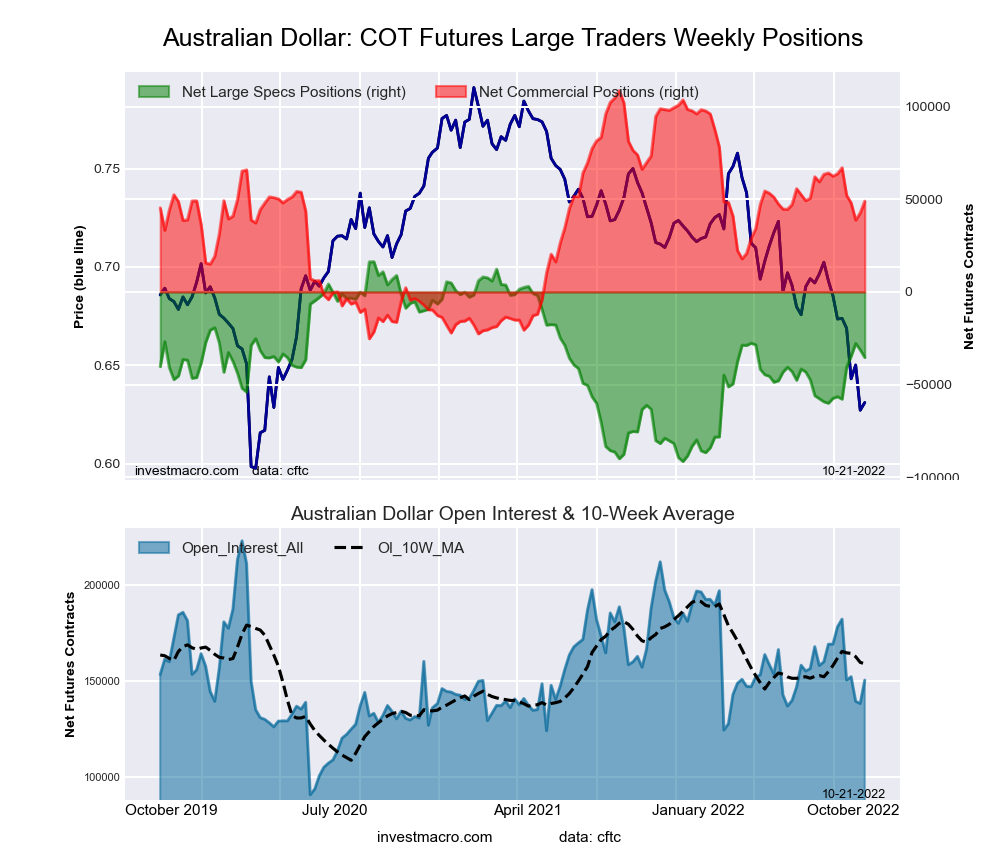
Australian Dollar Futures:
 The Australian Dollar large speculator standing this week equaled a net position of -51,446 contracts in the data reported through Tuesday. This was a weekly decrease of -16,087 contracts from the previous week which had a total of -35,359 net contracts.
This week’s current strength score (the trader positioning range over the past three years, measured from 0 to 100) shows the speculators are currently Bearish with a score of 37.1 percent. The commercials are Bullish with a score of 68.4 percent and the small traders (not shown in chart) are Bearish-Extreme with a score of 16.2 percent.
| AUSTRALIAN DOLLAR Statistics | SPECULATORS | COMMERCIALS | SMALL TRADERS |
| – Percent of Open Interest Longs: | 19.3 | 69.1 | 9.0 |
| – Percent of Open Interest Shorts: | 50.1 | 29.4 | 17.9 |
| – Net Position: | -51,446 | 66,319 | -14,873 |
| – Gross Longs: | 32,159 | 115,337 | 15,022 |
| – Gross Shorts: | 83,605 | 49,018 | 29,895 |
| – Long to Short Ratio: | 0.4 to 1 | 2.4 to 1 | 0.5 to 1 |
| NET POSITION TREND: | |||
| – Strength Index Score (3 Year Range Pct): | 37.1 | 68.4 | 16.2 |
| – Strength Index Reading (3 Year Range): | Bearish | Bullish | Bearish-Extreme |
| NET POSITION MOVEMENT INDEX: | |||
| – 6-Week Change in Strength Index: | 5.9 | -0.5 | -13.9 |
New Zealand Dollar Futures:
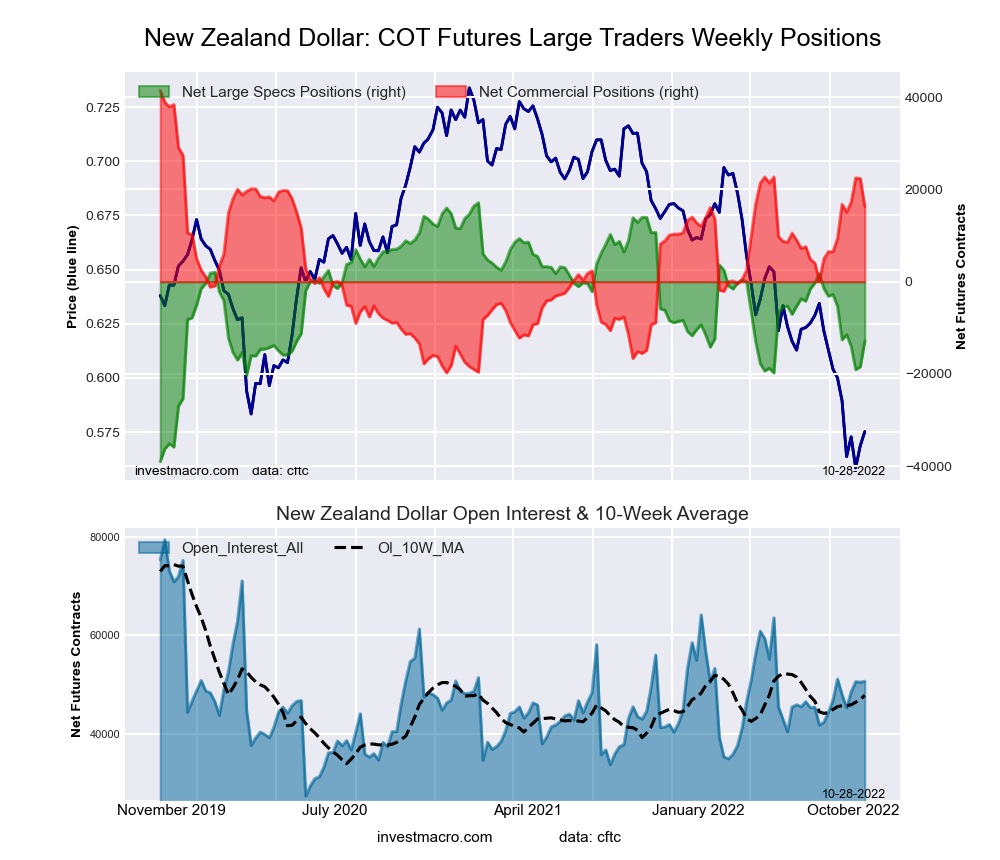 The New Zealand Dollar large speculator standing this week equaled a net position of -12,884 contracts in the data reported through Tuesday. This was a weekly increase of 5,561 contracts from the previous week which had a total of -18,445 net contracts.
This week’s current strength score (the trader positioning range over the past three years, measured from 0 to 100) shows the speculators are currently Bearish with a score of 46.5 percent. The commercials are Bullish with a score of 58.9 percent and the small traders (not shown in chart) are Bearish-Extreme with a score of 12.5 percent.
| NEW ZEALAND DOLLAR Statistics | SPECULATORS | COMMERCIALS | SMALL TRADERS |
| – Percent of Open Interest Longs: | 30.9 | 62.4 | 5.9 |
| – Percent of Open Interest Shorts: | 56.3 | 30.2 | 12.6 |
| – Net Position: | -12,884 | 16,289 | -3,405 |
| – Gross Longs: | 15,639 | 31,568 | 2,983 |
| – Gross Shorts: | 28,523 | 15,279 | 6,388 |
| – Long to Short Ratio: | 0.5 to 1 | 2.1 to 1 | 0.5 to 1 |
| NET POSITION TREND: | |||
| – Strength Index Score (3 Year Range Pct): | 46.5 | 58.9 | 12.5 |
| – Strength Index Reading (3 Year Range): | Bearish | Bullish | Bearish-Extreme |
| NET POSITION MOVEMENT INDEX: | |||
| – 6-Week Change in Strength Index: | -13.5 | 11.2 | 8.1 |
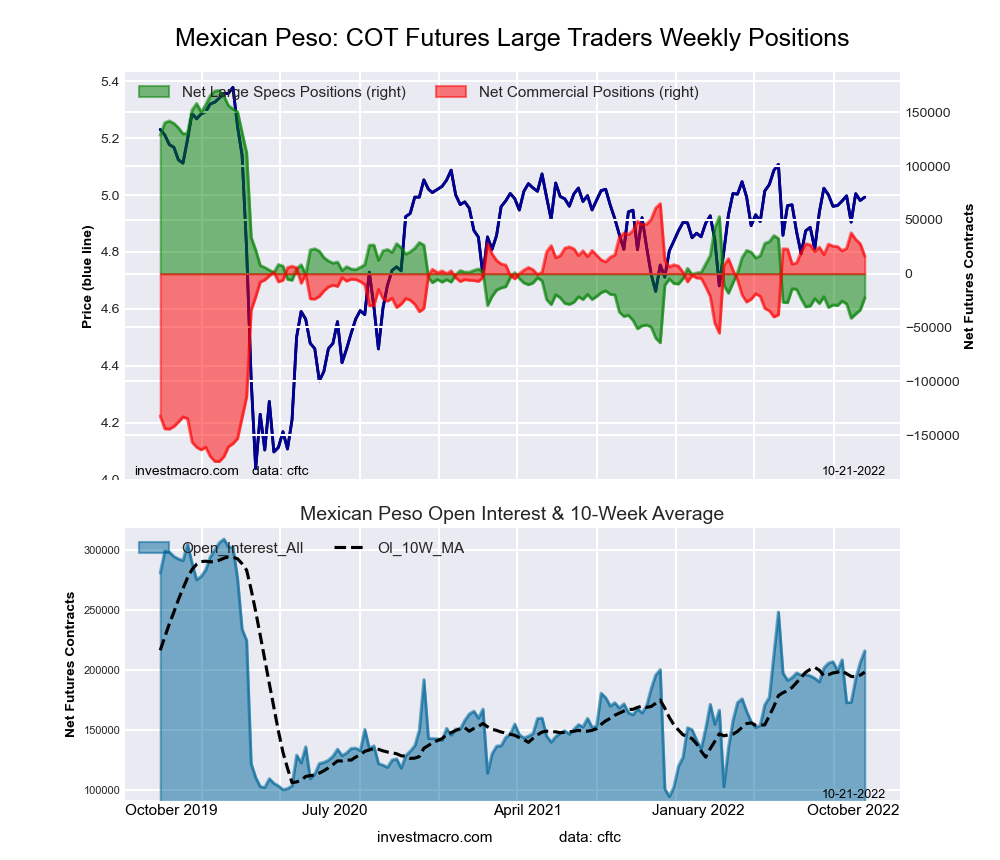
Mexican Peso Futures:
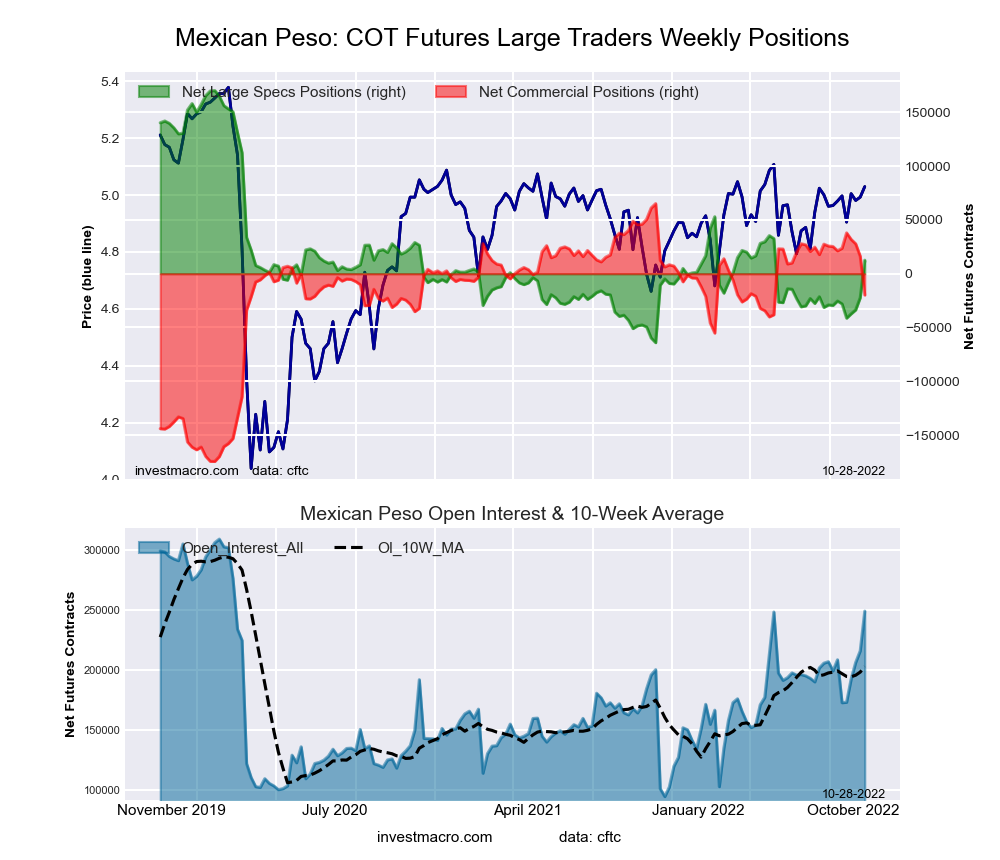 The Mexican Peso large speculator standing this week equaled a net position of 12,574 contracts in the data reported through Tuesday. This was a weekly gain of 34,868 contracts from the previous week which had a total of -22,294 net contracts.
This week’s current strength score (the trader positioning range over the past three years, measured from 0 to 100) shows the speculators are currently Bearish with a score of 32.7 percent. The commercials are Bullish with a score of 64.5 percent and the small traders (not shown in chart) are Bullish with a score of 73.7 percent.
| MEXICAN PESO Statistics | SPECULATORS | COMMERCIALS | SMALL TRADERS |
| – Percent of Open Interest Longs: | 64.9 | 31.6 | 3.4 |
| – Percent of Open Interest Shorts: | 59.9 | 39.6 | 0.5 |
| – Net Position: | 12,574 | -19,809 | 7,235 |
| – Gross Longs: | 161,558 | 78,742 | 8,379 |
| – Gross Shorts: | 148,984 | 98,551 | 1,144 |
| – Long to Short Ratio: | 1.1 to 1 | 0.8 to 1 | 7.3 to 1 |
| NET POSITION TREND: | |||
| – Strength Index Score (3 Year Range Pct): | 32.7 | 64.5 | 73.7 |
| – Strength Index Reading (3 Year Range): | Bearish | Bullish | Bullish |
| NET POSITION MOVEMENT INDEX: | |||
| – 6-Week Change in Strength Index: | 16.2 | -17.2 | 13.5 |
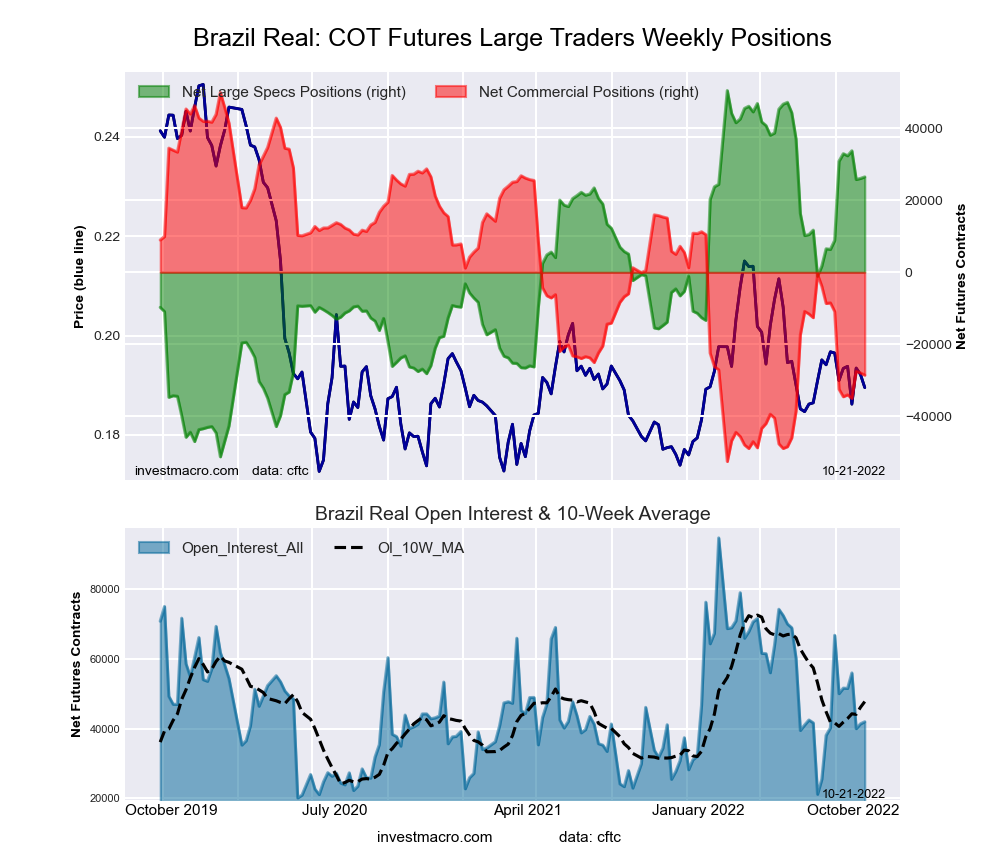
Brazilian Real Futures:
 The Brazilian Real large speculator standing this week equaled a net position of 29,179 contracts in the data reported through Tuesday. This was a weekly advance of 2,681 contracts from the previous week which had a total of 26,498 net contracts.
This week’s current strength score (the trader positioning range over the past three years, measured from 0 to 100) shows the speculators are currently Bullish with a score of 79.1 percent. The commercials are Bearish with a score of 20.5 percent and the small traders (not shown in chart) are Bullish-Extreme with a score of 93.0 percent.
| BRAZIL REAL Statistics | SPECULATORS | COMMERCIALS | SMALL TRADERS |
| – Percent of Open Interest Longs: | 72.9 | 16.1 | 8.6 |
| – Percent of Open Interest Shorts: | 6.1 | 88.5 | 3.1 |
| – Net Position: | 29,179 | -31,590 | 2,411 |
| – Gross Longs: | 31,835 | 7,041 | 3,746 |
| – Gross Shorts: | 2,656 | 38,631 | 1,335 |
| – Long to Short Ratio: | 12.0 to 1 | 0.2 to 1 | 2.8 to 1 |
| NET POSITION TREND: | |||
| – Strength Index Score (3 Year Range Pct): | 79.1 | 20.5 | 93.0 |
| – Strength Index Reading (3 Year Range): | Bullish | Bearish | Bullish-Extreme |
| NET POSITION MOVEMENT INDEX: | |||
| – 6-Week Change in Strength Index: | -3.7 | 2.9 | 9.2 |
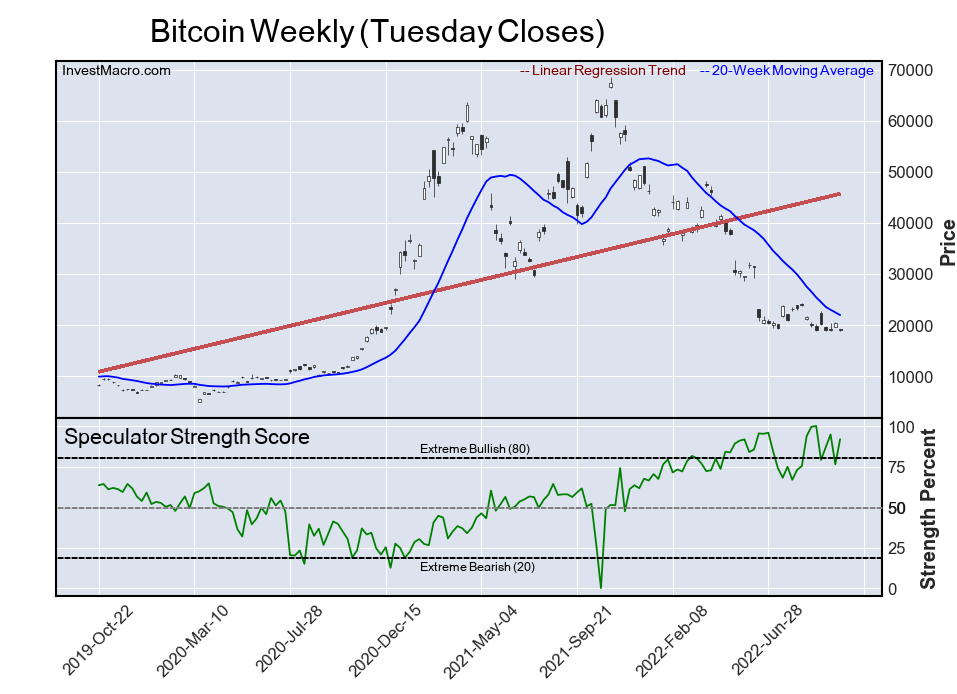
Bitcoin Futures:
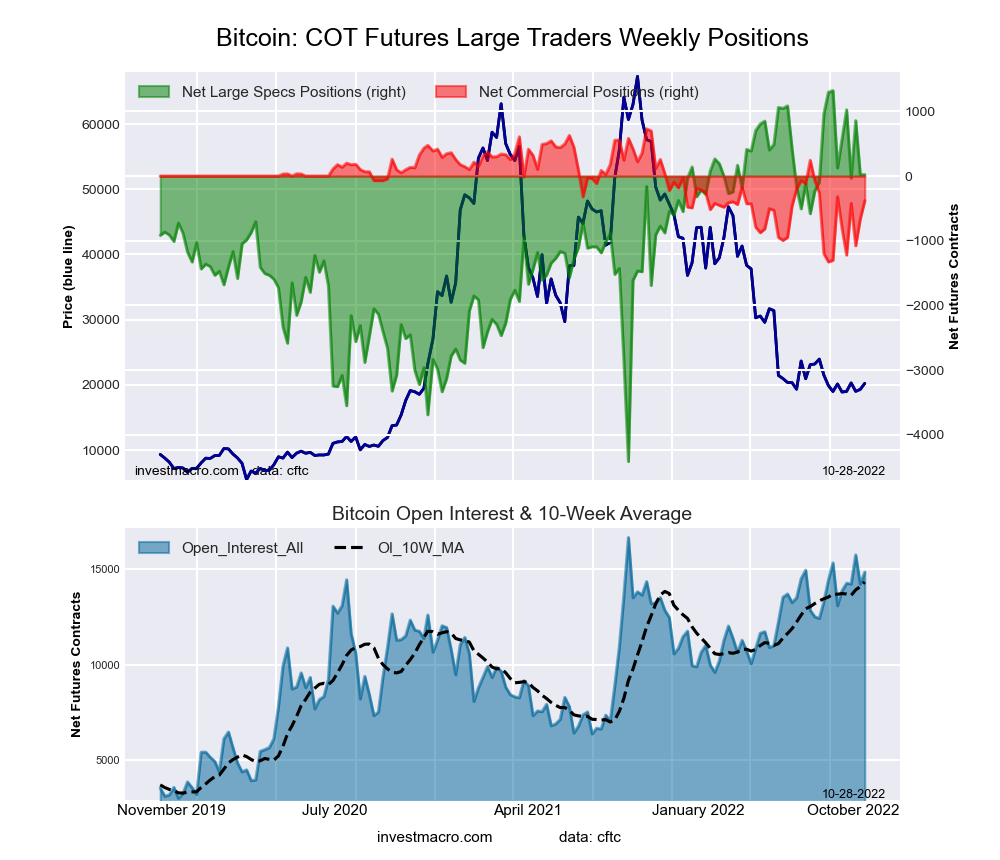 The Bitcoin large speculator standing this week equaled a net position of 23 contracts in the data reported through Tuesday. This was a weekly advance of 1 contracts from the previous week which had a total of 22 net contracts.
This week’s current strength score (the trader positioning range over the past three years, measured from 0 to 100) shows the speculators are currently Bullish with a score of 77.3 percent. The commercials are Bearish with a score of 46.1 percent and the small traders (not shown in chart) are Bearish with a score of 21.1 percent.
| BITCOIN Statistics | SPECULATORS | COMMERCIALS | SMALL TRADERS |
| – Percent of Open Interest Longs: | 74.6 | 4.0 | 7.9 |
| – Percent of Open Interest Shorts: | 74.5 | 6.6 | 5.5 |
| – Net Position: | 23 | -380 | 357 |
| – Gross Longs: | 11,084 | 601 | 1,176 |
| – Gross Shorts: | 11,061 | 981 | 819 |
| – Long to Short Ratio: | 1.0 to 1 | 0.6 to 1 | 1.4 to 1 |
| NET POSITION TREND: | |||
| – Strength Index Score (3 Year Range Pct): | 77.3 | 46.1 | 21.1 |
| – Strength Index Reading (3 Year Range): | Bullish | Bearish | Bearish |
| NET POSITION MOVEMENT INDEX: | |||
| – 6-Week Change in Strength Index: | -1.8 | -2.9 | 3.7 |
Article By InvestMacro – Receive our weekly COT Newsletter
*COT Report: The COT data, released weekly to the public each Friday, is updated through the most recent Tuesday (data is 3 days old) and shows a quick view of how large speculators or non-commercials (for-profit traders) were positioned in the futures markets.
The CFTC categorizes trader positions according to commercial hedgers (traders who use futures contracts for hedging as part of the business), non-commercials (large traders who speculate to realize trading profits) and nonreportable traders (usually small traders/speculators) as well as their open interest (contracts open in the market at time of reporting). See CFTC criteria here.


