
By InvestMacro
Here are the latest charts and statistics for the Commitment of Traders (COT) data published by the Commodities Futures Trading Commission (CFTC).
The latest COT data is updated through Tuesday January 24th and shows a quick view of how large traders (for-profit speculators and commercial entities) were positioned in the futures markets.
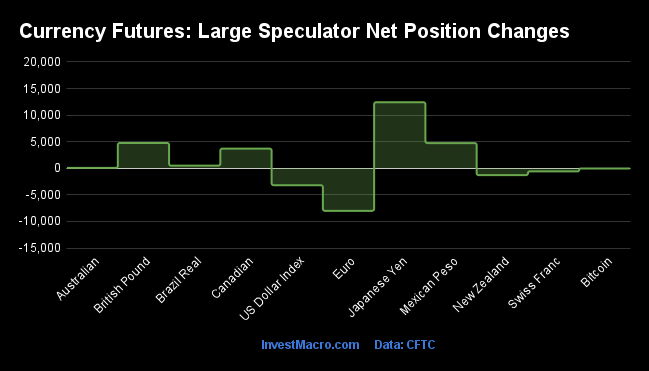
Weekly Speculator Changes led by Gold & Copper
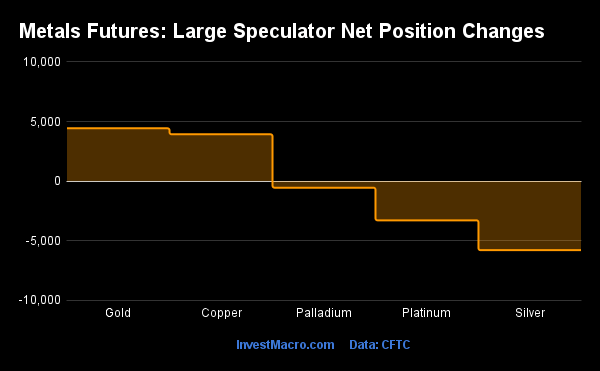
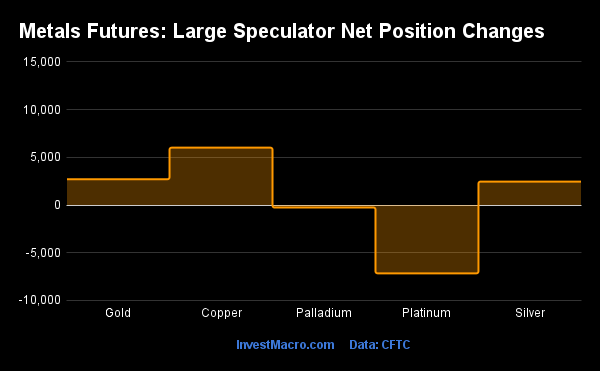
The COT metals markets speculator bets were lower this week as two out of the five precious metals markets we cover had higher positioning while the other three markets had lower speculator contracts.
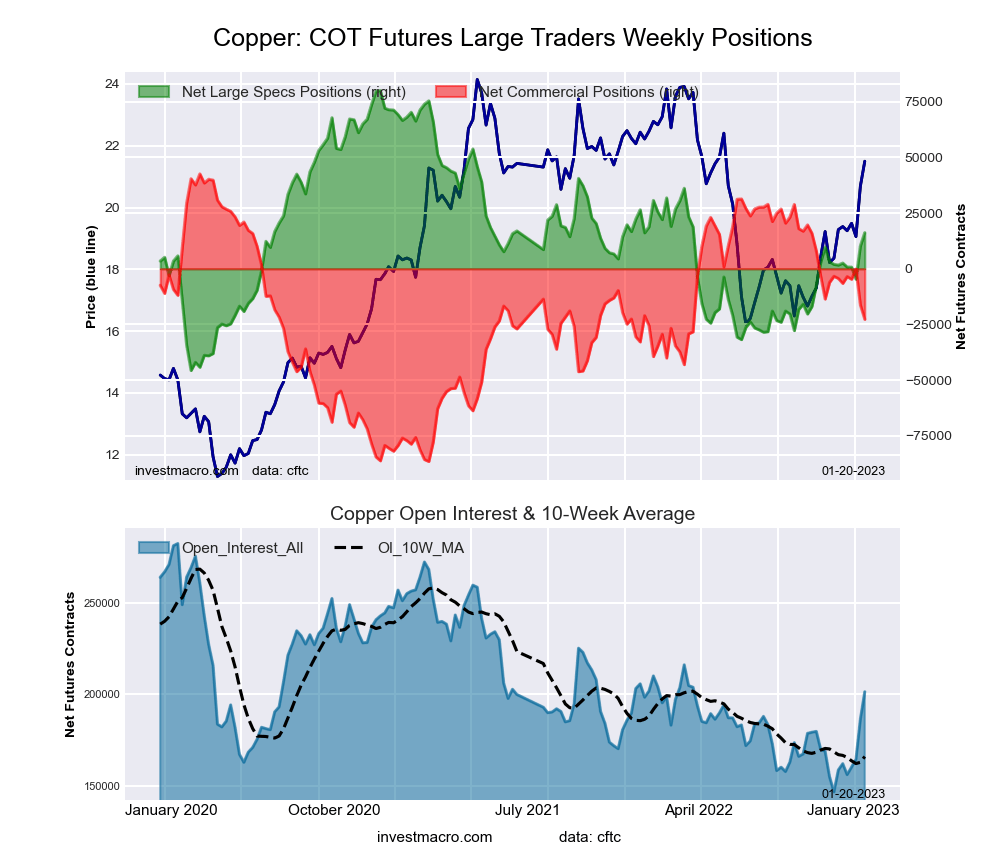
Leading the gains for the metals was Gold (4,433 contracts) with Copper (3,932 contracts) also showing a positive week.
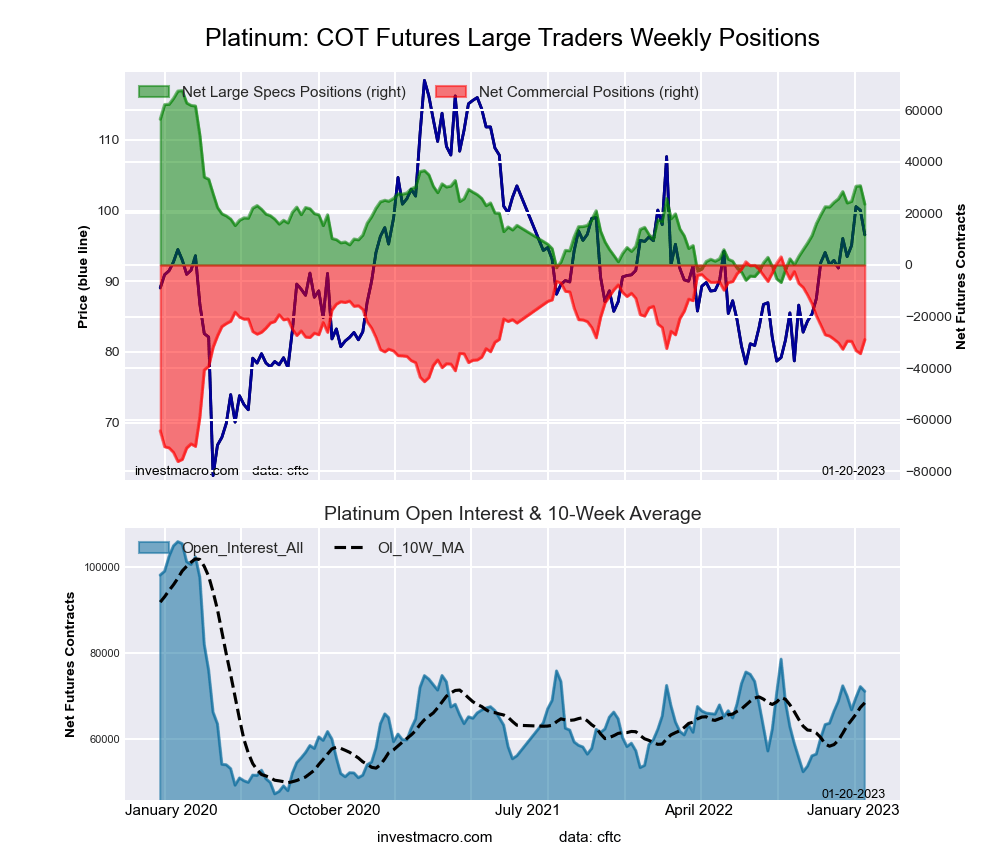
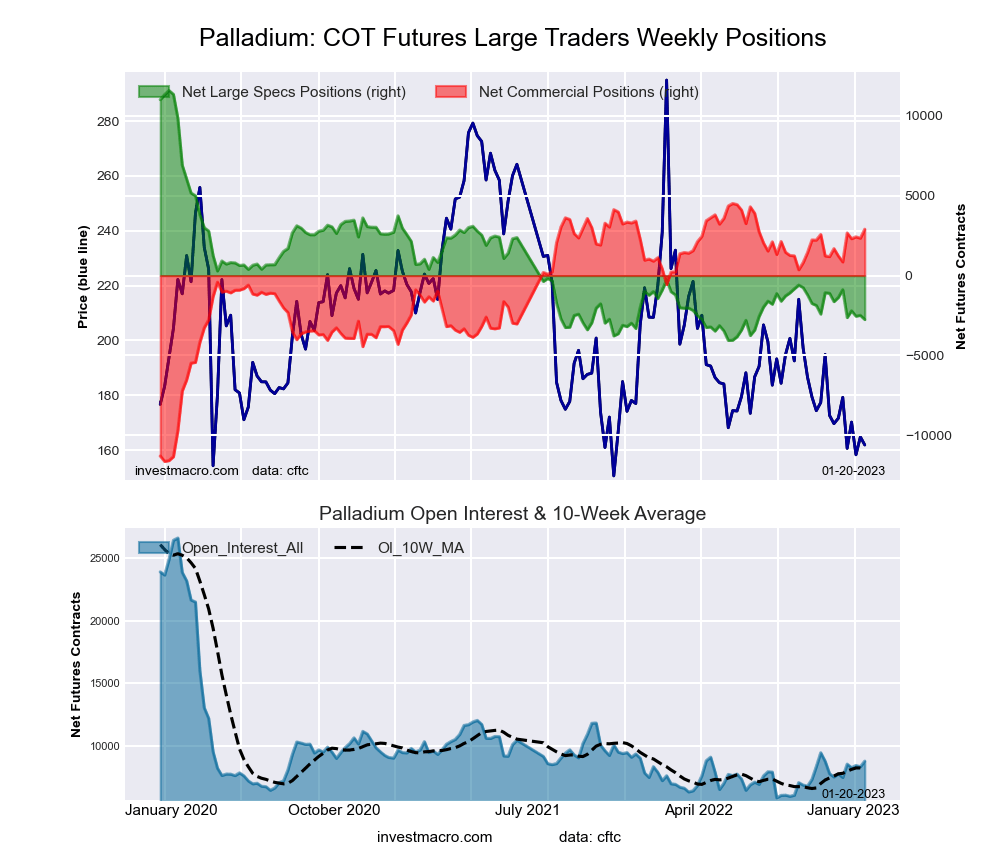
The markets with declines in speculator bets for the week were Silver (-5,784 contracts), Platinum (-3,283 contracts) and Palladium (-546 contracts) also seeing lower bets on the week.
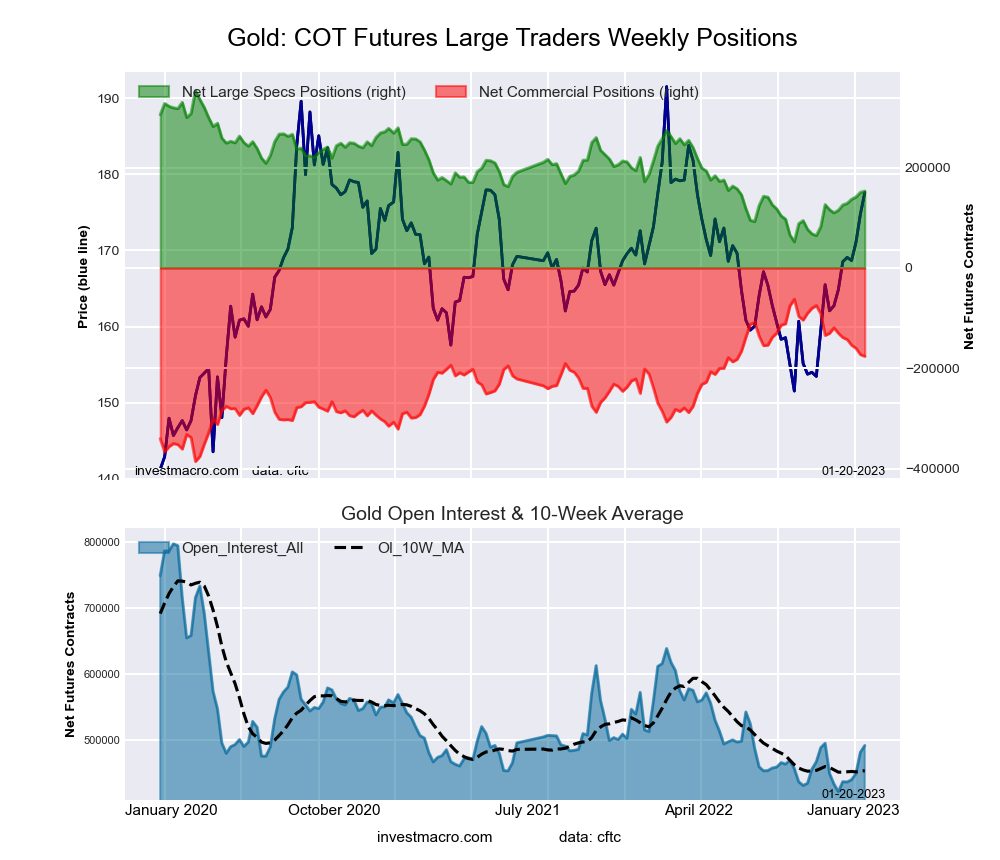
Highlighting the COT metals data this week is the continued bullishness for the Gold speculative positions. The large speculator position in Gold futures advanced once again this week for an eighth straight week and for the tenth time out of the past twelve weeks. The Gold position has now risen from a total of +64,623 contracts on November 1st to a new 30-week high at a total of +157,673 contracts this week.
The Gold futures price closed slightly higher again this week and has now been up for six consecutive weeks. This week’s high was right below the $1,950.00 level and marked the highest Gold prices have reached since April. Gold may be due for a breather with the daily RSI Indicator showing overbought levels but with the US Dollar trending lower, Gold may have a bright outlook in 2023.
| Jan-24-2023 | OI | OI-Index | Spec-Net | Spec-Index | Com-Net | COM-Index | Smalls-Net | Smalls-Index |
|---|---|---|---|---|---|---|---|---|
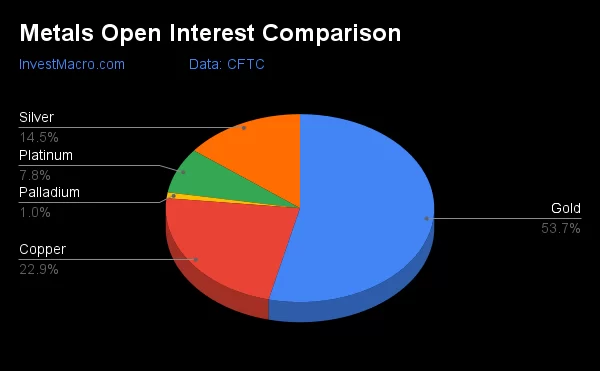
| Gold | 499,927 | 25 | 157,673 | 35 | -180,554 | 63 | 22,881 | 37 |
| Silver | 134,922 | 12 | 25,684 | 42 | -39,461 | 58 | 13,777 | 41 |
| Copper | 213,398 | 52 | 20,170 | 52 | -26,542 | 46 | 6,372 | 62 |
| Palladium | 9,363 | 20 | -3,297 | 8 | 3,534 | 91 | -237 | 27 |
| Platinum | 72,613 | 46 | 20,261 | 39 | -25,819 | 61 | 5,558 | 42 |
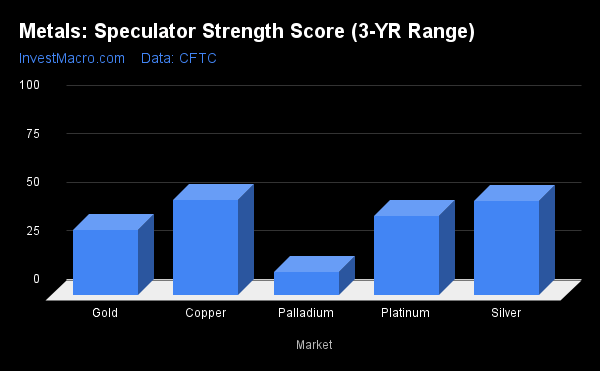
Strength Scores led by Copper & Silver
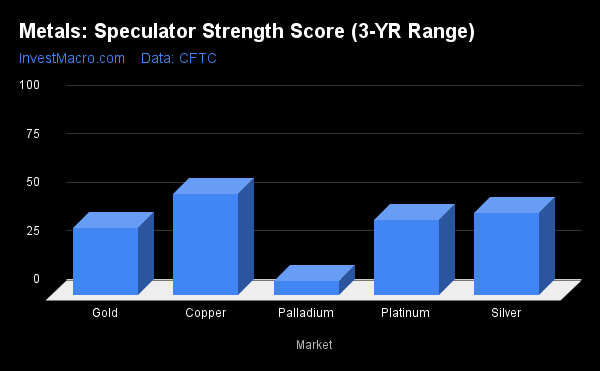
COT Strength Scores (a normalized measure of Speculator positions over a 3-Year range, from 0 to 100 where above 80 is Extreme-Bullish and below 20 is Extreme-Bearish) showed that the Copper (52 percent) leads the metals markets this week. Silver (42 percent) comes in as the next highest in the weekly strength scores.
On the downside, Palladium (8 percent) comes in at the lowest strength level currently and is in Extreme-Bearish territory (below 20 percent). The next lowest strength score was Gold (35 percent).
Strength Statistics:
Gold (35.0 percent) vs Gold previous week (33.5 percent)
Silver (42.4 percent) vs Silver previous week (48.8 percent)
Copper (52.4 percent) vs Copper previous week (49.2 percent)
Platinum (38.8 percent) vs Platinum previous week (43.6 percent)
Palladium (7.5 percent) vs Palladium previous week (12.9 percent)
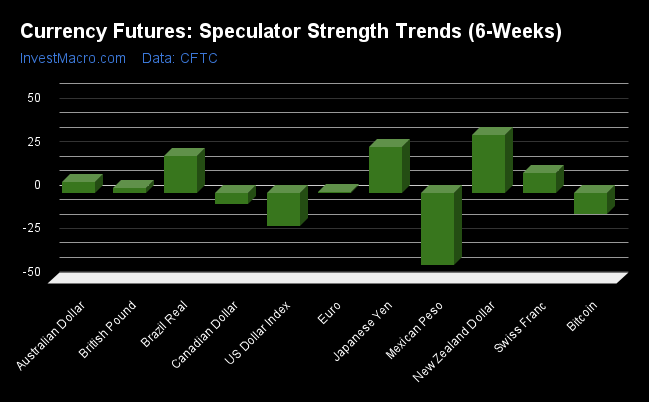
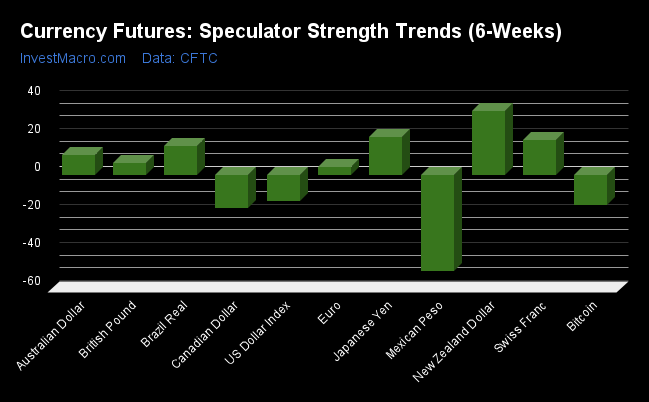
Copper & Gold top the 6-Week Strength Trends
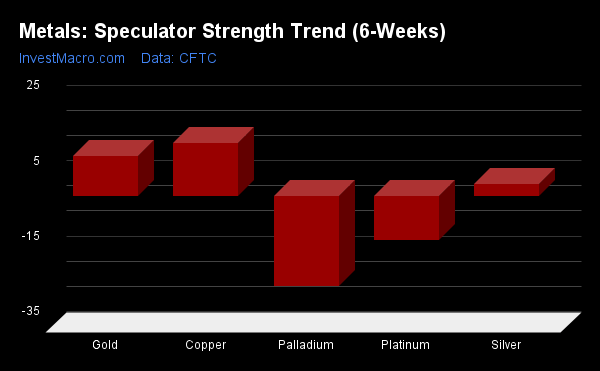
COT Strength Score Trends (or move index, calculates the 6-week changes in strength scores) showed that Copper (14 percent) leads the past six weeks trends for metals. Gold (11 percent) is the next highest positive mover in the latest trends data.
Palladium (-24 percent) leads the downside trend scores currently with Platinum (-12 percent) as the next market with lower trend scores.
Move Statistics:
Gold (10.6 percent) vs Gold previous week (12.6 percent)
Silver (3.2 percent) vs Silver previous week (13.5 percent)
Copper (14.0 percent) vs Copper previous week (11.6 percent)
Platinum (-11.8 percent) vs Platinum previous week (-3.0 percent)
Palladium (-23.9 percent) vs Palladium previous week (-13.7 percent)
Individual Markets:
Gold Comex Futures:
 The Gold Comex Futures large speculator standing this week totaled a net position of 157,673 contracts in the data reported through Tuesday. This was a weekly boost of 4,433 contracts from the previous week which had a total of 153,240 net contracts.
This week’s current strength score (the trader positioning range over the past three years, measured from 0 to 100) shows the speculators are currently Bearish with a score of 35.0 percent. The commercials are Bullish with a score of 63.4 percent and the small traders (not shown in chart) are Bearish with a score of 37.3 percent.
| Gold Futures Statistics | SPECULATORS | COMMERCIALS | SMALL TRADERS |
| – Percent of Open Interest Longs: | 50.7 | 25.5 | 9.6 |
| – Percent of Open Interest Shorts: | 19.1 | 61.6 | 5.0 |
| – Net Position: | 157,673 | -180,554 | 22,881 |
| – Gross Longs: | 253,311 | 127,419 | 47,880 |
| – Gross Shorts: | 95,638 | 307,973 | 24,999 |
| – Long to Short Ratio: | 2.6 to 1 | 0.4 to 1 | 1.9 to 1 |
| NET POSITION TREND: | |||
| – Strength Index Score (3 Year Range Pct): | 35.0 | 63.4 | 37.3 |
| – Strength Index Reading (3 Year Range): | Bearish | Bullish | Bearish |
| NET POSITION MOVEMENT INDEX: | |||
| – 6-Week Change in Strength Index: | 10.6 | -13.0 | 25.1 |
Silver Comex Futures:
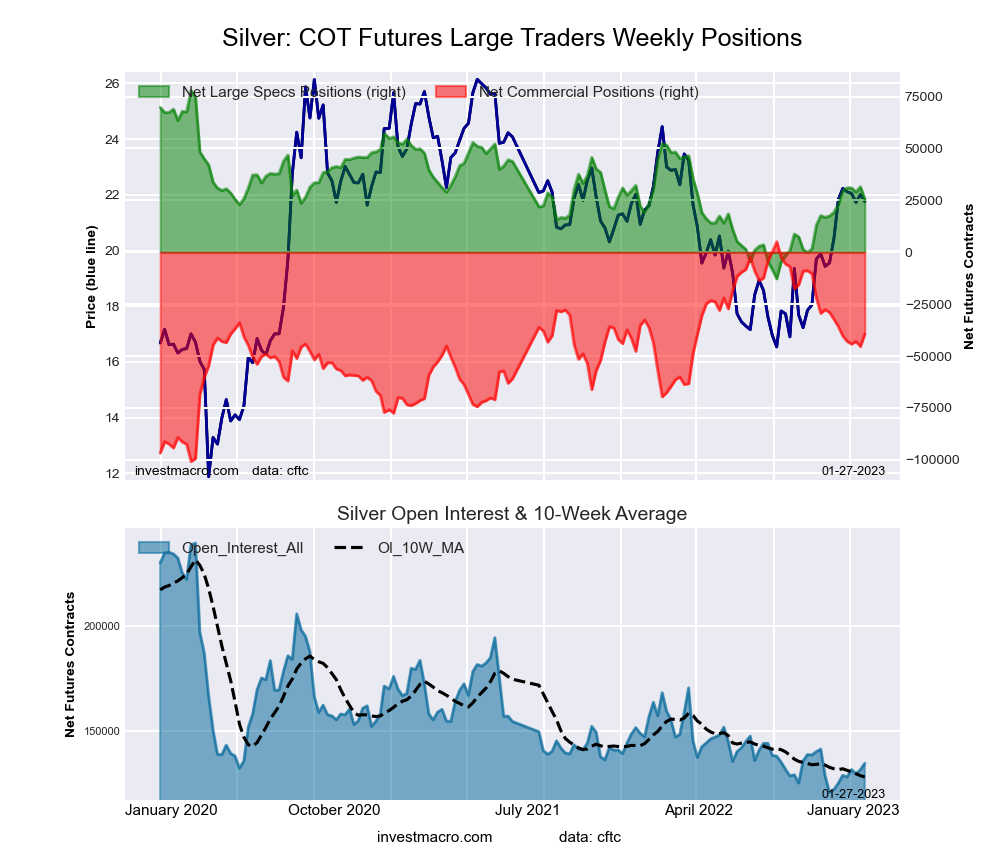 The Silver Comex Futures large speculator standing this week totaled a net position of 25,684 contracts in the data reported through Tuesday. This was a weekly decline of -5,784 contracts from the previous week which had a total of 31,468 net contracts.
This week’s current strength score (the trader positioning range over the past three years, measured from 0 to 100) shows the speculators are currently Bearish with a score of 42.4 percent. The commercials are Bullish with a score of 57.9 percent and the small traders (not shown in chart) are Bearish with a score of 41.0 percent.
| Silver Futures Statistics | SPECULATORS | COMMERCIALS | SMALL TRADERS |
| – Percent of Open Interest Longs: | 41.2 | 35.1 | 17.7 |
| – Percent of Open Interest Shorts: | 22.2 | 64.3 | 7.5 |
| – Net Position: | 25,684 | -39,461 | 13,777 |
| – Gross Longs: | 55,595 | 47,359 | 23,875 |
| – Gross Shorts: | 29,911 | 86,820 | 10,098 |
| – Long to Short Ratio: | 1.9 to 1 | 0.5 to 1 | 2.4 to 1 |
| NET POSITION TREND: | |||
| – Strength Index Score (3 Year Range Pct): | 42.4 | 57.9 | 41.0 |
| – Strength Index Reading (3 Year Range): | Bearish | Bullish | Bearish |
| NET POSITION MOVEMENT INDEX: | |||
| – 6-Week Change in Strength Index: | 3.2 | -3.5 | 4.2 |
Copper Grade #1 Futures:
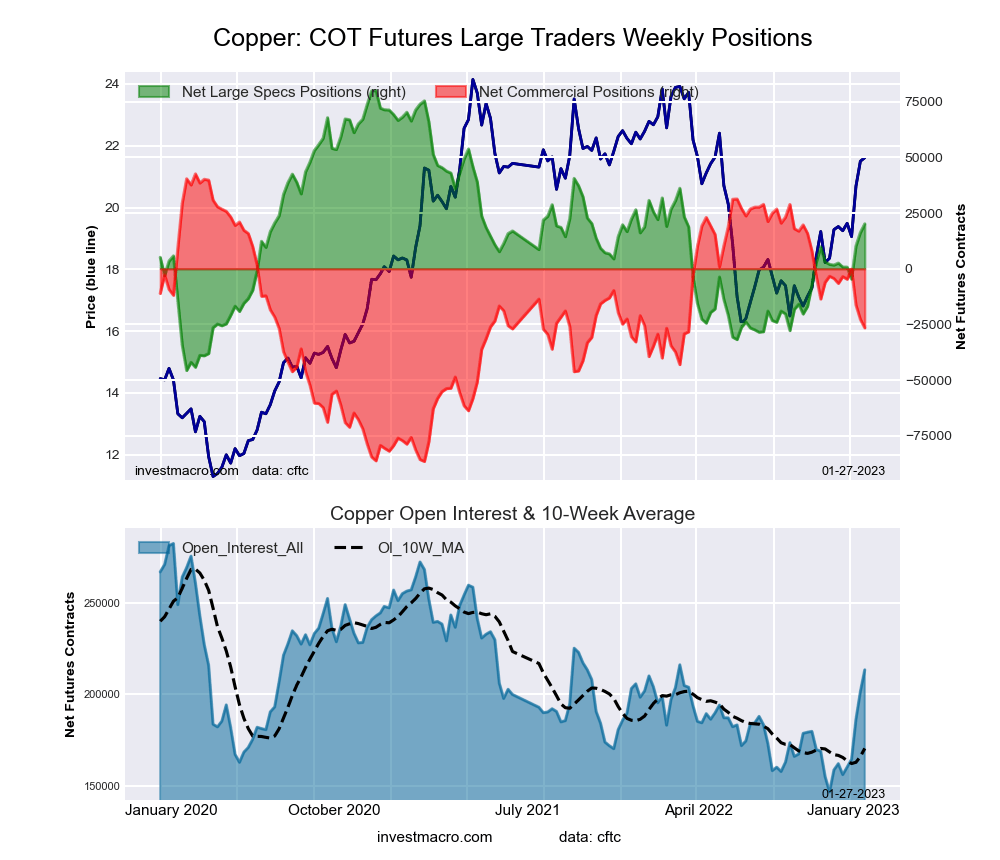 The Copper Grade #1 Futures large speculator standing this week totaled a net position of 20,170 contracts in the data reported through Tuesday. This was a weekly increase of 3,932 contracts from the previous week which had a total of 16,238 net contracts.
This week’s current strength score (the trader positioning range over the past three years, measured from 0 to 100) shows the speculators are currently Bullish with a score of 52.4 percent. The commercials are Bearish with a score of 46.4 percent and the small traders (not shown in chart) are Bullish with a score of 62.1 percent.
| Copper Futures Statistics | SPECULATORS | COMMERCIALS | SMALL TRADERS |
| – Percent of Open Interest Longs: | 41.2 | 35.0 | 9.3 |
| – Percent of Open Interest Shorts: | 31.8 | 47.4 | 6.3 |
| – Net Position: | 20,170 | -26,542 | 6,372 |
| – Gross Longs: | 87,941 | 74,715 | 19,913 |
| – Gross Shorts: | 67,771 | 101,257 | 13,541 |
| – Long to Short Ratio: | 1.3 to 1 | 0.7 to 1 | 1.5 to 1 |
| NET POSITION TREND: | |||
| – Strength Index Score (3 Year Range Pct): | 52.4 | 46.4 | 62.1 |
| – Strength Index Reading (3 Year Range): | Bullish | Bearish | Bullish |
| NET POSITION MOVEMENT INDEX: | |||
| – 6-Week Change in Strength Index: | 14.0 | -15.5 | 13.7 |
Platinum Futures:
 The Platinum Futures large speculator standing this week totaled a net position of 20,261 contracts in the data reported through Tuesday. This was a weekly fall of -3,283 contracts from the previous week which had a total of 23,544 net contracts.
This week’s current strength score (the trader positioning range over the past three years, measured from 0 to 100) shows the speculators are currently Bearish with a score of 38.8 percent. The commercials are Bullish with a score of 60.9 percent and the small traders (not shown in chart) are Bearish with a score of 42.5 percent.
| Platinum Futures Statistics | SPECULATORS | COMMERCIALS | SMALL TRADERS |
| – Percent of Open Interest Longs: | 54.1 | 30.9 | 11.3 |
| – Percent of Open Interest Shorts: | 26.2 | 66.4 | 3.6 |
| – Net Position: | 20,261 | -25,819 | 5,558 |
| – Gross Longs: | 39,279 | 22,428 | 8,206 |
| – Gross Shorts: | 19,018 | 48,247 | 2,648 |
| – Long to Short Ratio: | 2.1 to 1 | 0.5 to 1 | 3.1 to 1 |
| NET POSITION TREND: | |||
| – Strength Index Score (3 Year Range Pct): | 38.8 | 60.9 | 42.5 |
| – Strength Index Reading (3 Year Range): | Bearish | Bullish | Bearish |
| NET POSITION MOVEMENT INDEX: | |||
| – 6-Week Change in Strength Index: | -11.8 | 9.2 | 18.3 |
Palladium Futures:
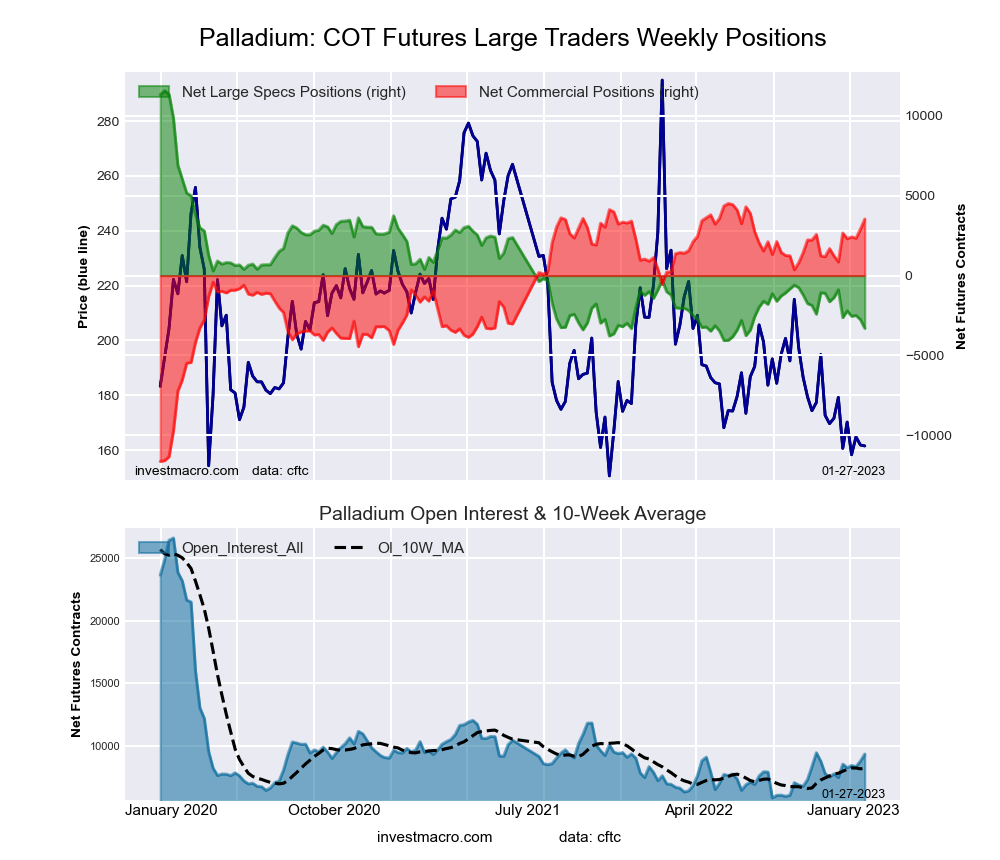 The Palladium Futures large speculator standing this week totaled a net position of -3,297 contracts in the data reported through Tuesday. This was a weekly decline of -546 contracts from the previous week which had a total of -2,751 net contracts.
This week’s current strength score (the trader positioning range over the past three years, measured from 0 to 100) shows the speculators are currently Bearish-Extreme with a score of 7.5 percent. The commercials are Bullish-Extreme with a score of 91.1 percent and the small traders (not shown in chart) are Bearish with a score of 27.5 percent.
| Palladium Futures Statistics | SPECULATORS | COMMERCIALS | SMALL TRADERS |
| – Percent of Open Interest Longs: | 19.1 | 62.2 | 12.9 |
| – Percent of Open Interest Shorts: | 54.3 | 24.5 | 15.5 |
| – Net Position: | -3,297 | 3,534 | -237 |
| – Gross Longs: | 1,787 | 5,826 | 1,212 |
| – Gross Shorts: | 5,084 | 2,292 | 1,449 |
| – Long to Short Ratio: | 0.4 to 1 | 2.5 to 1 | 0.8 to 1 |
| NET POSITION TREND: | |||
| – Strength Index Score (3 Year Range Pct): | 7.5 | 91.1 | 27.5 |
| – Strength Index Reading (3 Year Range): | Bearish-Extreme | Bullish-Extreme | Bearish |
| NET POSITION MOVEMENT INDEX: | |||
| – 6-Week Change in Strength Index: | -23.9 | 24.3 | -16.0 |
Article By InvestMacro – Receive our weekly COT Newsletter
*COT Report: The COT data, released weekly to the public each Friday, is updated through the most recent Tuesday (data is 3 days old) and shows a quick view of how large speculators or non-commercials (for-profit traders) were positioned in the futures markets.
The CFTC categorizes trader positions according to commercial hedgers (traders who use futures contracts for hedging as part of the business), non-commercials (large traders who speculate to realize trading profits) and nonreportable traders (usually small traders/speculators) as well as their open interest (contracts open in the market at time of reporting). See CFTC criteria here.


