
By InvestMacro

Here are the latest charts and statistics for the Commitment of Traders (COT) reports data published by the Commodities Futures Trading Commission (CFTC).
The latest COT data is updated through Tuesday October 25th and shows a quick view of how large traders (for-profit speculators and commercial entities) were positioned in the futures markets.
Live Cattle, Corn & Soybean Meal lead the Weekly Speculator Changes
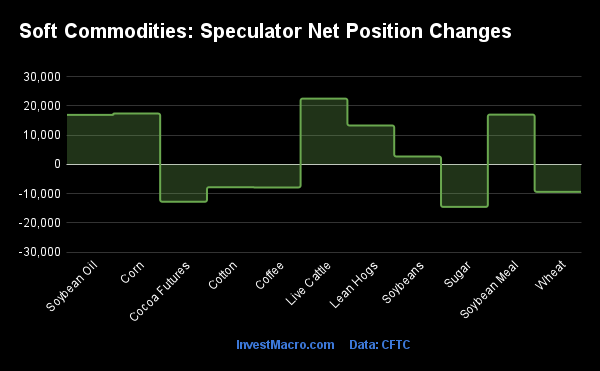
The COT soft commodities speculator bets were slightly higher this week as six out of the eleven soft commodities markets we cover had higher positioning this week while the other five markets had decreases in contracts.
Free Reports:
 Get our Weekly Commitment of Traders Reports - See where the biggest traders (Hedge Funds and Commercial Hedgers) are positioned in the futures markets on a weekly basis.
 Download Our Metatrader 4 Indicators – Put Our Free MetaTrader 4 Custom Indicators on your charts when you join our Weekly Newsletter
Leading the gains for soft commodities markets was Live Cattle (22,470 contracts) with Corn (17,365 contracts), Soybean Meal (17,014 contracts), Soybean Oil (16,918 contracts), Lean Hogs (13,290 contracts) and Soybeans (2,702 contracts) also showing positive weeks.
The softs market leading the declines in speculator bets this week was Sugar (-14,524 contracts) with Cocoa (-12,763 contracts), Wheat (-9,372 contracts), Coffee (-7,872 contracts) and Cotton (-7,787 contracts) also registering lower bets on the week.
Highlighting the COT softs data this week is the continued fall in Coffee speculator positioning. Coffee large speculator bets have decreased for four straight weeks and in seven out of the past eight weeks. The recent weakness has taken a total of -37,336 contracts off the Coffee speculator position in just the past eight weeks. The overall position now sits at a total of +11,351 contracts, marking the lowest weekly level since July 21st of 2020, a span of 118 weeks.
The Coffee price has dropped by approximately 23 percent over the past three weeks and with a decline of almost 10 percent this week alone. The narrative for the Coffee price decline is that price increases have curtailed demand while a potential increase in supply out of Brazil is coming. However, the Intercontinental Exchange that monitors warehouse stocks of Arabica coffee beans has showed that Coffee stocks are at the lowest levels of the past 20 years. The short-term volatility notwithstanding, the big-picture Coffee story is one of rising worldwide demand and revenue but with some measures showing Coffee supply being hampered (current ICE Coffee stocks) and with climate change also likely to play a role in shaping the future Coffee production story as well.
| Oct-25-2022 | OI | OI-Index | Spec-Net | Spec-Index | Com-Net | COM-Index | Smalls-Net | Smalls-Index |
|---|---|---|---|---|---|---|---|---|
| WTI Crude | 1,436,942 | 0 | 249,079 | 10 | -268,026 | 92 | 18,947 | 32 |
| Gold | 456,072 | 7 | 68,032 | 5 | -80,213 | 94 | 12,181 | 10 |
| Silver | 139,085 | 12 | -101 | 14 | -8,857 | 87 | 8,958 | 14 |
| Copper | 179,344 | 17 | -16,919 | 23 | 15,907 | 79 | 1,012 | 31 |
| Palladium | 7,343 | 7 | -1,745 | 14 | 2,228 | 87 | -483 | 13 |
| Platinum | 56,117 | 15 | 11,381 | 24 | -14,971 | 77 | 3,590 | 16 |
| Natural Gas | 970,872 | 5 | -151,766 | 33 | 133,397 | 73 | 18,369 | 24 |
| Brent | 166,931 | 14 | -40,301 | 44 | 36,912 | 55 | 3,389 | 55 |
| Heating Oil | 272,663 | 25 | 20,411 | 72 | -38,238 | 31 | 17,827 | 60 |
| Soybeans | 651,685 | 17 | 57,385 | 31 | -35,301 | 76 | -22,084 | 34 |
| Corn | 1,445,842 | 25 | 329,784 | 72 | -273,645 | 33 | -56,139 | 11 |
| Coffee | 208,280 | 18 | 11,351 | 37 | -13,326 | 68 | 1,975 | 27 |
| Sugar | 723,503 | 6 | 111,888 | 59 | -140,147 | 43 | 28,259 | 43 |
| Wheat | 324,137 | 16 | -12,913 | 2 | 19,896 | 88 | -6,983 | 74 |
Strength Scores led by Soybean Meal
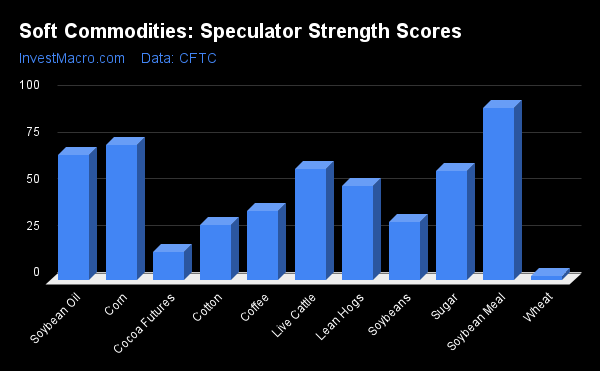
Strength Scores (a normalized measure of Speculator positions over a 3-Year range, from 0 to 100 where above 80 is extreme bullish and below 20 is extreme bearish) showed that Soybean Meal (92.1 percent) continues to lead the soft commodity markets and is in a bullish extreme position (above 80 percent). Corn (72.2 percent) and Soybean Oil (67.0 percent) come in as the next highest soft commodity markets in strength scores.
On the downside, Wheat (2.3 percent) and Cocoa (15.3 percent) come in at the lowest strength levels currently and are both in bearish extreme standings (below 20 percent).
Strength Statistics:
Corn (72.2 percent) vs Corn previous week (69.9 percent)
Sugar (58.7 percent) vs Sugar previous week (61.7 percent)
Coffee (36.8 percent) vs Coffee previous week (45.2 percent)
Soybeans (31.0 percent) vs Soybeans previous week (30.2 percent)
Soybean Oil (67.0 percent) vs Soybean Oil previous week (55.4 percent)
Soybean Meal (92.1 percent) vs Soybean Meal previous week (82.7 percent)
Live Cattle (59.8 percent) vs Live Cattle previous week (31.6 percent)
Lean Hogs (50.7 percent) vs Lean Hogs previous week (36.3 percent)
Cotton (29.6 percent) vs Cotton previous week (35.3 percent)
Cocoa (15.3 percent) vs Cocoa previous week (27.9 percent)
Wheat (2.3 percent) vs Wheat previous week (14.4 percent)
Strength Trends led by Soybean Oil and Sugar
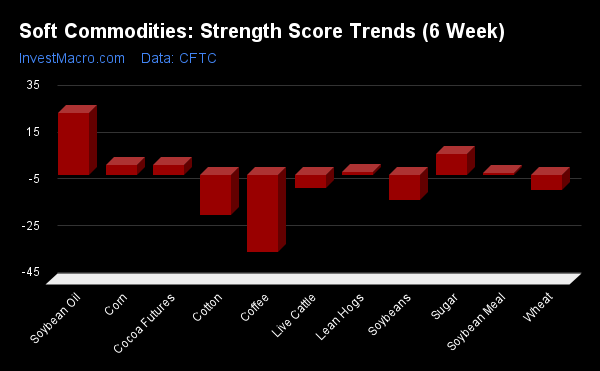
Strength Score Trends (or move index, calculates the 6-week changes in strength scores) show that Soybean Oil (26.6 percent) leads the past six weeks trends for soft commodity markets this week. Sugar (9.2 percent), Corn (4.5 percent) and Cocoa (4.3 percent) are the next highest movers in the latest trends data.
Coffee (-32.9 percent) leads the downside trend scores currently while the next markets with lower trend scores were Cotton (-17.0 percent) followed by Soybeans (-10.7 percent).
Strength Trend Statistics:
Corn (4.5 percent) vs Corn previous week (3.3 percent)
Sugar (9.2 percent) vs Sugar previous week (14.4 percent)
Coffee (-32.9 percent) vs Coffee previous week (-29.7 percent)
Soybeans (-10.7 percent) vs Soybeans previous week (-8.2 percent)
Soybean Oil (26.6 percent) vs Soybean Oil previous week (18.9 percent)
Soybean Meal (1.1 percent) vs Soybean Meal previous week (-4.5 percent)
Live Cattle (-5.4 percent) vs Live Cattle previous week (-26.5 percent)
Lean Hogs (1.3 percent) vs Lean Hogs previous week (-10.1 percent)
Cotton (-17.0 percent) vs Cotton previous week (-13.2 percent)
Cocoa (4.3 percent) vs Cocoa previous week (6.7 percent)
Wheat (-6.2 percent) vs Wheat previous week (8.1 percent)
Individual Soft Commodities Markets:
CORN Futures:
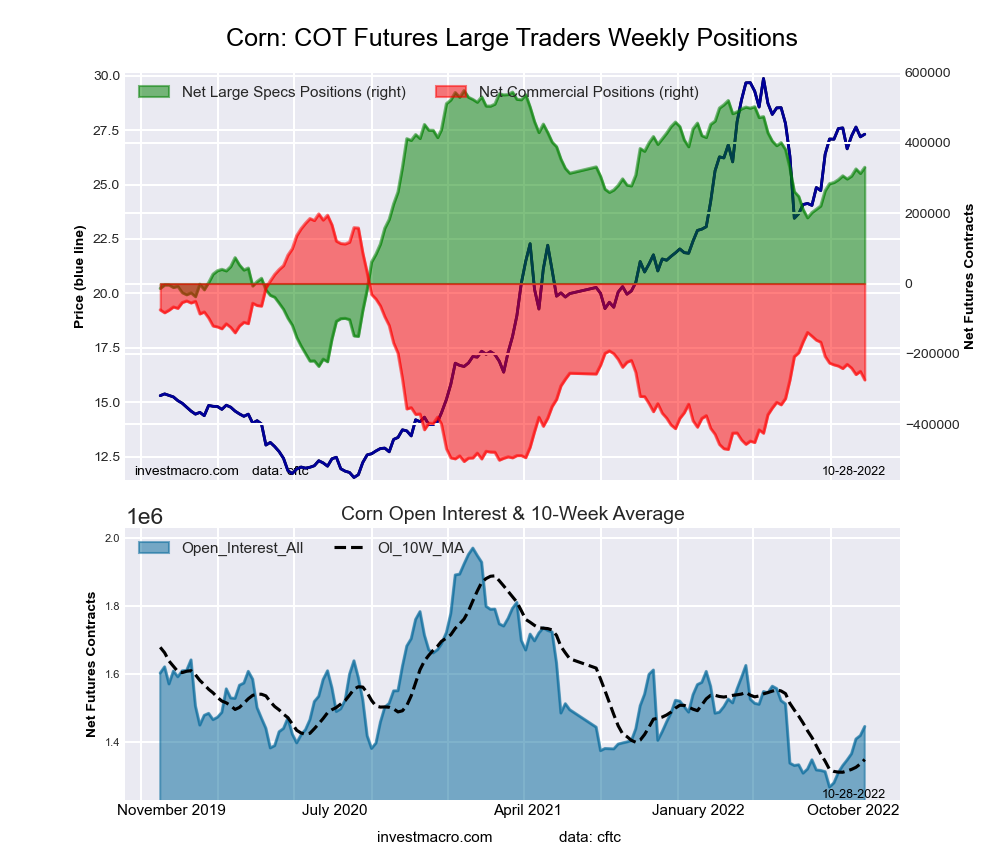 The CORN large speculator standing this week was a net position of 329,784 contracts in the data reported through Tuesday. This was a weekly rise of 17,365 contracts from the previous week which had a total of 312,419 net contracts.
This week’s current strength score (the trader positioning range over the past three years, measured from 0 to 100) shows the speculators are currently Bullish with a score of 72.2 percent. The commercials are Bearish with a score of 32.9 percent and the small traders (not shown in chart) are Bearish-Extreme with a score of 10.8 percent.
| CORN Futures Statistics | SPECULATORS | COMMERCIALS | SMALL TRADERS |
| – Percent of Open Interest Longs: | 31.3 | 43.3 | 8.9 |
| – Percent of Open Interest Shorts: | 8.5 | 62.2 | 12.8 |
| – Net Position: | 329,784 | -273,645 | -56,139 |
| – Gross Longs: | 453,036 | 625,537 | 129,121 |
| – Gross Shorts: | 123,252 | 899,182 | 185,260 |
| – Long to Short Ratio: | 3.7 to 1 | 0.7 to 1 | 0.7 to 1 |
| NET POSITION TREND: | |||
| – Strength Index Score (3 Year Range Pct): | 72.2 | 32.9 | 10.8 |
| – Strength Index Reading (3 Year Range): | Bullish | Bearish | Bearish-Extreme |
| NET POSITION MOVEMENT INDEX: | |||
| – 6-Week Change in Strength Index: | 4.5 | -5.6 | 2.5 |
SUGAR Futures:
 The SUGAR large speculator standing this week was a net position of 111,888 contracts in the data reported through Tuesday. This was a weekly decline of -14,524 contracts from the previous week which had a total of 126,412 net contracts.
This week’s current strength score (the trader positioning range over the past three years, measured from 0 to 100) shows the speculators are currently Bullish with a score of 58.7 percent. The commercials are Bearish with a score of 43.3 percent and the small traders (not shown in chart) are Bearish with a score of 42.8 percent.
| SUGAR Futures Statistics | SPECULATORS | COMMERCIALS | SMALL TRADERS |
| – Percent of Open Interest Longs: | 27.6 | 50.8 | 10.1 |
| – Percent of Open Interest Shorts: | 12.1 | 70.1 | 6.2 |
| – Net Position: | 111,888 | -140,147 | 28,259 |
| – Gross Longs: | 199,761 | 367,374 | 72,823 |
| – Gross Shorts: | 87,873 | 507,521 | 44,564 |
| – Long to Short Ratio: | 2.3 to 1 | 0.7 to 1 | 1.6 to 1 |
| NET POSITION TREND: | |||
| – Strength Index Score (3 Year Range Pct): | 58.7 | 43.3 | 42.8 |
| – Strength Index Reading (3 Year Range): | Bullish | Bearish | Bearish |
| NET POSITION MOVEMENT INDEX: | |||
| – 6-Week Change in Strength Index: | 9.2 | -12.0 | 21.2 |
COFFEE Futures:
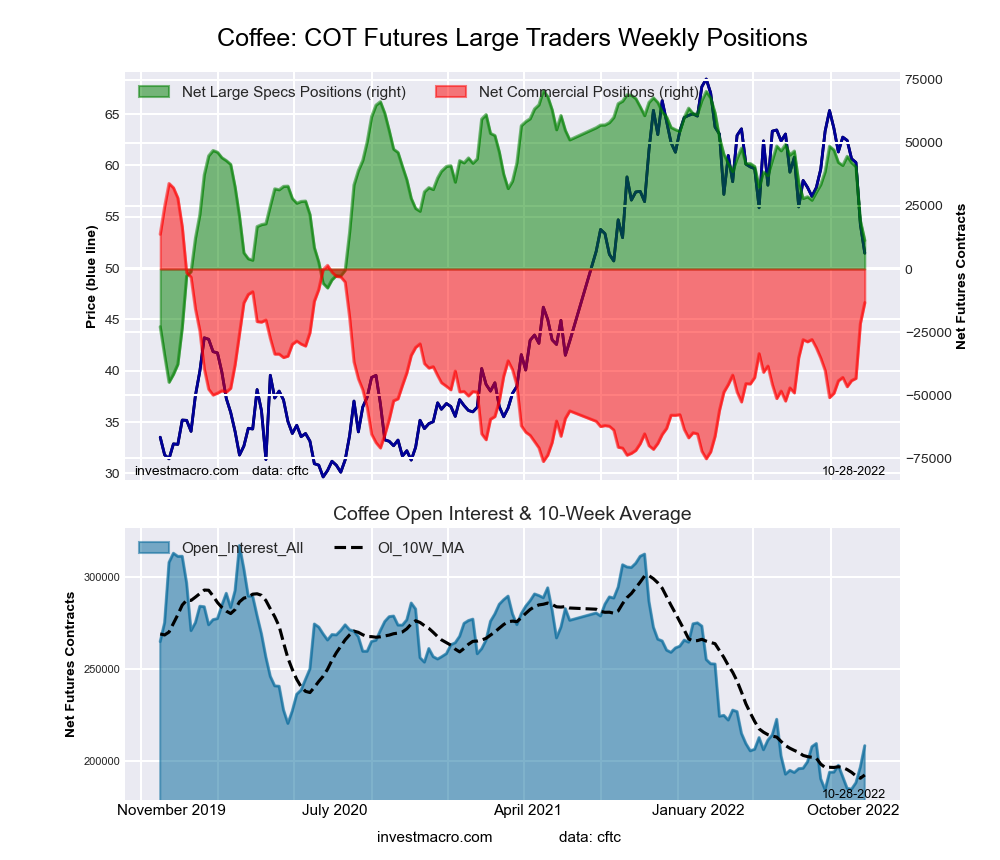 The COFFEE large speculator standing this week was a net position of 11,351 contracts in the data reported through Tuesday. This was a weekly lowering of -7,872 contracts from the previous week which had a total of 19,223 net contracts.
This week’s current strength score (the trader positioning range over the past three years, measured from 0 to 100) shows the speculators are currently Bearish with a score of 36.8 percent. The commercials are Bullish with a score of 67.7 percent and the small traders (not shown in chart) are Bearish with a score of 26.9 percent.
| COFFEE Futures Statistics | SPECULATORS | COMMERCIALS | SMALL TRADERS |
| – Percent of Open Interest Longs: | 20.2 | 50.9 | 4.7 |
| – Percent of Open Interest Shorts: | 14.8 | 57.3 | 3.8 |
| – Net Position: | 11,351 | -13,326 | 1,975 |
| – Gross Longs: | 42,119 | 106,110 | 9,859 |
| – Gross Shorts: | 30,768 | 119,436 | 7,884 |
| – Long to Short Ratio: | 1.4 to 1 | 0.9 to 1 | 1.3 to 1 |
| NET POSITION TREND: | |||
| – Strength Index Score (3 Year Range Pct): | 36.8 | 67.7 | 26.9 |
| – Strength Index Reading (3 Year Range): | Bearish | Bullish | Bearish |
| NET POSITION MOVEMENT INDEX: | |||
| – 6-Week Change in Strength Index: | -32.9 | 33.3 | -1.6 |
SOYBEANS Futures:
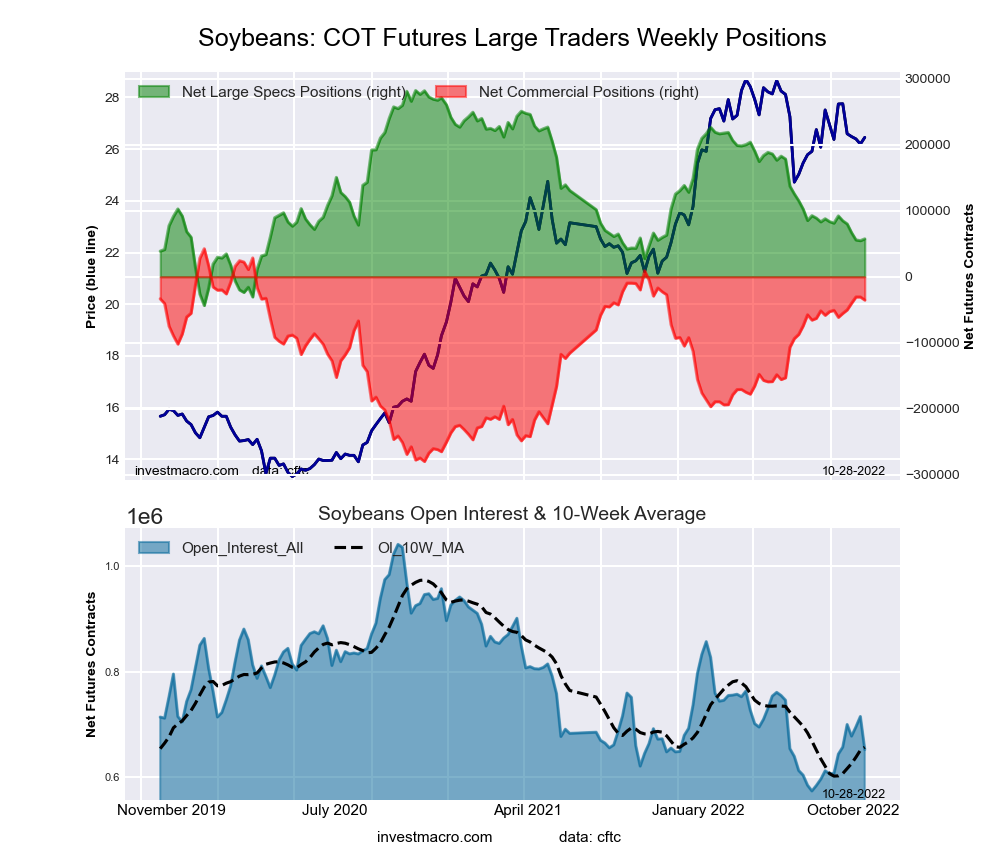 The SOYBEANS large speculator standing this week was a net position of 57,385 contracts in the data reported through Tuesday. This was a weekly rise of 2,702 contracts from the previous week which had a total of 54,683 net contracts.
This week’s current strength score (the trader positioning range over the past three years, measured from 0 to 100) shows the speculators are currently Bearish with a score of 31.0 percent. The commercials are Bullish with a score of 75.9 percent and the small traders (not shown in chart) are Bearish with a score of 33.8 percent.
| SOYBEANS Futures Statistics | SPECULATORS | COMMERCIALS | SMALL TRADERS |
| – Percent of Open Interest Longs: | 19.4 | 54.4 | 7.9 |
| – Percent of Open Interest Shorts: | 10.6 | 59.8 | 11.3 |
| – Net Position: | 57,385 | -35,301 | -22,084 |
| – Gross Longs: | 126,693 | 354,542 | 51,670 |
| – Gross Shorts: | 69,308 | 389,843 | 73,754 |
| – Long to Short Ratio: | 1.8 to 1 | 0.9 to 1 | 0.7 to 1 |
| NET POSITION TREND: | |||
| – Strength Index Score (3 Year Range Pct): | 31.0 | 75.9 | 33.8 |
| – Strength Index Reading (3 Year Range): | Bearish | Bullish | Bearish |
| NET POSITION MOVEMENT INDEX: | |||
| – 6-Week Change in Strength Index: | -10.7 | 8.1 | 14.6 |
SOYBEAN OIL Futures:
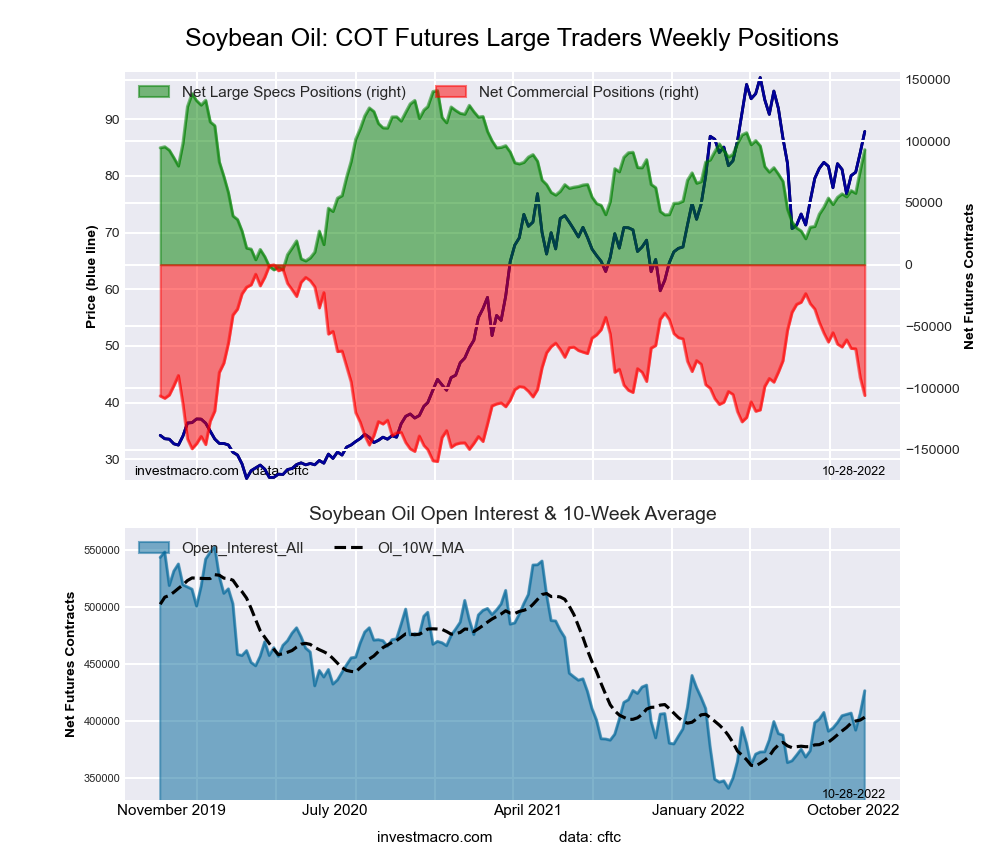 The SOYBEAN OIL large speculator standing this week was a net position of 93,241 contracts in the data reported through Tuesday. This was a weekly increase of 16,918 contracts from the previous week which had a total of 76,323 net contracts.
This week’s current strength score (the trader positioning range over the past three years, measured from 0 to 100) shows the speculators are currently Bullish with a score of 67.0 percent. The commercials are Bearish with a score of 33.6 percent and the small traders (not shown in chart) are Bullish with a score of 61.2 percent.
| SOYBEAN OIL Futures Statistics | SPECULATORS | COMMERCIALS | SMALL TRADERS |
| – Percent of Open Interest Longs: | 29.0 | 43.0 | 8.7 |
| – Percent of Open Interest Shorts: | 7.1 | 67.9 | 5.7 |
| – Net Position: | 93,241 | -106,036 | 12,795 |
| – Gross Longs: | 123,538 | 183,248 | 37,167 |
| – Gross Shorts: | 30,297 | 289,284 | 24,372 |
| – Long to Short Ratio: | 4.1 to 1 | 0.6 to 1 | 1.5 to 1 |
| NET POSITION TREND: | |||
| – Strength Index Score (3 Year Range Pct): | 67.0 | 33.6 | 61.2 |
| – Strength Index Reading (3 Year Range): | Bullish | Bearish | Bullish |
| NET POSITION MOVEMENT INDEX: | |||
| – 6-Week Change in Strength Index: | 26.6 | -26.1 | 11.0 |
SOYBEAN MEAL Futures:
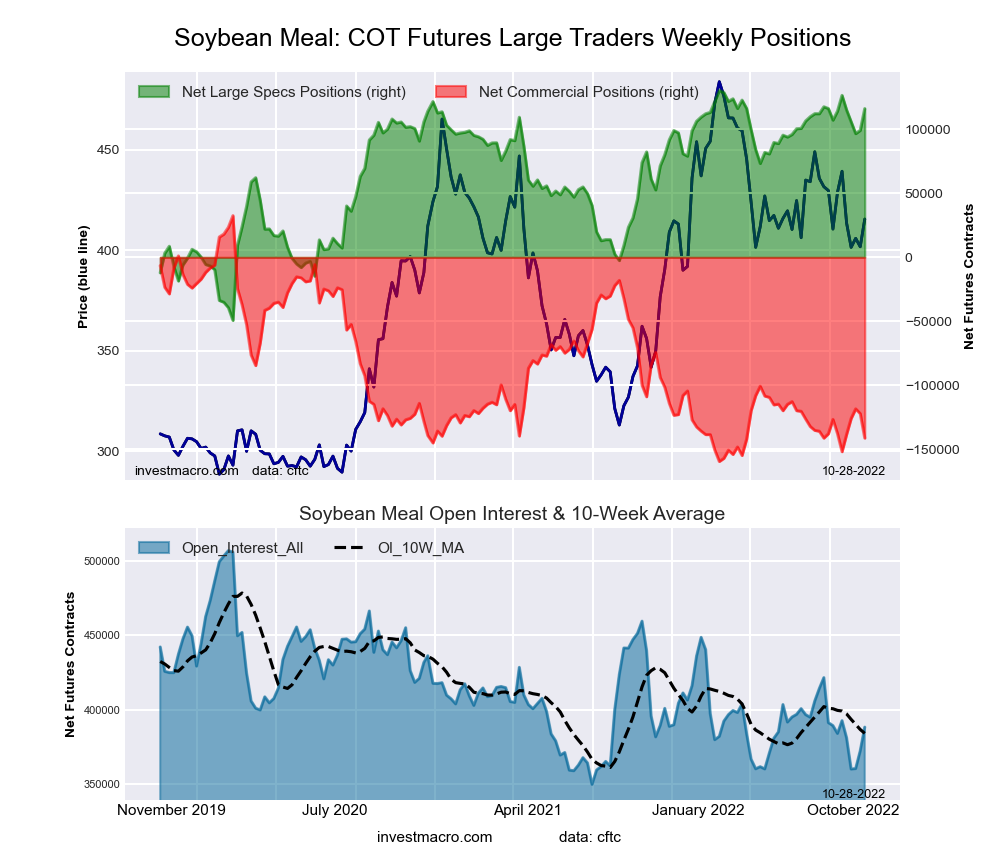 The SOYBEAN MEAL large speculator standing this week was a net position of 116,146 contracts in the data reported through Tuesday. This was a weekly gain of 17,014 contracts from the previous week which had a total of 99,132 net contracts.
This week’s current strength score (the trader positioning range over the past three years, measured from 0 to 100) shows the speculators are currently Bullish-Extreme with a score of 92.1 percent. The commercials are Bearish-Extreme with a score of 9.5 percent and the small traders (not shown in chart) are Bullish with a score of 62.9 percent.
| SOYBEAN MEAL Futures Statistics | SPECULATORS | COMMERCIALS | SMALL TRADERS |
| – Percent of Open Interest Longs: | 33.6 | 39.7 | 12.6 |
| – Percent of Open Interest Shorts: | 3.7 | 76.0 | 6.1 |
| – Net Position: | 116,146 | -141,232 | 25,086 |
| – Gross Longs: | 130,508 | 153,931 | 48,845 |
| – Gross Shorts: | 14,362 | 295,163 | 23,759 |
| – Long to Short Ratio: | 9.1 to 1 | 0.5 to 1 | 2.1 to 1 |
| NET POSITION TREND: | |||
| – Strength Index Score (3 Year Range Pct): | 92.1 | 9.5 | 62.9 |
| – Strength Index Reading (3 Year Range): | Bullish-Extreme | Bearish-Extreme | Bullish |
| NET POSITION MOVEMENT INDEX: | |||
| – 6-Week Change in Strength Index: | 1.1 | -1.8 | 7.7 |
LIVE CATTLE Futures:
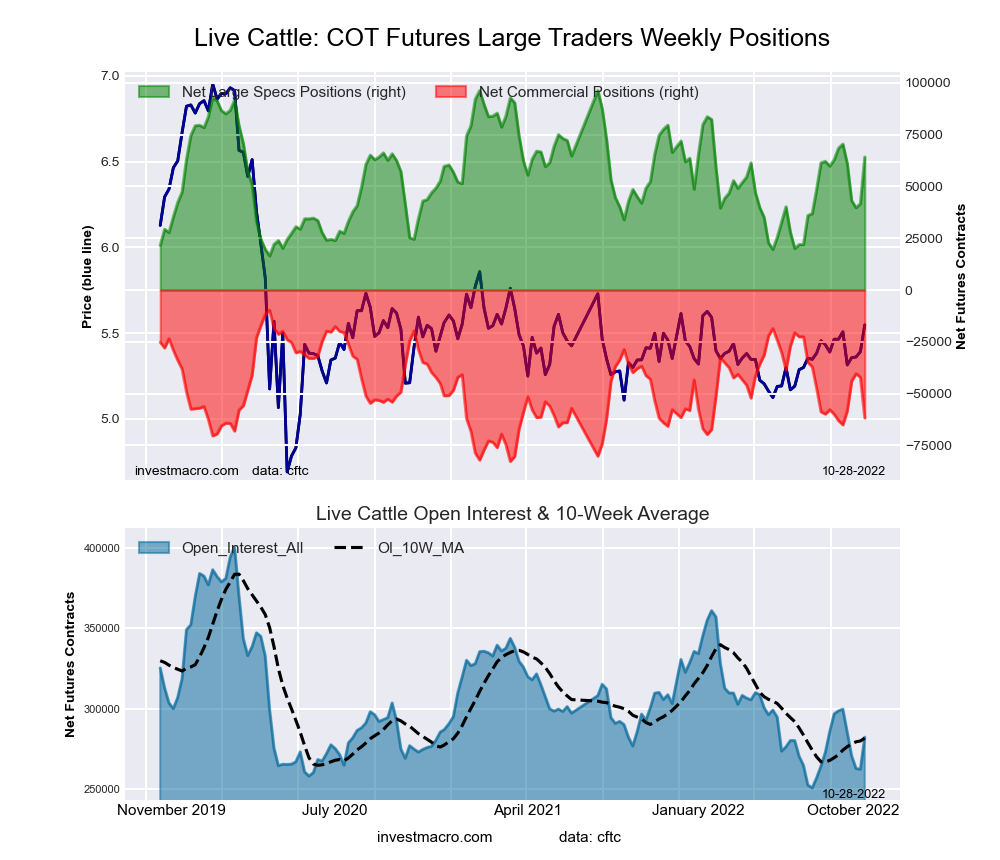 The LIVE CATTLE large speculator standing this week was a net position of 64,126 contracts in the data reported through Tuesday. This was a weekly lift of 22,470 contracts from the previous week which had a total of 41,656 net contracts.
This week’s current strength score (the trader positioning range over the past three years, measured from 0 to 100) shows the speculators are currently Bullish with a score of 59.8 percent. The commercials are Bearish with a score of 28.8 percent and the small traders (not shown in chart) are Bullish-Extreme with a score of 86.7 percent.
| LIVE CATTLE Futures Statistics | SPECULATORS | COMMERCIALS | SMALL TRADERS |
| – Percent of Open Interest Longs: | 37.5 | 32.1 | 10.8 |
| – Percent of Open Interest Shorts: | 14.7 | 53.9 | 11.7 |
| – Net Position: | 64,126 | -61,708 | -2,418 |
| – Gross Longs: | 105,722 | 90,481 | 30,509 |
| – Gross Shorts: | 41,596 | 152,189 | 32,927 |
| – Long to Short Ratio: | 2.5 to 1 | 0.6 to 1 | 0.9 to 1 |
| NET POSITION TREND: | |||
| – Strength Index Score (3 Year Range Pct): | 59.8 | 28.8 | 86.7 |
| – Strength Index Reading (3 Year Range): | Bullish | Bearish | Bullish-Extreme |
| NET POSITION MOVEMENT INDEX: | |||
| – 6-Week Change in Strength Index: | -5.4 | 1.8 | 12.3 |
LEAN HOGS Futures:
 The LEAN HOGS large speculator standing this week was a net position of 40,379 contracts in the data reported through Tuesday. This was a weekly advance of 13,290 contracts from the previous week which had a total of 27,089 net contracts.
This week’s current strength score (the trader positioning range over the past three years, measured from 0 to 100) shows the speculators are currently Bullish with a score of 50.7 percent. The commercials are Bullish with a score of 57.6 percent and the small traders (not shown in chart) are Bearish with a score of 44.4 percent.
| LEAN HOGS Futures Statistics | SPECULATORS | COMMERCIALS | SMALL TRADERS |
| – Percent of Open Interest Longs: | 40.1 | 33.2 | 9.2 |
| – Percent of Open Interest Shorts: | 19.7 | 48.6 | 14.3 |
| – Net Position: | 40,379 | -30,337 | -10,042 |
| – Gross Longs: | 79,180 | 65,528 | 18,149 |
| – Gross Shorts: | 38,801 | 95,865 | 28,191 |
| – Long to Short Ratio: | 2.0 to 1 | 0.7 to 1 | 0.6 to 1 |
| NET POSITION TREND: | |||
| – Strength Index Score (3 Year Range Pct): | 50.7 | 57.6 | 44.4 |
| – Strength Index Reading (3 Year Range): | Bullish | Bullish | Bearish |
| NET POSITION MOVEMENT INDEX: | |||
| – 6-Week Change in Strength Index: | 1.3 | -0.1 | -5.9 |
COTTON Futures:
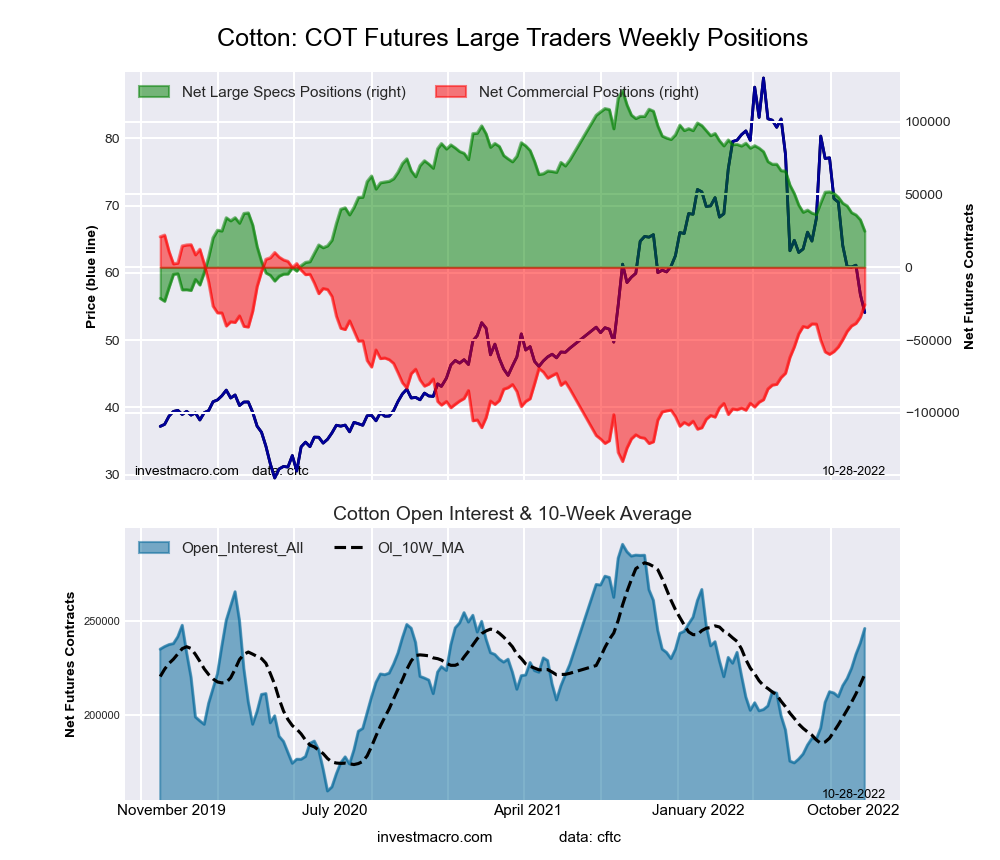 The COTTON large speculator standing this week was a net position of 24,776 contracts in the data reported through Tuesday. This was a weekly decline of -7,787 contracts from the previous week which had a total of 32,563 net contracts.
This week’s current strength score (the trader positioning range over the past three years, measured from 0 to 100) shows the speculators are currently Bearish with a score of 29.6 percent. The commercials are Bullish with a score of 72.3 percent and the small traders (not shown in chart) are Bearish-Extreme with a score of 16.2 percent.
| COTTON Futures Statistics | SPECULATORS | COMMERCIALS | SMALL TRADERS |
| – Percent of Open Interest Longs: | 29.0 | 49.3 | 5.3 |
| – Percent of Open Interest Shorts: | 18.9 | 59.7 | 4.9 |
| – Net Position: | 24,776 | -25,690 | 914 |
| – Gross Longs: | 71,296 | 121,240 | 13,075 |
| – Gross Shorts: | 46,520 | 146,930 | 12,161 |
| – Long to Short Ratio: | 1.5 to 1 | 0.8 to 1 | 1.1 to 1 |
| NET POSITION TREND: | |||
| – Strength Index Score (3 Year Range Pct): | 29.6 | 72.3 | 16.2 |
| – Strength Index Reading (3 Year Range): | Bearish | Bullish | Bearish-Extreme |
| NET POSITION MOVEMENT INDEX: | |||
| – 6-Week Change in Strength Index: | -17.0 | 19.5 | -37.1 |
COCOA Futures:
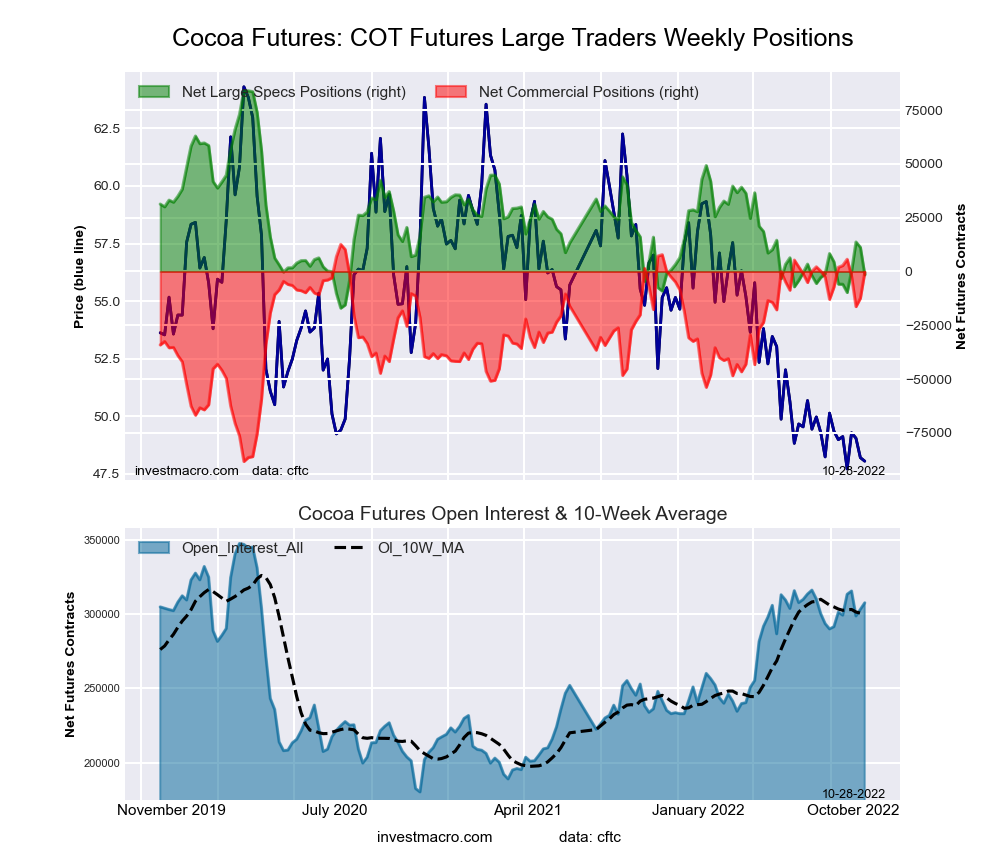 The COCOA large speculator standing this week was a net position of -1,545 contracts in the data reported through Tuesday. This was a weekly fall of -12,763 contracts from the previous week which had a total of 11,218 net contracts.
This week’s current strength score (the trader positioning range over the past three years, measured from 0 to 100) shows the speculators are currently Bearish-Extreme with a score of 15.3 percent. The commercials are Bullish-Extreme with a score of 87.1 percent and the small traders (not shown in chart) are Bearish-Extreme with a score of 16.5 percent.
| COCOA Futures Statistics | SPECULATORS | COMMERCIALS | SMALL TRADERS |
| – Percent of Open Interest Longs: | 31.3 | 46.1 | 4.2 |
| – Percent of Open Interest Shorts: | 31.8 | 46.2 | 3.5 |
| – Net Position: | -1,545 | -456 | 2,001 |
| – Gross Longs: | 96,233 | 141,758 | 12,844 |
| – Gross Shorts: | 97,778 | 142,214 | 10,843 |
| – Long to Short Ratio: | 1.0 to 1 | 1.0 to 1 | 1.2 to 1 |
| NET POSITION TREND: | |||
| – Strength Index Score (3 Year Range Pct): | 15.3 | 87.1 | 16.5 |
| – Strength Index Reading (3 Year Range): | Bearish-Extreme | Bullish-Extreme | Bearish-Extreme |
| NET POSITION MOVEMENT INDEX: | |||
| – 6-Week Change in Strength Index: | 4.3 | -2.4 | -19.6 |
WHEAT Futures:
 The WHEAT large speculator standing this week was a net position of -12,913 contracts in the data reported through Tuesday. This was a weekly decrease of -9,372 contracts from the previous week which had a total of -3,541 net contracts.
This week’s current strength score (the trader positioning range over the past three years, measured from 0 to 100) shows the speculators are currently Bearish-Extreme with a score of 2.3 percent. The commercials are Bullish-Extreme with a score of 88.0 percent and the small traders (not shown in chart) are Bullish with a score of 74.2 percent.
| WHEAT Futures Statistics | SPECULATORS | COMMERCIALS | SMALL TRADERS |
| – Percent of Open Interest Longs: | 26.6 | 41.6 | 9.0 |
| – Percent of Open Interest Shorts: | 30.6 | 35.5 | 11.1 |
| – Net Position: | -12,913 | 19,896 | -6,983 |
| – Gross Longs: | 86,299 | 134,862 | 29,102 |
| – Gross Shorts: | 99,212 | 114,966 | 36,085 |
| – Long to Short Ratio: | 0.9 to 1 | 1.2 to 1 | 0.8 to 1 |
| NET POSITION TREND: | |||
| – Strength Index Score (3 Year Range Pct): | 2.3 | 88.0 | 74.2 |
| – Strength Index Reading (3 Year Range): | Bearish-Extreme | Bullish-Extreme | Bullish |
| NET POSITION MOVEMENT INDEX: | |||
| – 6-Week Change in Strength Index: | -6.2 | 9.8 | -11.1 |
Article By InvestMacro – Receive our weekly COT Newsletter
*COT Report: The COT data, released weekly to the public each Friday, is updated through the most recent Tuesday (data is 3 days old) and shows a quick view of how large speculators or non-commercials (for-profit traders) were positioned in the futures markets.
The CFTC categorizes trader positions according to commercial hedgers (traders who use futures contracts for hedging as part of the business), non-commercials (large traders who speculate to realize trading profits) and nonreportable traders (usually small traders/speculators) as well as their open interest (contracts open in the market at time of reporting). See CFTC criteria here.

- COT Metals Charts: Weekly Speculator Bets see small gains for Silver & Gold Jul 12, 2026
- COT Bonds Charts: Speculator Bets led by SOFR 3-Months & 2-Year Bonds Jul 12, 2026
- COT Energy Charts: Weekly Speculator Changes led by Brent Oil Jul 12, 2026
- COT Soft Commodities Charts: Weekly Speculator Changes led by Sugar, Corn & Soybeans Jul 12, 2026
- The US and European stock indices are rising again amid renewed investor interest in the AI industry. Jul 10, 2026
- USD/JPY Falls as Yen Recovers Weekly Losses Jul 10, 2026
- Crude oil prices surged sharply by 7% in reaction to the rapid escalation of the conflict in the Middle East Jul 9, 2026
- Middle East Tensions Weigh on Gold Jul 9, 2026
- Pound Awaits Tighter Policy from Bank of England Jul 8, 2026
- The United States carried out airstrikes on Iran after Iran’s attacked tankers in the Strait of Hormuz. The RBNZ raised the interest rate to 2.5% Jul 8, 2026