
Technical analysis is a method of evaluating securities by analyzing the statistical trends generated by market activity, such as past prices and volume. Technical analysts attempt to identify patterns in the price data that will help signal future market direction. Some traders will use the price itself as their main focus of analysis while others will focus on qualitative factors, such as sentiment or news events. Many traders add technical analysis indicators into their trading mix to help them understand what prices are doing at any given time. Some of these indicators include measurements for when prices have gone to extreme lengths. These are generally called overbought and oversold technical trading indicators and are some of my favorite tools to use when analyzing the markets.
While technical analysis and indicators can be an integral part of a trader’s success, I firmly believe that to have a well-rounded view of the market and to give yourself the best chance for success, a trader’s toolkit should include other forms of analysis including fundamental analysis, statistical analysis or sentiment analysis.
Jump To Section:
Technical Analysis and Technical Indicators:
There are a number of reasons why traders might use technical analysis or employ the use of technical analysis indicators. First, technical analysis can help traders identify market trends. This can be useful in making decisions about when to buy or sell a security. Second, technical analysis can be used to identify extreme or outlier price conditions in the market. This can be helpful to alert you to unusual circumstances currently in the market and potentially help you in making decisions about when to enter or exit a trade. Finally, technical analysis can be used to identify potential support and resistance levels in the market. This can be useful in making decisions about where to think about entering buy and sell orders or logical places to set stop-loss and take-profit orders.
There are many different types of technical indicators, each with its own specific purpose. A few of the most popular include moving averages, support and resistance levels, Fibonacci Retracements, the MACD, Japanese candlestick patterns, the Stochastic Oscillator, Pivot Points and Bollinger Bands. Most indicators are usually based off of past and present prices and aim to signify certain characteristics of the current market conditions.
Free Reports:
 Get our Weekly Commitment of Traders Reports - See where the biggest traders (Hedge Funds and Commercial Hedgers) are positioned in the futures markets on a weekly basis.
 Sign Up for Our Stock Market Newsletter – Get updated on News, Charts & Rankings of Public Companies when you join our Stocks Newsletter
Some indicators are used to identify trend changes, while others are used to identify overbought or oversold conditions. These indicators work by measuring different aspects of the market, such as price, volume, or momentum. When they reach extreme levels, it can be a sign that the market is due for a reversal.
One of the benefits of using technical indicators is that they can help you stay ahead of the market. By identifying potential reversals before they happen, you can position yourself to take advantage of them.
Of course, no indicator is perfect. They can sometimes give false signals, or fail to predict reversals. This is why it’s important to use them as part of a broader trading strategy, and to never rely on them exclusively. Also, experience using certain techniques can teach you what works when and what does not work at other times.
What are Overbought and Oversold Indicators?
Some of my favorite indicators are in the overbought and oversold variety. These technical indicators are important to traders because they can help identify when prices have moved too far in one direction.
An overbought market is one where prices have risen too far and too fast, and is now considered to be overextended. This can be caused by a number of factors, including investor euphoria, excessive buying by institutions or a lack of available sellers. When the market becomes overbought, it can be ripe for a correction.
An oversold market is just the opposite. Prices have fallen too far and too fast, and are now considered to be undervalued. This can be caused by a number of factors, including investor fear, excessive selling by institutions, a lack of available buyers or a general dismal outlook for the market. When the market becomes oversold, it can be ripe for a rebound.
Traders often use technical indicators to help identify overbought and oversold conditions. Extreme data points, or outliers, can be especially important in this regard.
Outliers, or extreme data points, can sometimes be predictive of future market movements. For example, if a stock price suddenly spikes up, it could be a sign that something is about to happen that will drive the price even higher. Of course, outliers can also be false signals. It’s important to carefully analyze them to determine if they’re truly predictive, or if they’re just noise. Trading outliers can be a profitable strategy, but it’s important to use caution and to have a well-defined plan.
Overall, overbought and oversold technical indicators, extreme data points, and outliers can all be important tools for traders. By understanding how to use them, you can give yourself an edge in the market.
The Relative Strength Index (RSI)
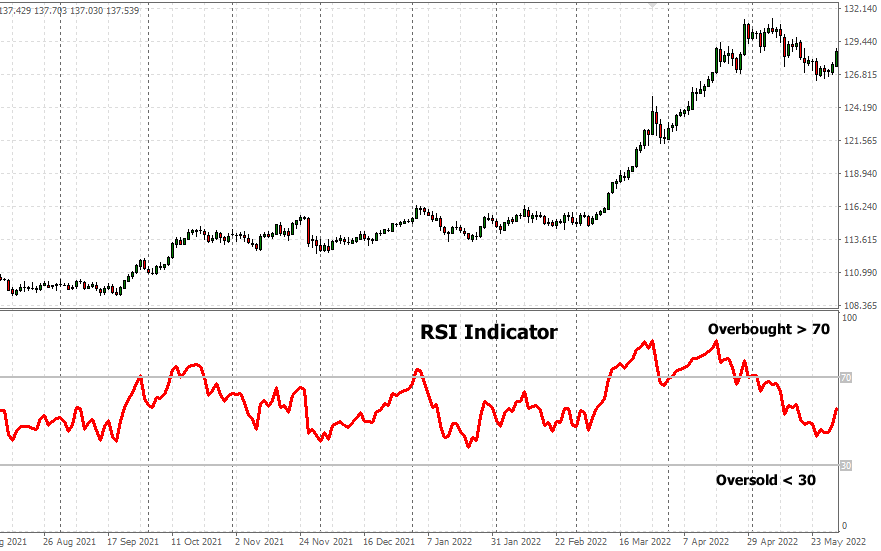
The first indicator I want to highlight today is so well known it is almost a default indicator on most charting packages. The Relative Strength Index, or simply RSI, is possibly the most popular indicator when measuring overbought and oversold levels. J. Welles Wilder was the developer of the RSI and wrote a chapter about it in his book, “New Concepts in Technical Trading Systems”, published in 1978. Wilder recommended using a 14-day RSI which is still used widely and usually the default setting.
The RSI calculation, in simple terms, essentially compares the chosen period’s average bullish days against it’s average bearish days and displays them on a scale of 0 – 100. The RSI is traditionally used as an overbought indicator when the reading is above 70 and oversold when it is below 30. These levels can be adjusted to fit the security being analyzed or to fit a trader’s preference. There are many traders that use above 80 as overbought and below 20 as oversold (as well as 75 and 25).
The RSI can be used to identify trend exhaustion. When the RSI is overbought for a longer than normal length, it indicates that the trend may have lost steam and prices could soon reverse. When the RSI is oversold, it indicates that the prices may have been overextended to the downside and could start to move back up. Do not just accept that a quick price jump into an overbought or oversold level is a valid signal. Use confirming signals to help you and learn from your experience using the indicator, especially in different situations.
Bonus: RSI Divergences
Another great way to use the RSI is to look for divergences between the RSI and prices. I feel RSI divergences are possibly an overlooked way to use the indicator but can have a great benefit on the rare occasions when they show up.
Wilder wrote in his book that, “Although divergence does not occur at every turning point, it does occur at most significant turning points. When divergence begins to show up after a good directional move, this is a very strong indication that a turning point is near. Divergence is the single most indicative characteristic of the Relative Strength Index.”
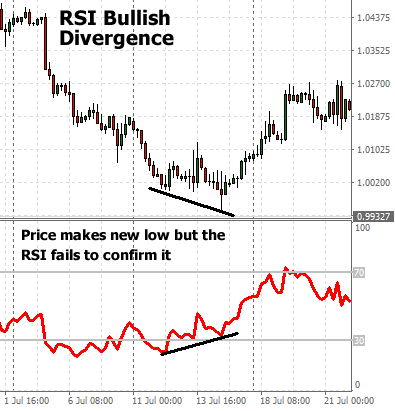
A bullish divergence occurs when prices of the market form lower lows while the RSI indicator forms fails to follow and make lower lows as well. The RSI makes higher lows instead. This is an indication that prices could start to move higher.
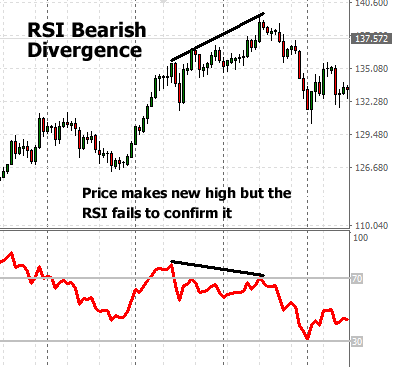
A bearish divergence occurs when prices rise to higher highs while the RSI fails to confirm the higher highs and instead forms lower highs. This can be an indication that prices could start to move lower.
Combining the RSI overbought and oversold levels with the rare RSI divergence can be a powerful trading setup. Use it wisely and look for other confirming signals from fundamental analysis or sentiment analysis to help build your confidence in the possible market turning point.
The Z-Score Statistical Indicator
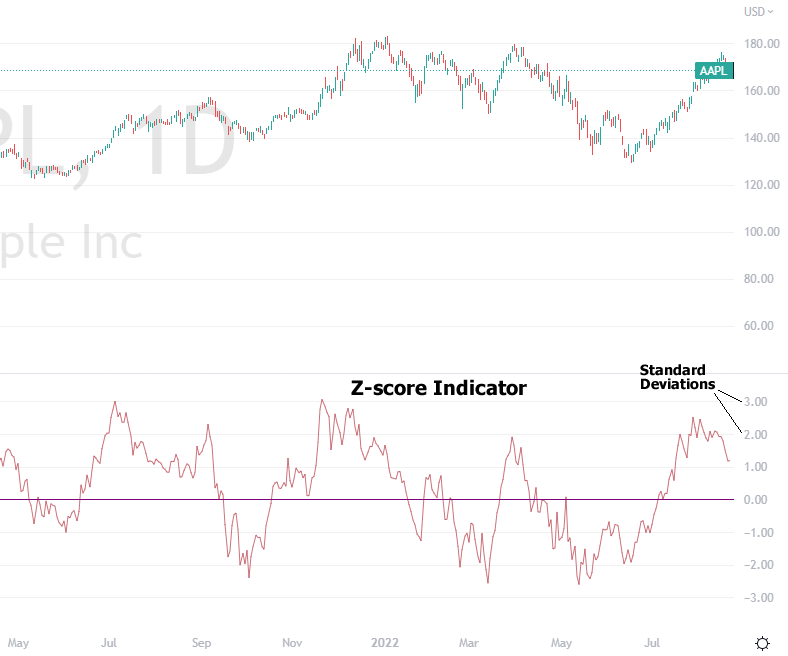
Apple Stock Overbought Oversold Z-score Indicator using a 50-period Mean
The Z-score indicator is the next technical indicator on my list of favorite overbought and oversold indicators. The Z-score is a statistical indicator that measures how many standard deviations a given data point is from the mean. In other words, it tells you how far away a specific data point is from the average.
The Z-score is a valuable tool for analysts because it is helpful to compare data points that are at extreme levels or that are outliers in the data. It is used not only in market trading and analysis but also is used in many aspects of statistics and data science. It is sometimes referred to as the standard score as it is used to standardize or normalize data.
For example, if one data point is two standard deviations above the mean and another data point is two standard deviations below the mean, the Z-score can be used to quickly and easily compare the two. These two data points would be very far apart from each other!
The number of standard deviations that price is from the mean can help us categorize current conditions. This is based on the assumption that prices are normally distributed in a bell curve shape and follow the Empirical Rule.
The Empirical Rule or the 68 – 95 – 99.7 Rule
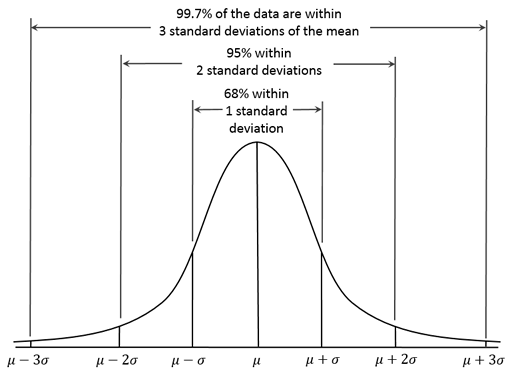
Dan Kernler, CC BY-SA 4.0, via Wikimedia Commons
The Empirical Rule says that 68% of all data points will fall within one standard deviation of the mean (between -1.0 standard deviations below the mean and +1.0 standard deviations above the mean). Then it states that 95% of all data points will fall within two standard deviations of the mean (between -2.0 standard deviations below the mean and +2.0 standard deviations above the mean). And finally, 99.7% of all data points will fall within three standard deviations of the mean (between -3.0 standard deviations below the mean and +3.0 standard deviations above the mean).
A data point that is more than three standard deviations away from the mean is typically considered an outlier. Take note that each market does have different characteristics and will also likely differ in their relationships to the Z-score indicator. For example, in forex trading, I have found that Japanese yen currency pairs can sometimes breach 4.0 standard deviations while other currency pairs are much more muted.
Overall, the Z-score can be a helpful indicator because it provides a quick and easy way to compare a data point to its mean but should also always be used in conjunction with other types of analysis and signals.
Linear Regression Indicator with Channels
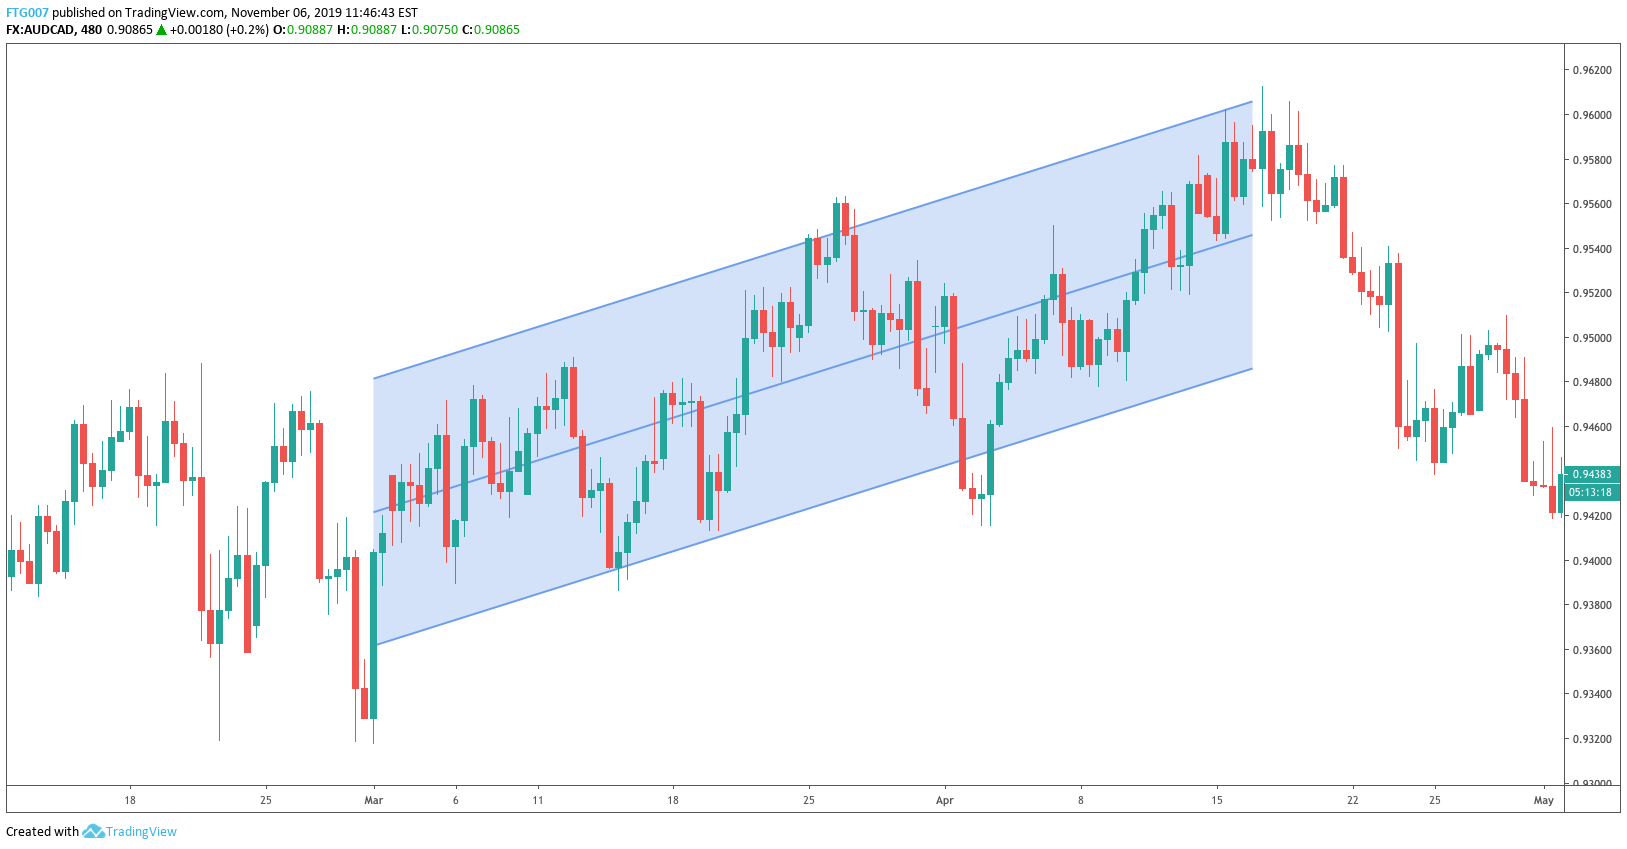
The next indicator for overbought and oversold levels I like to use is the Linear Regression Channels Indicator. Linear regression is considered a supervised machine learning algorithm and used to predict a target value based on independent variables. Or more simply, linear regression is a statistical technique that is used to find the best fit line for a given set of data like price movements. This line represents the trend of the data and if extended into the future, can be used to predict future values along that line.
There are many different ways to calculate the best fit line, but the most common method is to use the least squares method. This method finds the line that minimizes the sum of the squares of the differences between the actual data points and the points on the line. Once the best fit line is found, the slope of the line can be used to determine the trending direction of the data. If the slope is positive, the data is trending upwards. If the slope is negative, the data is trending downwards.
The linear regression indicator can be used to tell how far the current price is away from the best fit trendline. Similarly to the Z-score indicator, the linear regression measures this distance using the standard deviations of the data. The higher the standard deviation, the higher above trend it is. When it is in an uptrend and rising to near or above the 3 standard deviations level, it can be considered in an overbought level. Price dropping in a downtrend to near or below the -3 standard deviations level can be considered in an oversold level. These levels can be different for each market or determined by a trader’s preference.
Also, like the Z-score indicator, the Empirical Rule is used as a guide and it is assumed that the data is distributed in a bell curve. This assumption is not always true and in some cases, data may be distributed in a different way.
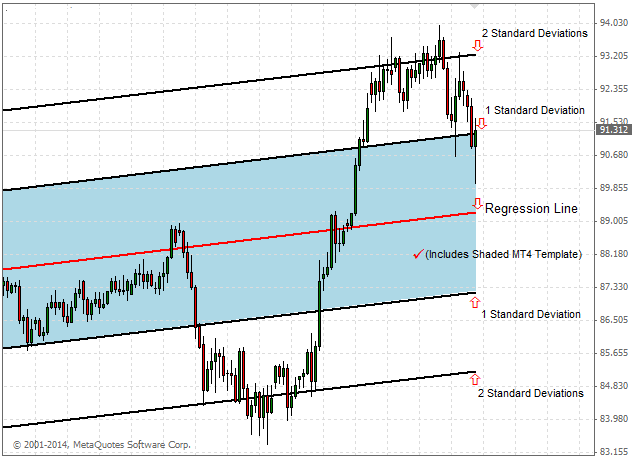
The Linear Regression Indicator with channels clearly displays the standard deviation levels to show how far the current data is compared to the trendline. It will also help to visually display the trend direction of the market. The linear regression with channels can be a very versatile tool that traders can use for pullback trading as well as a momentum indicator and not just for overbought/oversold ideas.
The linear regression indicator is a powerful tool that can be used to identify trends, identify overbought and oversold signals as well as predict future values. However, once again, it is important to remember that it is only a tool and should not be used as the sole basis for decision making or to buy and sell.
Related: See our Automatic updating Linear Regression Channels Indicator for MetaTrader4
Overbought and Oversold Levels Indicators Conclusion
I hope this list of my favorite overbought and oversold tools gives you some ideas for your own trading and analysis. There are many different overbought and oversold indicators available, so it’s important to choose one (or a few) that fit your trading style.
When it comes to trading, there is no one-size-fits-all approach that will guarantee success. However, using overbought and oversold indicators can be helpful in identifying potential trading opportunities.
If you are new to trading, then I would recommend starting with a basic approach. Once you have a better understanding of how the markets work and gain some experience, you can start to experiment with different indicators and techniques. Remember to use a trading journal and write down your reasons and ideas for your actions.
No matter what approach you take to trading, always remember to do your own research and never risk more than you can afford to lose.
About the Author:
Taylor Wilman is an experienced financial trader and stock market investor that likes to combine fundamental, technical and sentiment analysis for better decision making. Taylor loves to write about the markets, to help educate others and to share his experiences.