
By InvestMacro
Here are the latest charts and statistics for the Commitment of Traders (COT) data published by the Commodities Futures Trading Commission (CFTC).
The latest COT data is updated through Tuesday May 9th and shows a quick view of how large traders (for-profit speculators and commercial entities) were positioned in the futures markets.
Weekly Speculator Changes led by Platinum & Palladium
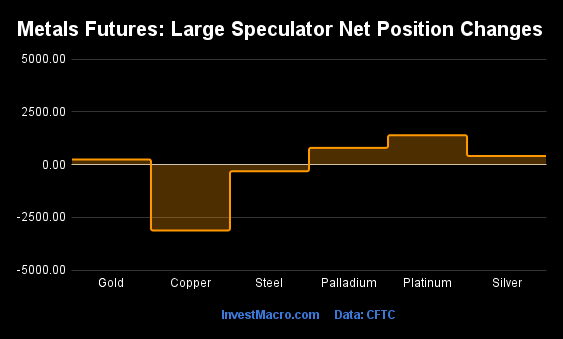
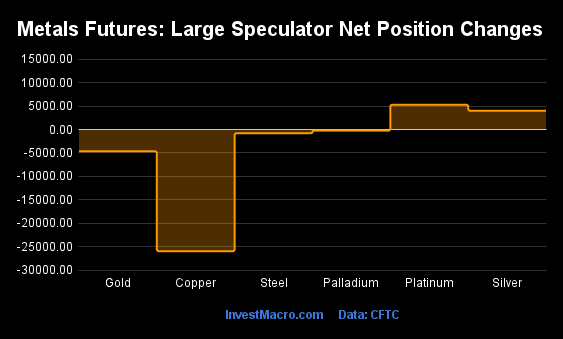
The COT metals markets speculator bets were higher this week as four out of the six metals markets we cover had higher positioning while the other two markets had lower speculator contracts.
Leading the gains for the metals was Platinum (1,397 contracts) with Palladium (797 contracts), Silver (408 contracts) and Gold (247 contracts) also recording positive weeks.
The markets with declines in speculator bets for the week were Copper (-3,123 contracts) and Steel (-314 contracts).
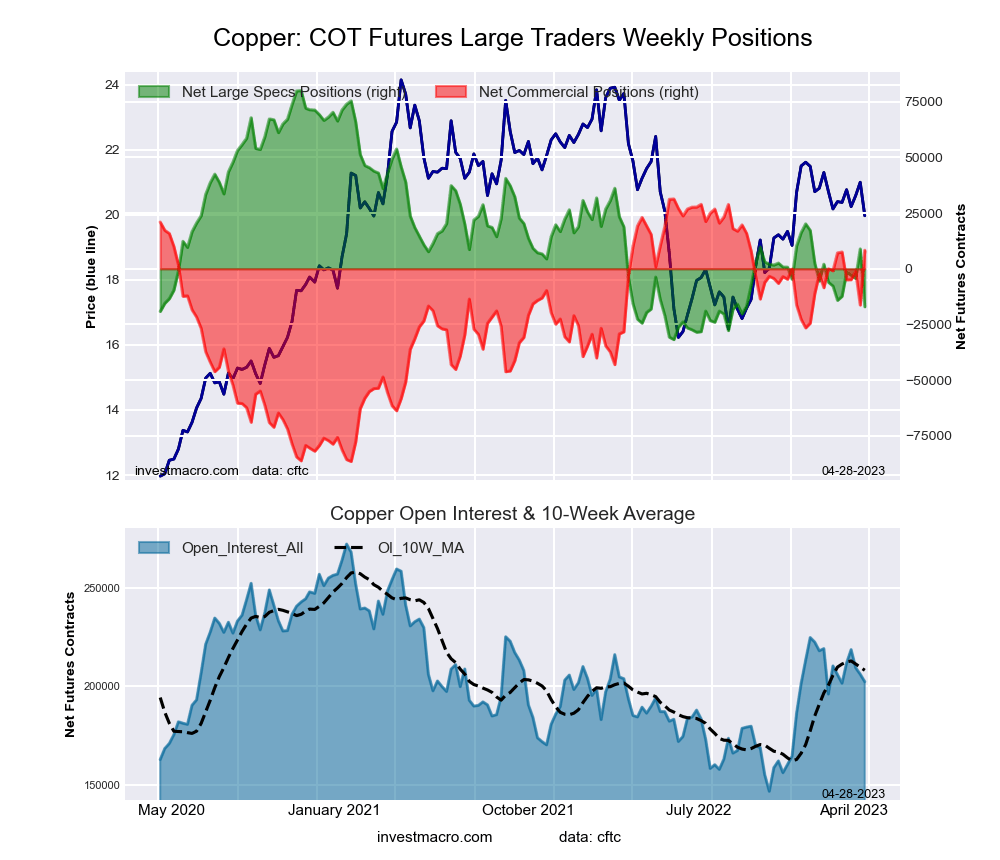
Copper bets slide to 32-week low as prices touch lowest since November
Highlighting the COT metals data this week is the recent bearishness for the Copper speculative positions. The large speculator position in Copper futures decreased for the third straight week this week and has now dropped in five out of the past six weeks. The slide in Copper bets has taken the current net contracts standing down to a total of -24,865 contracts. This marks the most bearish level for speculators in the past 32-weeks, dating back to last September 27th.
Overall, the Copper speculator position has now been in a bearish level for eleven out of the past thirteen weeks.
Denting the sentiment for the red metal has been the weaker than expected data out of China (including imports & inflation), which is the largest importer of Copper in the world.
The Copper front-month futures price (US Comex futures) has been on downtrend since hitting a most recent high of $4.25 per pound in January. This week saw the price fall for a fourth straight week and close at approximately 3.73 per pound while also touching the lowest price since November. Overall, the Copper price is down about 25 percent from the post-2020 high of $4.6255 per pound that was reached in March of 2022.
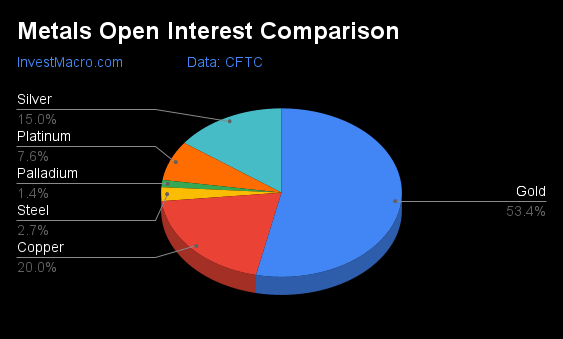
| May-09-2023 | OI | OI-Index | Spec-Net | Spec-Index | Com-Net | COM-Index | Smalls-Net | Smalls-Index |
|---|---|---|---|---|---|---|---|---|
| Gold | 518,951 | 45 | 195,814 | 63 | -222,515 | 38 | 26,701 | 47 |
| Silver | 145,445 | 32 | 32,360 | 64 | -46,190 | 38 | 13,830 | 43 |
| Copper | 194,243 | 38 | -24,865 | 6 | 19,732 | 90 | 5,133 | 51 |
| Palladium | 13,295 | 100 | -5,647 | 13 | 5,965 | 87 | -318 | 23 |
| Platinum | 74,125 | 86 | 28,084 | 80 | -32,484 | 26 | 4,400 | 27 |
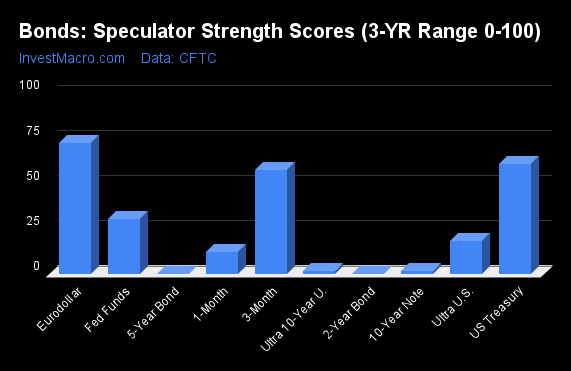
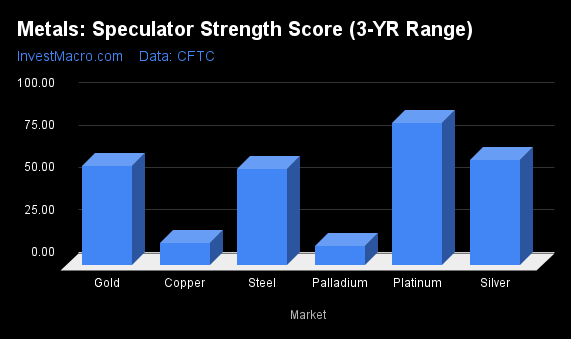
Strength Scores led by Platinum & Silver
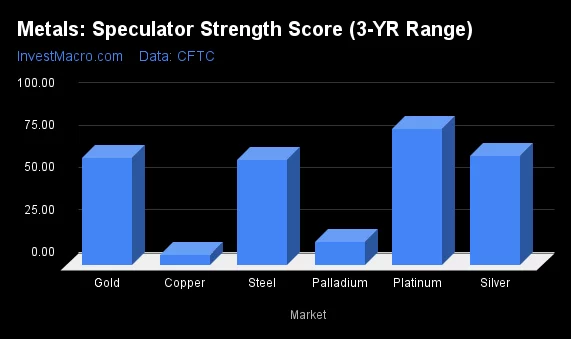
COT Strength Scores (a normalized measure of Speculator positions over a 3-Year range, from 0 to 100 where above 80 is Extreme-Bullish and below 20 is Extreme-Bearish) showed that Platinum (80 percent) and Silver (64 percent) lead the metals markets this week. Steel (62 percent) comes in as the next highest in the weekly strength scores.
On the downside, Palladium (13 percent) comes in at the lowest strength level currently and is in Extreme-Bearish territory (below 20 percent).
Strength Statistics:
Gold (63.3 percent) vs Gold previous week (63.1 percent)
Silver (64.4 percent) vs Silver previous week (63.8 percent)
Copper (6.2 percent) vs Copper previous week (9.0 percent)
Platinum (80.4 percent) vs Platinum previous week (77.2 percent)
Palladium (13.4 percent) vs Palladium previous week (6.0 percent)
Steel (61.9 percent) vs Palladium previous week (62.8 percent)
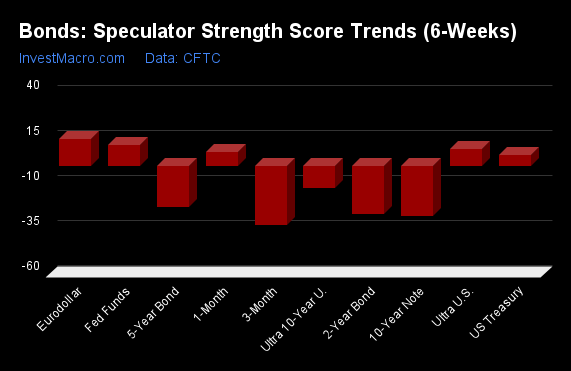
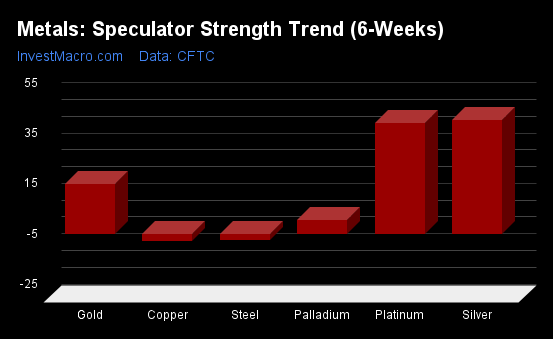
Platinum & Silver top the 6-Week Strength Trends
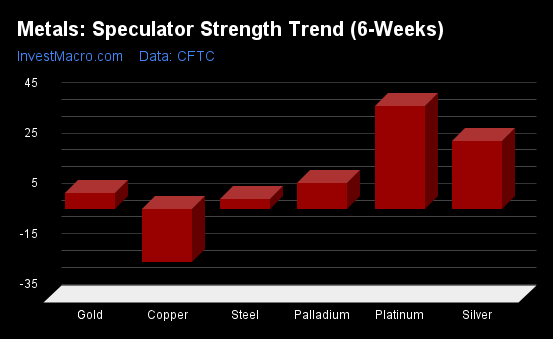
COT Strength Score Trends (or move index, calculates the 6-week changes in strength scores) showed that Platinum (41 percent) and Silver (27 percent) lead the past six weeks trends for metals.
Copper (-21 percent) leads the downside trend scores currently.
Move Statistics:
Gold (6.2 percent) vs Gold previous week (16.3 percent)
Silver (27.1 percent) vs Silver previous week (40.7 percent)
Copper (-20.9 percent) vs Copper previous week (-8.4 percent)
Platinum (40.9 percent) vs Platinum previous week (39.6 percent)
Palladium (10.3 percent) vs Palladium previous week (5.3 percent)
Steel (3.9 percent) vs Steel previous week (3.4 percent)
Individual Markets:
Gold Comex Futures:
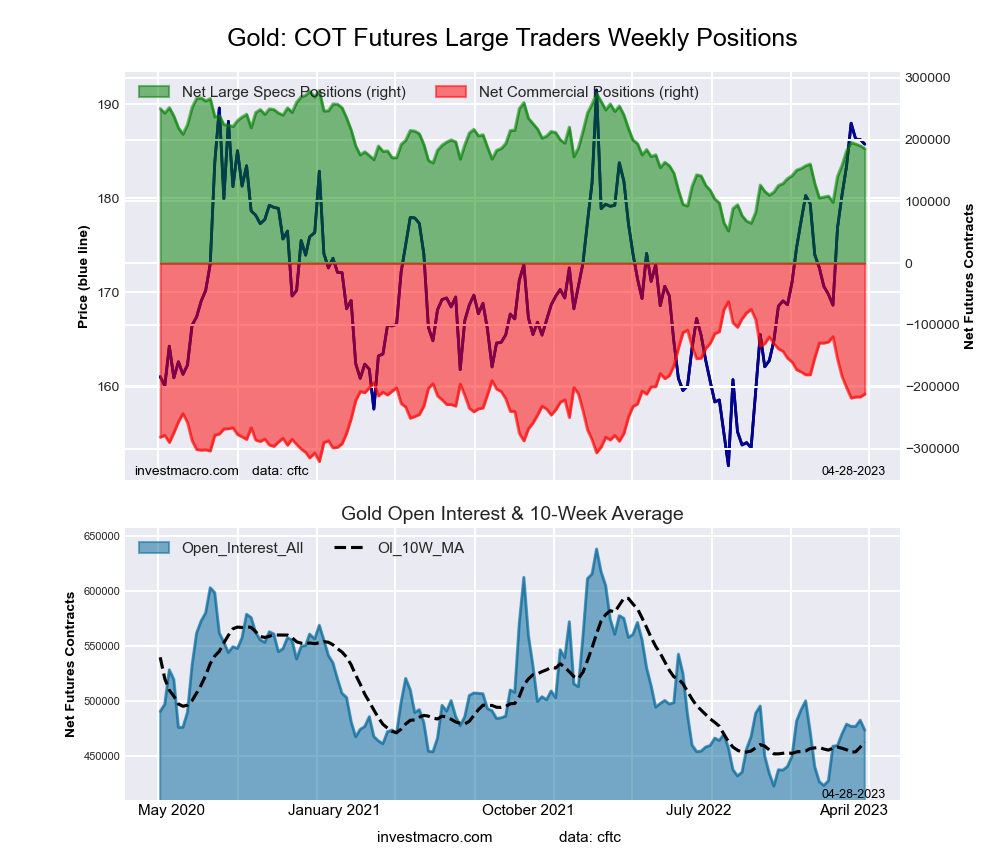
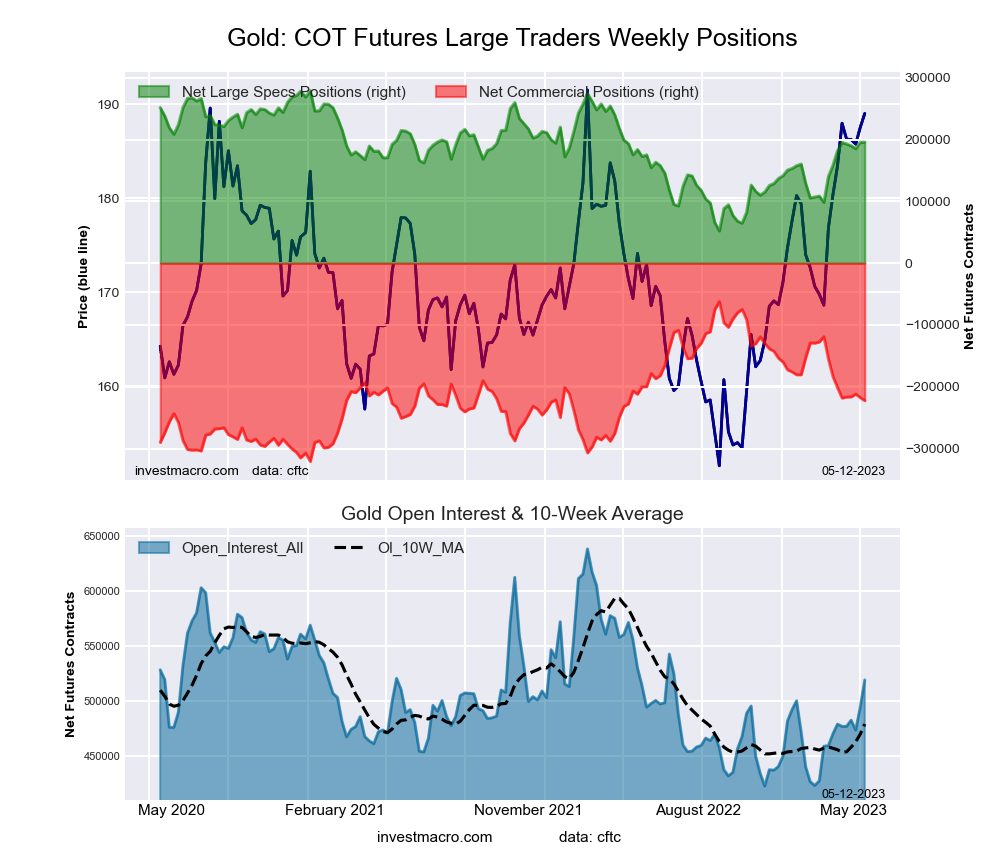 The Gold Comex Futures large speculator standing this week resulted in a net position of 195,814 contracts in the data reported through Tuesday. This was a weekly advance of 247 contracts from the previous week which had a total of 195,567 net contracts.
This week’s current strength score (the trader positioning range over the past three years, measured from 0 to 100) shows the speculators are currently Bullish with a score of 63.3 percent. The commercials are Bearish with a score of 38.0 percent and the small traders (not shown in chart) are Bearish with a score of 46.9 percent.
| Gold Futures Statistics | SPECULATORS | COMMERCIALS | SMALL TRADERS |
| – Percent of Open Interest Longs: | 51.3 | 25.2 | 10.0 |
| – Percent of Open Interest Shorts: | 13.6 | 68.1 | 4.9 |
| – Net Position: | 195,814 | -222,515 | 26,701 |
| – Gross Longs: | 266,472 | 130,985 | 52,012 |
| – Gross Shorts: | 70,658 | 353,500 | 25,311 |
| – Long to Short Ratio: | 3.8 to 1 | 0.4 to 1 | 2.1 to 1 |
| NET POSITION TREND: | |||
| – Strength Index Score (3 Year Range Pct): | 63.3 | 38.0 | 46.9 |
| – Strength Index Reading (3 Year Range): | Bullish | Bearish | Bearish |
| NET POSITION MOVEMENT INDEX: | |||
| – 6-Week Change in Strength Index: | 6.2 | -8.1 | 17.1 |
Silver Comex Futures:
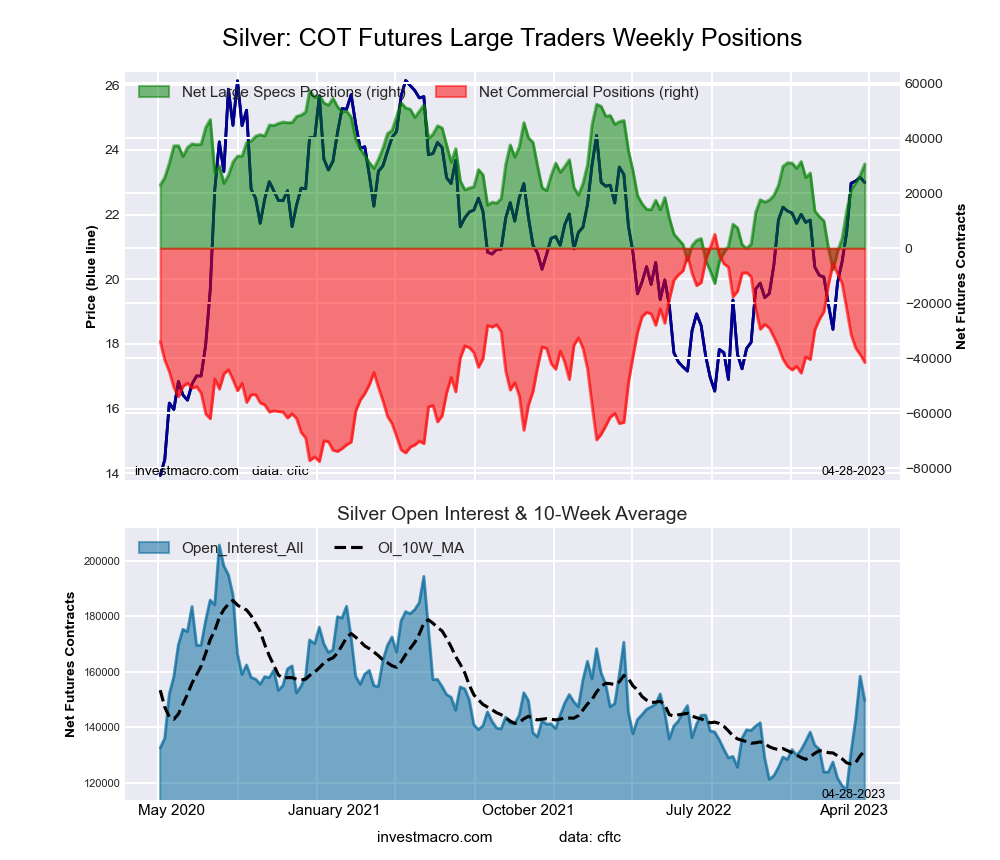
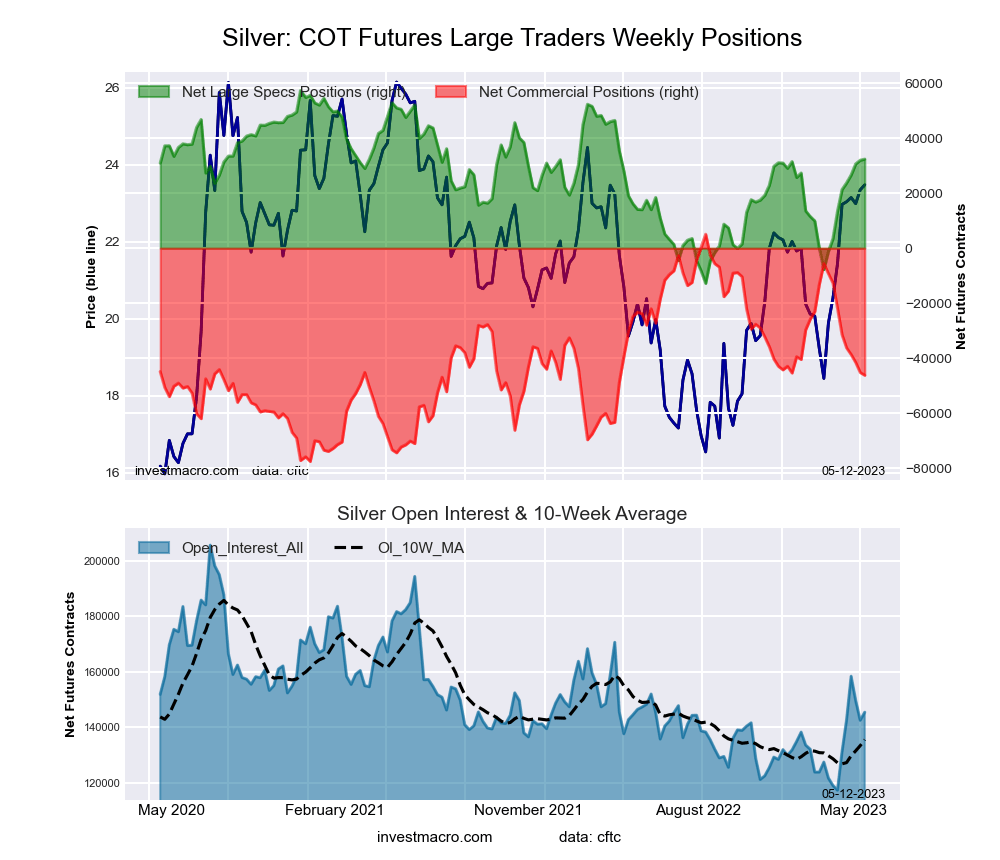 The Silver Comex Futures large speculator standing this week resulted in a net position of 32,360 contracts in the data reported through Tuesday. This was a weekly advance of 408 contracts from the previous week which had a total of 31,952 net contracts.
This week’s current strength score (the trader positioning range over the past three years, measured from 0 to 100) shows the speculators are currently Bullish with a score of 64.4 percent. The commercials are Bearish with a score of 37.9 percent and the small traders (not shown in chart) are Bearish with a score of 43.3 percent.
| Silver Futures Statistics | SPECULATORS | COMMERCIALS | SMALL TRADERS |
| – Percent of Open Interest Longs: | 47.6 | 28.6 | 17.5 |
| – Percent of Open Interest Shorts: | 25.3 | 60.4 | 8.0 |
| – Net Position: | 32,360 | -46,190 | 13,830 |
| – Gross Longs: | 69,166 | 41,636 | 25,474 |
| – Gross Shorts: | 36,806 | 87,826 | 11,644 |
| – Long to Short Ratio: | 1.9 to 1 | 0.5 to 1 | 2.2 to 1 |
| NET POSITION TREND: | |||
| – Strength Index Score (3 Year Range Pct): | 64.4 | 37.9 | 43.3 |
| – Strength Index Reading (3 Year Range): | Bullish | Bearish | Bearish |
| NET POSITION MOVEMENT INDEX: | |||
| – 6-Week Change in Strength Index: | 27.1 | -29.4 | 29.8 |
Copper Grade #1 Futures:
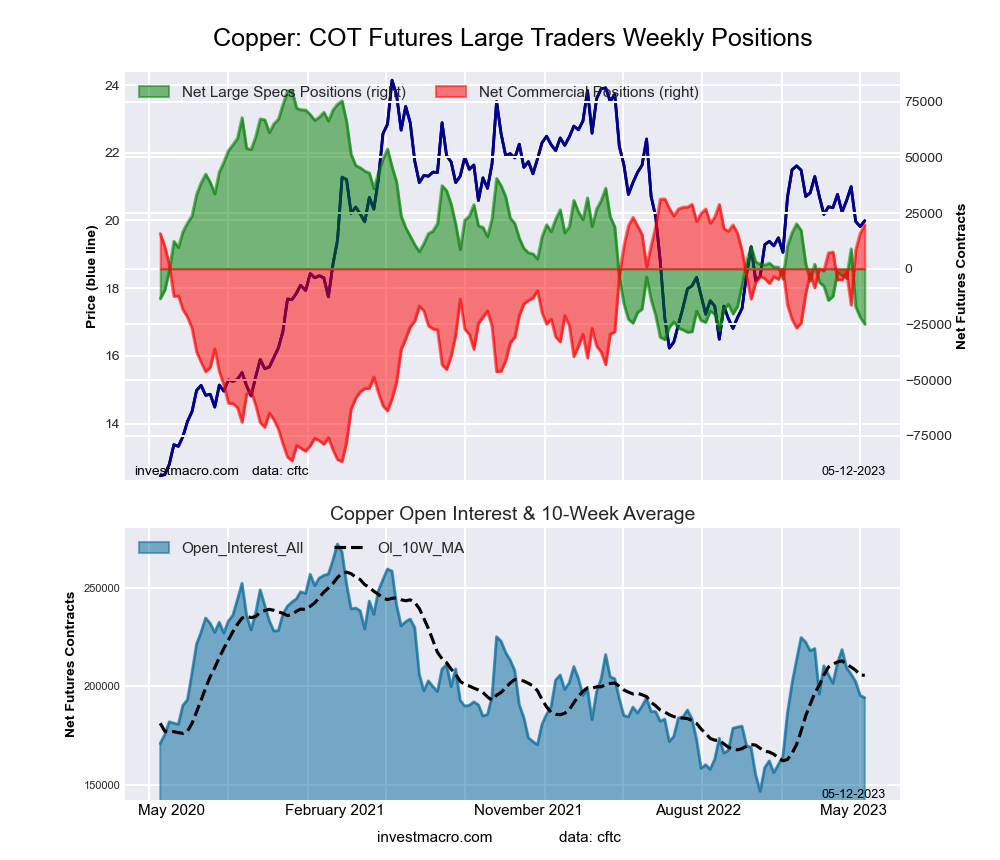 The Copper Grade #1 Futures large speculator standing this week resulted in a net position of -24,865 contracts in the data reported through Tuesday. This was a weekly decrease of -3,123 contracts from the previous week which had a total of -21,742 net contracts.
This week’s current strength score (the trader positioning range over the past three years, measured from 0 to 100) shows the speculators are currently Bearish-Extreme with a score of 6.2 percent. The commercials are Bullish-Extreme with a score of 90.2 percent and the small traders (not shown in chart) are Bullish with a score of 50.9 percent.
| Copper Futures Statistics | SPECULATORS | COMMERCIALS | SMALL TRADERS |
| – Percent of Open Interest Longs: | 28.4 | 48.0 | 9.4 |
| – Percent of Open Interest Shorts: | 41.2 | 37.8 | 6.8 |
| – Net Position: | -24,865 | 19,732 | 5,133 |
| – Gross Longs: | 55,131 | 93,211 | 18,255 |
| – Gross Shorts: | 79,996 | 73,479 | 13,122 |
| – Long to Short Ratio: | 0.7 to 1 | 1.3 to 1 | 1.4 to 1 |
| NET POSITION TREND: | |||
| – Strength Index Score (3 Year Range Pct): | 6.2 | 90.2 | 50.9 |
| – Strength Index Reading (3 Year Range): | Bearish-Extreme | Bullish-Extreme | Bullish |
| NET POSITION MOVEMENT INDEX: | |||
| – 6-Week Change in Strength Index: | -20.9 | 20.9 | -8.4 |
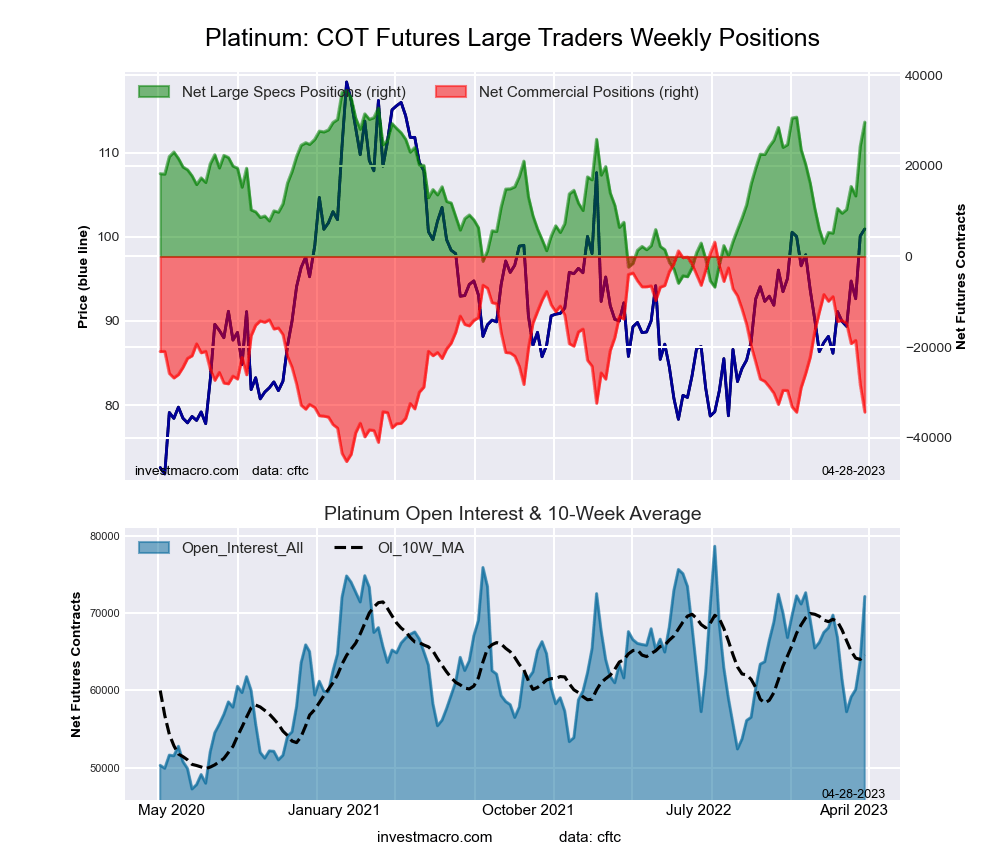
Platinum Futures:
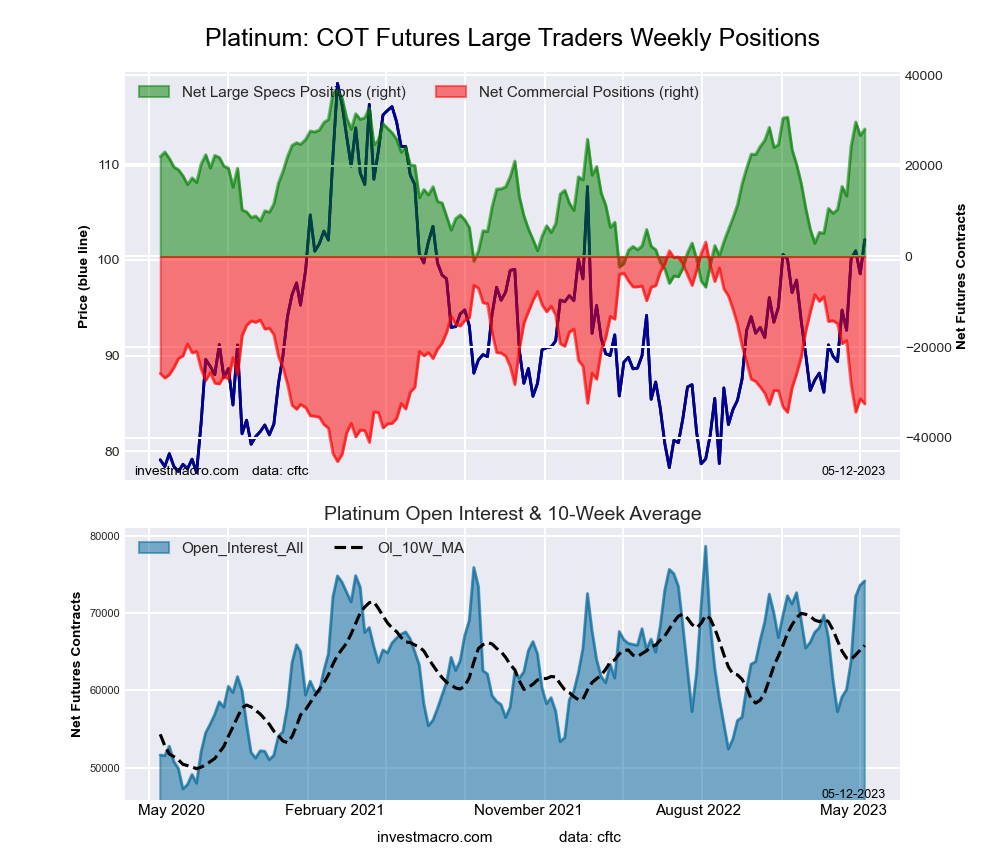 The Platinum Futures large speculator standing this week resulted in a net position of 28,084 contracts in the data reported through Tuesday. This was a weekly gain of 1,397 contracts from the previous week which had a total of 26,687 net contracts.
This week’s current strength score (the trader positioning range over the past three years, measured from 0 to 100) shows the speculators are currently Bullish-Extreme with a score of 80.4 percent. The commercials are Bearish with a score of 26.3 percent and the small traders (not shown in chart) are Bearish with a score of 27.1 percent.
| Platinum Futures Statistics | SPECULATORS | COMMERCIALS | SMALL TRADERS |
| – Percent of Open Interest Longs: | 56.3 | 27.5 | 10.2 |
| – Percent of Open Interest Shorts: | 18.4 | 71.4 | 4.2 |
| – Net Position: | 28,084 | -32,484 | 4,400 |
| – Gross Longs: | 41,712 | 20,408 | 7,535 |
| – Gross Shorts: | 13,628 | 52,892 | 3,135 |
| – Long to Short Ratio: | 3.1 to 1 | 0.4 to 1 | 2.4 to 1 |
| NET POSITION TREND: | |||
| – Strength Index Score (3 Year Range Pct): | 80.4 | 26.3 | 27.1 |
| – Strength Index Reading (3 Year Range): | Bullish-Extreme | Bearish | Bearish |
| NET POSITION MOVEMENT INDEX: | |||
| – 6-Week Change in Strength Index: | 40.9 | -36.6 | -0.1 |
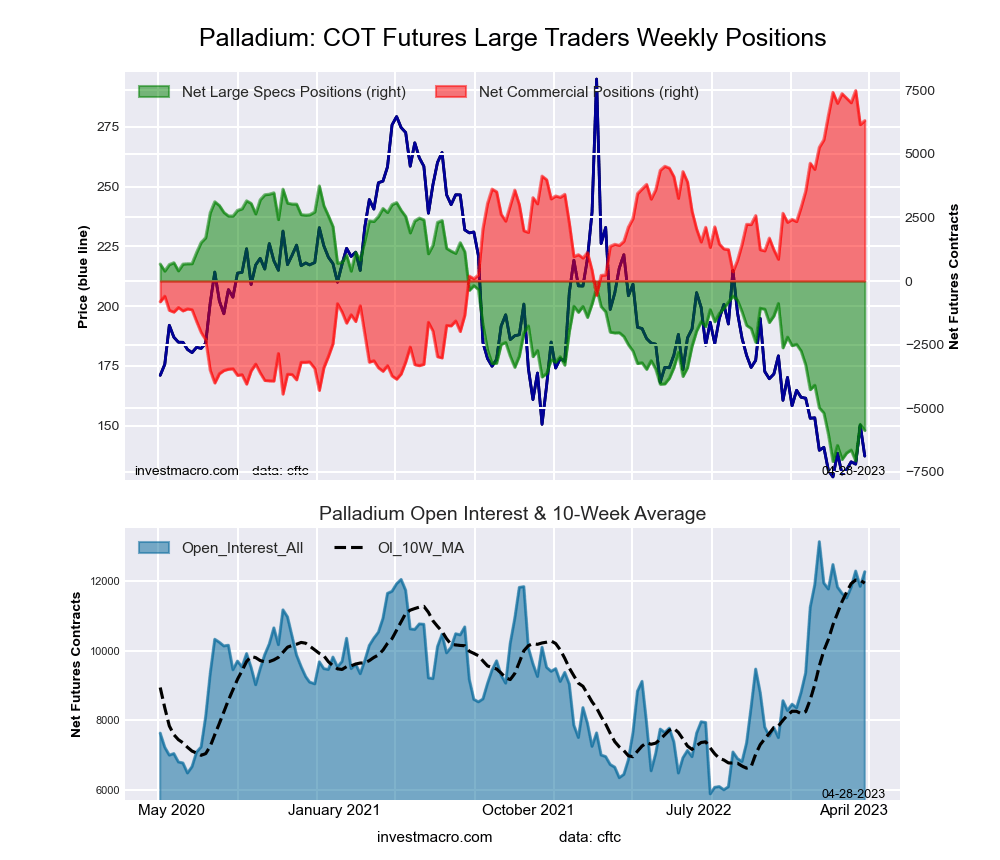
Palladium Futures:
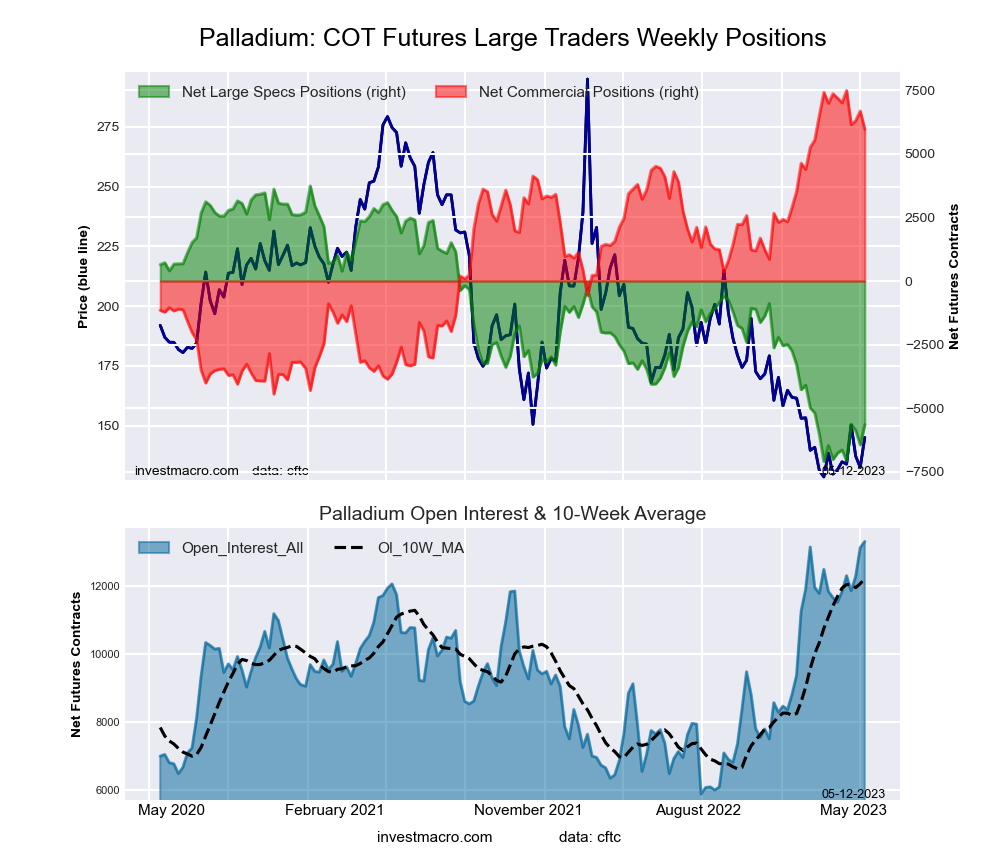 The Palladium Futures large speculator standing this week resulted in a net position of -5,647 contracts in the data reported through Tuesday. This was a weekly lift of 797 contracts from the previous week which had a total of -6,444 net contracts.
This week’s current strength score (the trader positioning range over the past three years, measured from 0 to 100) shows the speculators are currently Bearish-Extreme with a score of 13.4 percent. The commercials are Bullish-Extreme with a score of 87.2 percent and the small traders (not shown in chart) are Bearish with a score of 22.6 percent.
| Palladium Futures Statistics | SPECULATORS | COMMERCIALS | SMALL TRADERS |
| – Percent of Open Interest Longs: | 13.0 | 62.2 | 9.1 |
| – Percent of Open Interest Shorts: | 55.5 | 17.3 | 11.5 |
| – Net Position: | -5,647 | 5,965 | -318 |
| – Gross Longs: | 1,733 | 8,269 | 1,211 |
| – Gross Shorts: | 7,380 | 2,304 | 1,529 |
| – Long to Short Ratio: | 0.2 to 1 | 3.6 to 1 | 0.8 to 1 |
| NET POSITION TREND: | |||
| – Strength Index Score (3 Year Range Pct): | 13.4 | 87.2 | 22.6 |
| – Strength Index Reading (3 Year Range): | Bearish-Extreme | Bullish-Extreme | Bearish |
| NET POSITION MOVEMENT INDEX: | |||
| – 6-Week Change in Strength Index: | 10.3 | -10.3 | 6.7 |
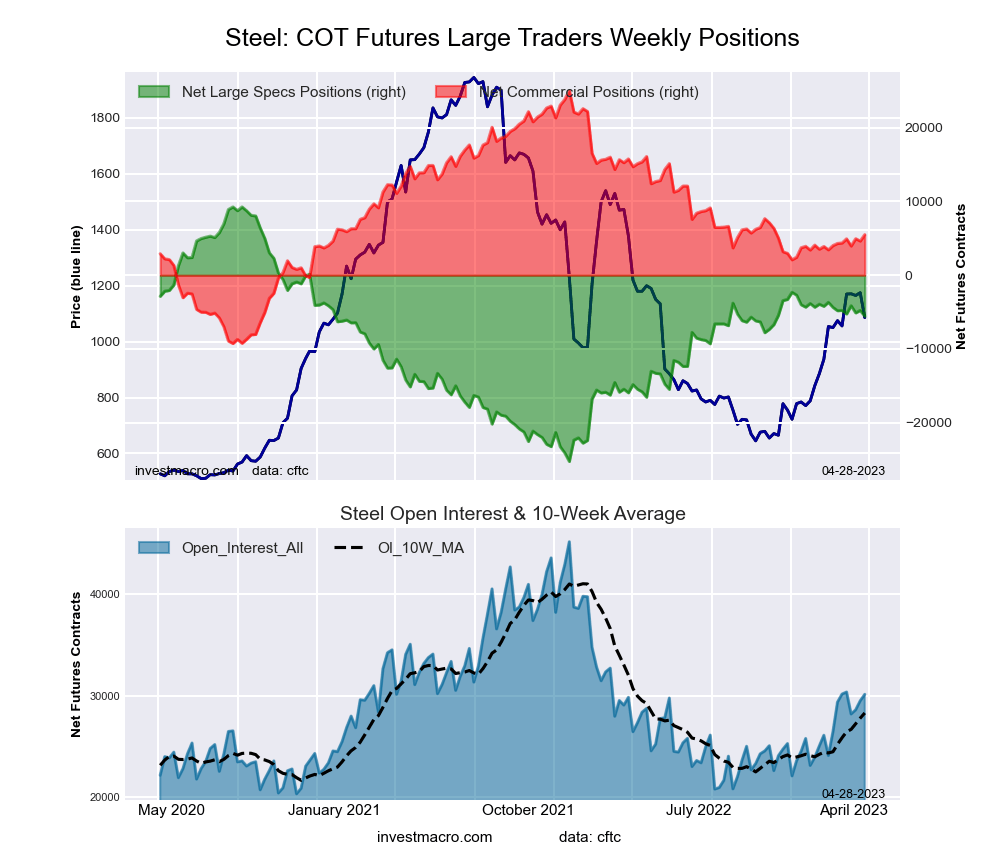
Steel Futures Futures:
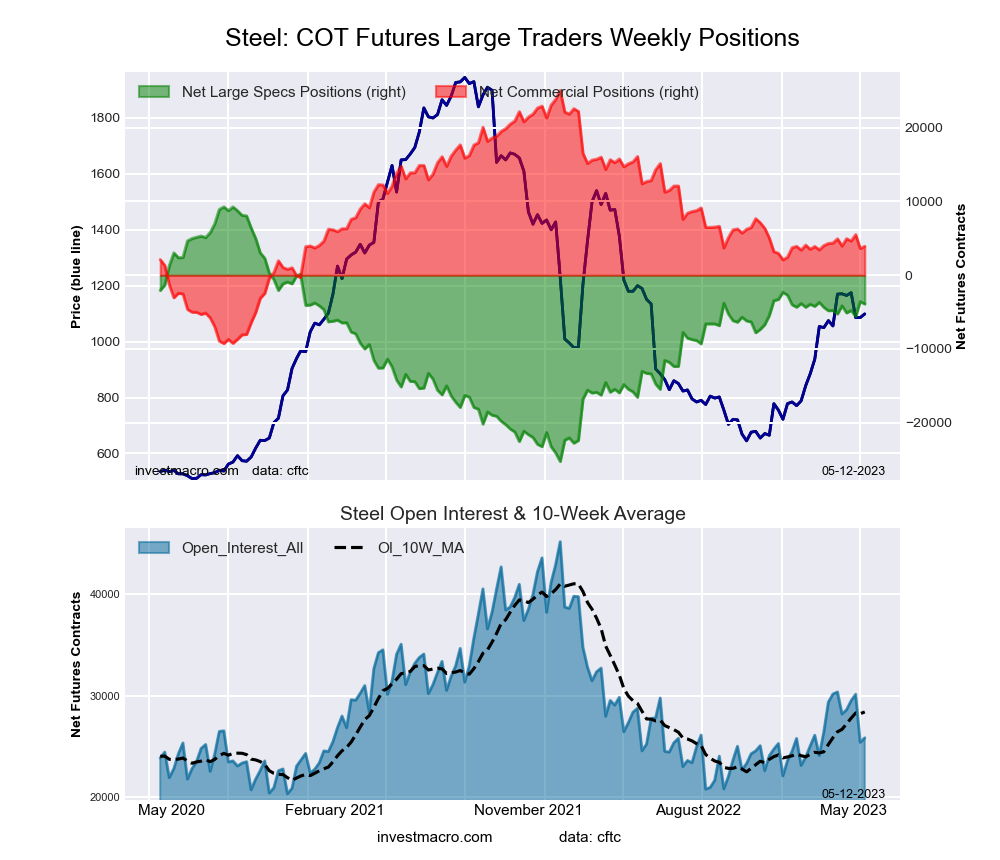 The Steel Futures large speculator standing this week resulted in a net position of -3,896 contracts in the data reported through Tuesday. This was a weekly decline of -314 contracts from the previous week which had a total of -3,582 net contracts.
This week’s current strength score (the trader positioning range over the past three years, measured from 0 to 100) shows the speculators are currently Bullish with a score of 61.9 percent. The commercials are Bearish with a score of 38.4 percent and the small traders (not shown in chart) are Bearish-Extreme with a score of 15.9 percent.
| Steel Futures Statistics | SPECULATORS | COMMERCIALS | SMALL TRADERS |
| – Percent of Open Interest Longs: | 12.2 | 77.1 | 0.8 |
| – Percent of Open Interest Shorts: | 27.3 | 61.9 | 0.9 |
| – Net Position: | -3,896 | 3,922 | -26 |
| – Gross Longs: | 3,161 | 19,929 | 214 |
| – Gross Shorts: | 7,057 | 16,007 | 240 |
| – Long to Short Ratio: | 0.4 to 1 | 1.2 to 1 | 0.9 to 1 |
| NET POSITION TREND: | |||
| – Strength Index Score (3 Year Range Pct): | 61.9 | 38.4 | 15.9 |
| – Strength Index Reading (3 Year Range): | Bullish | Bearish | Bearish-Extreme |
| NET POSITION MOVEMENT INDEX: | |||
| – 6-Week Change in Strength Index: | 3.9 | -2.9 | -45.4 |
Article By InvestMacro – Receive our weekly COT Newsletter
*COT Report: The COT data, released weekly to the public each Friday, is updated through the most recent Tuesday (data is 3 days old) and shows a quick view of how large speculators or non-commercials (for-profit traders) were positioned in the futures markets.
The CFTC categorizes trader positions according to commercial hedgers (traders who use futures contracts for hedging as part of the business), non-commercials (large traders who speculate to realize trading profits) and nonreportable traders (usually small traders/speculators) as well as their open interest (contracts open in the market at time of reporting). See CFTC criteria here.


