
By InvestMacro
Here are the latest charts and statistics for the Commitment of Traders (COT) reports data published by the Commodities Futures Trading Commission (CFTC).
The latest COT data is updated through Tuesday April 18th and shows a quick view of how large traders (for-profit speculators and commercial hedgers) were positioned in the futures markets.
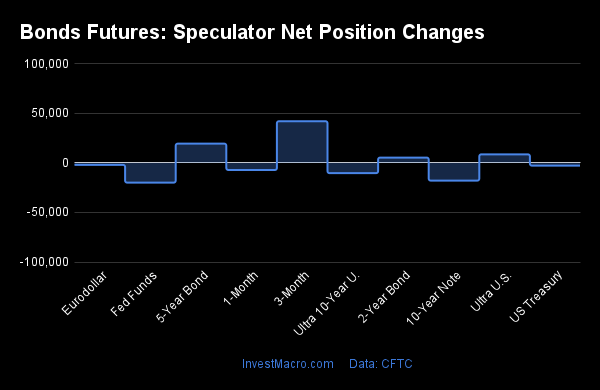
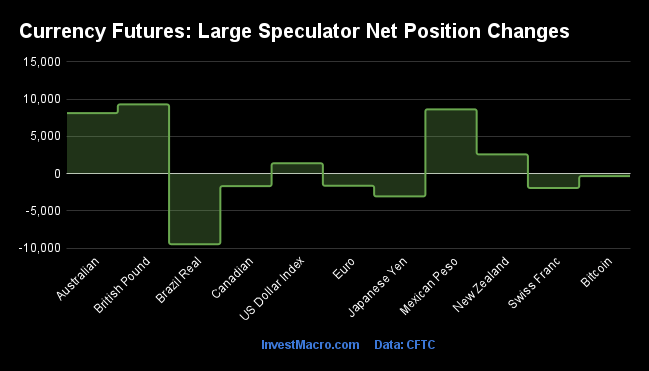
Weekly Speculator Changes led by 5-Year Bonds & Eurodollar
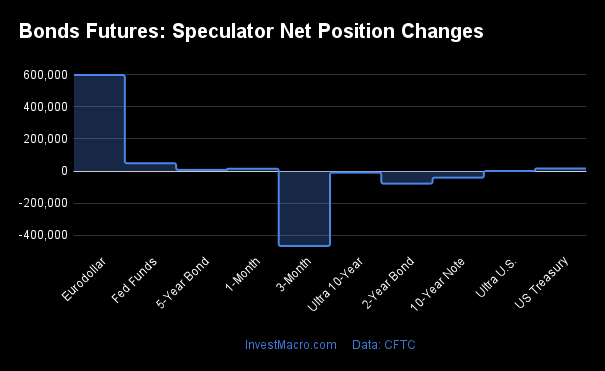
The COT bond market speculator bets were higher this week as five out of the nine bond markets we cover had higher positioning while the other four markets had lower speculator contracts.
Leading the gains for the bond markets was the Eurodollar (598,254 contracts) which, as noted last week, is being phased out and replaced by the Secured Overnight Financing Rate (SOFR 3-Months) contracts. The rise in Eurodollar bets was due to traders closing out their bearish positions while the SOFR 3-Months contracts saw a similar rise in bearish contracts this week.
The other markets with gains this week were the Fed Funds (48,557 contracts), the US Treasury Bonds (15,656 contracts), the 5-Year Bonds (7,479 contracts) and the Ultra Treasury Bonds (277 contracts) also showing positive weeks.
The bond markets with declines in speculator bets for the week were the SOFR 3-Months (-466,948 contracts) with the 2-Year Bonds (-78,073 contracts), the 10-Year Bonds (-41,044 contracts) and the Ultra 10-Year Bonds (-9,612 contracts) also registering lower bets on the week.
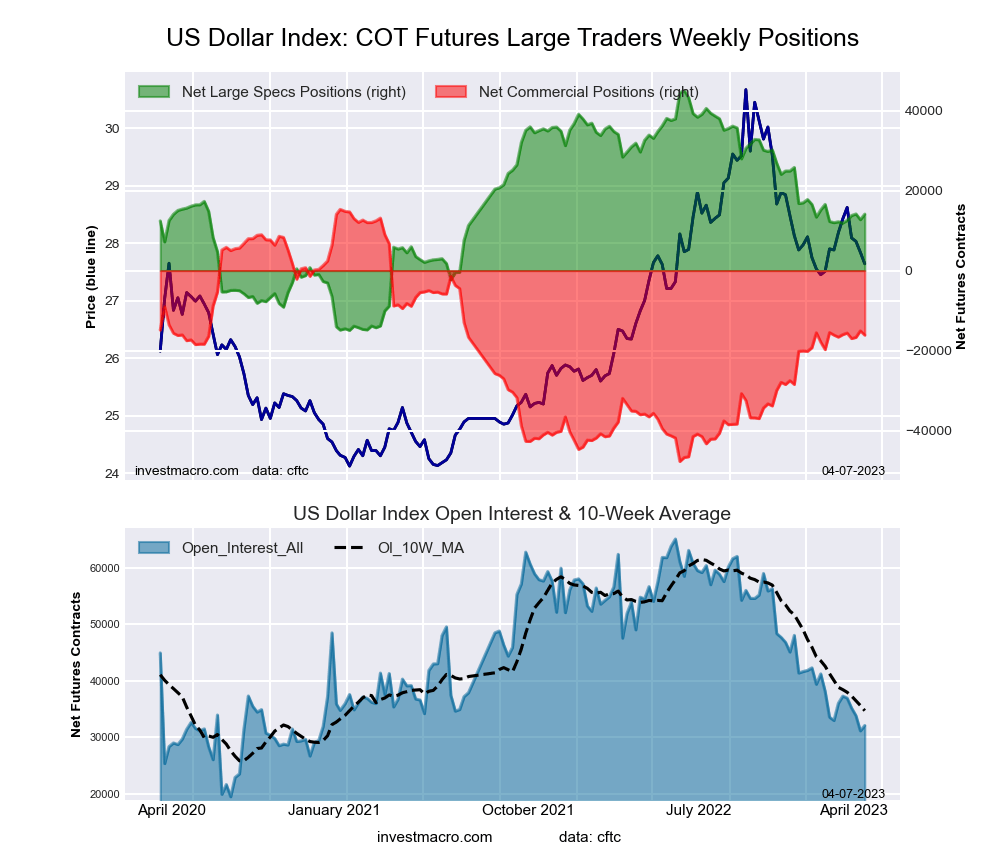
10-Year Bond Speculators drop bets to 237-week low
Highlighting the COT bond’s data this week is the weakness in the 10-Year Bonds speculator net contracts. Large speculative 10-Year Bond positions fell this week by over -40,000 net contracts and have declined for three straight weeks as well as in four out of the past five weeks. The 10-Year Bond net position has now seen a total of -172,715 contracts added to the existing bearish standing over this past five week period.
The 10-Year positions have now fallen (currently at -680,081 contracts) to the most bearish level since October 2nd of 2018, a span of 237 weeks from when the net position totaled -740,192 contracts.
Overall, the 10-Year speculator net positions have now been in a continuous bearish level for 80 straight weeks, dating back to October 12th of 2021 when the net position flipped from bullish to bearish. Since that time, the net position has steadily increased in bearishness (save for a couple of short pullbacks) as the sentiment for bonds has been decimated due to the US Federal Reserve raising their benchmark interest rate (to fight inflation). Despite the current outlook (Fed Rate Tool) that the Federal Reserve will likely only raise the interest rate one more time in May, speculators have continued to raise their bearish bets for the 10-Year.
The 10-Year front-month futures price, meanwhile, has not dropped back to the lowest levels of this cycle. The price closed at 114.15 this week and is almost 5 percent higher than the lows of October when prices dropped to the 108 levels.
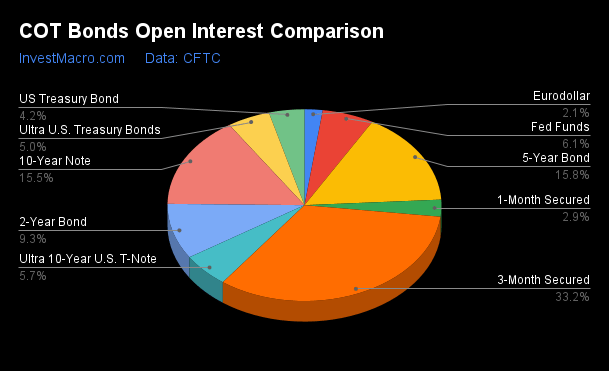
| Apr-18-2023 | OI | OI-Index | Spec-Net | Spec-Index | Com-Net | COM-Index | Smalls-Net | Smalls-Index |
|---|---|---|---|---|---|---|---|---|
| Eurodollar | 603,310 | 0 | -51,231 | 73 | 47,522 | 23 | 3,709 | 100 |
| FedFunds | 1,728,594 | 66 | -118,719 | 25 | 130,563 | 76 | -11,844 | 68 |
| 2-Year | 2,642,314 | 78 | -574,914 | 16 | 520,558 | 81 | 54,356 | 82 |
| Long T-Bond | 1,185,802 | 54 | -116,928 | 47 | 46,235 | 27 | 70,693 | 100 |
| 10-Year | 4,393,559 | 92 | -680,081 | 0 | 638,740 | 90 | 41,341 | 94 |
| 5-Year | 4,472,642 | 99 | -754,502 | 3 | 716,633 | 93 | 37,869 | 91 |
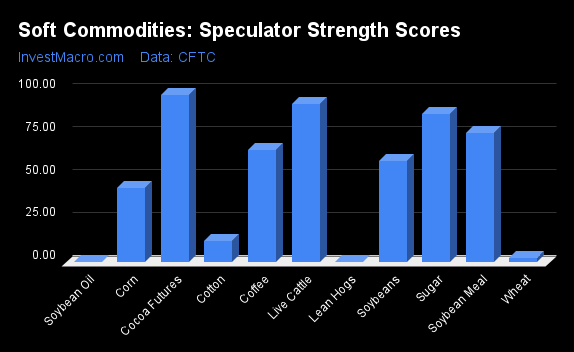
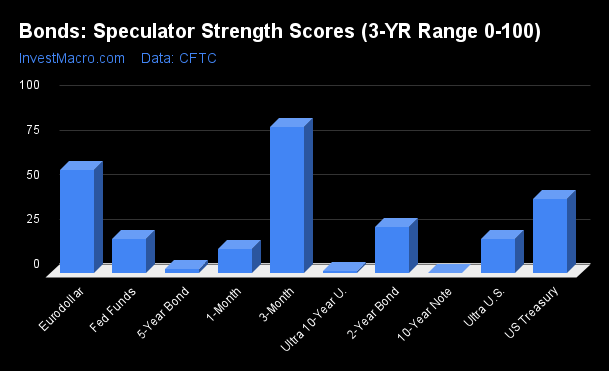
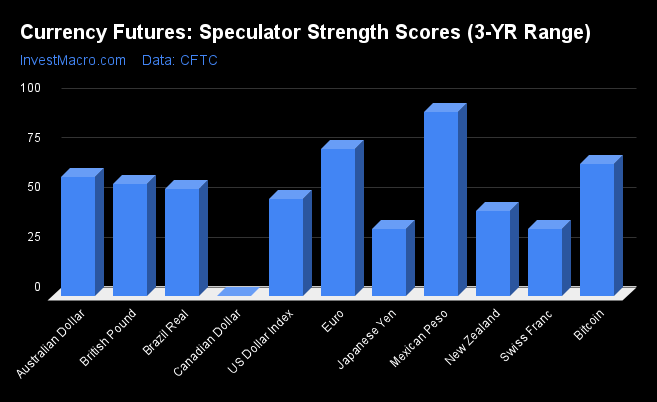
Strength Scores led by Eurodollar & US Treasury Bonds
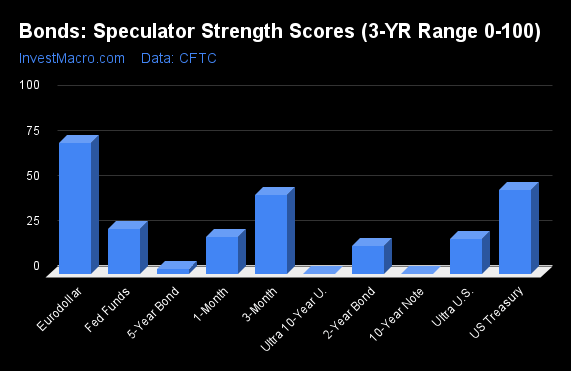
COT Strength Scores (a normalized measure of Speculator positions over a 3-Year range, from 0 to 100 where above 80 is Extreme-Bullish and below 20 is Extreme-Bearish) showed that the Eurodollar (73 percent) and the US Treasury Bonds (47 percent) lead the bond markets this week. The SOFR 3-Months (44 percent) comes in as the next highest in the weekly strength scores.
On the downside, the Ultra 10-Year Bonds (0 percent), the 10-Year Bonds (0 percent), the 5-Year Bonds (3 percent) and the 2-Year Bonds (16 percent) come in at the lowest strength level currently and are all in Extreme-Bearish territory (below 20 percent).
Strength Statistics:
Fed Funds (25.0 percent) vs Fed Funds previous week (19.0 percent)
2-Year Bond (15.5 percent) vs 2-Year Bond previous week (25.5 percent)
5-Year Bond (3.0 percent) vs 5-Year Bond previous week (2.2 percent)
10-Year Bond (0.0 percent) vs 10-Year Bond previous week (4.8 percent)
Ultra 10-Year Bond (0.0 percent) vs Ultra 10-Year Bond previous week (2.0 percent)
US Treasury Bond (46.5 percent) vs US Treasury Bond previous week (41.4 percent)
Ultra US Treasury Bond (19.1 percent) vs Ultra US Treasury Bond previous week (19.0 percent)
Eurodollar (72.7 percent) vs Eurodollar previous week (57.4 percent)
SOFR 3-Months (43.8 percent) vs SOFR 3-Months previous week (81.6 percent)
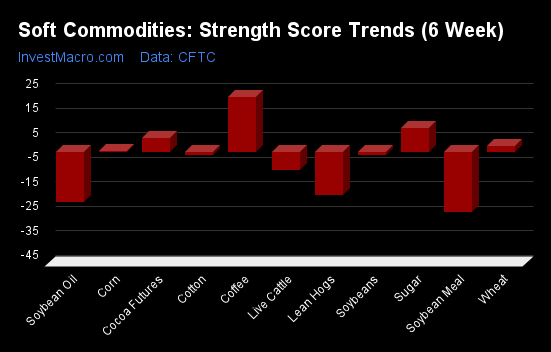
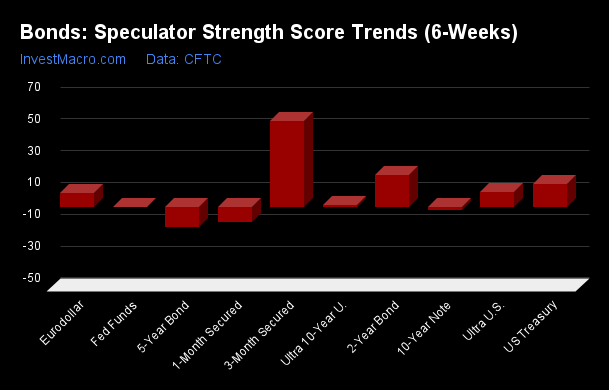
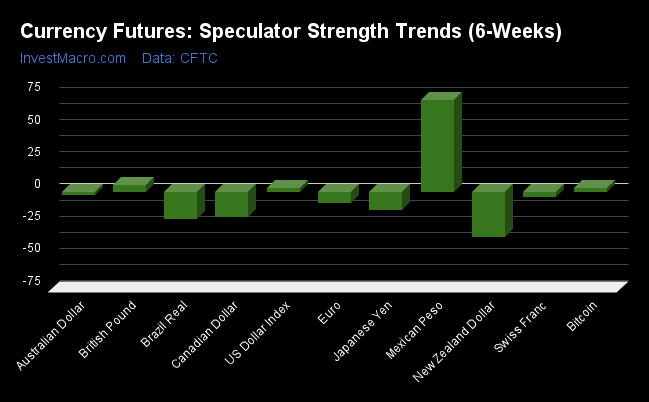
SOFR 3-Months & Eurodollar top the 6-Week Strength Trends
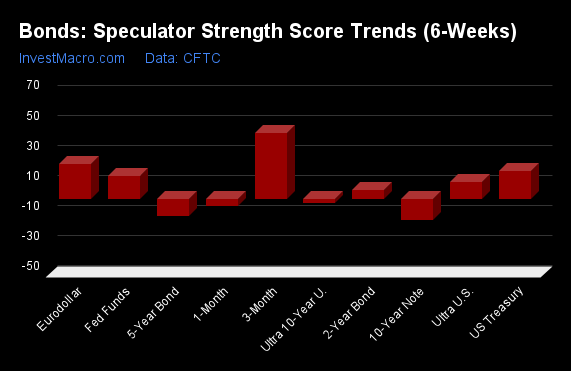
COT Strength Score Trends (or move index, calculates the 6-week changes in strength scores) showed that the SOFR 3-Months (44 percent) and the Eurodollar (23 percent) lead the past six weeks trends for bonds. The US Treasury Bonds (18 percent) and are the next highest positive movers in the latest trends data.
The 10-Year Bonds (-14 percent) and the 5-Year Bonds (-11 percent) lead the downside trend scores currently with the Ultra 10-Year Bonds (-3 percent) following next with lower trend scores.
Strength Trend Statistics:
Fed Funds (15.2 percent) vs Fed Funds previous week (0.5 percent)
2-Year Bond (5.5 percent) vs 2-Year Bond previous week (20.4 percent)
5-Year Bond (-11.2 percent) vs 5-Year Bond previous week (-12.4 percent)
10-Year Bond (-14.4 percent) vs 10-Year Bond previous week (-1.3 percent)
Ultra 10-Year Bond (-3.0 percent) vs Ultra 10-Year Bond previous week (1.1 percent)
US Treasury Bond (18.3 percent) vs US Treasury Bond previous week (14.4 percent)
Ultra US Treasury Bond (11.3 percent) vs Ultra US Treasury Bond previous week (9.9 percent)
Eurodollar (23.1 percent) vs Eurodollar previous week (9.0 percent)
SOFR 3-Months (43.8 percent) vs SOFR 3-Months previous week (54.2 percent)
Individual Bond Markets:
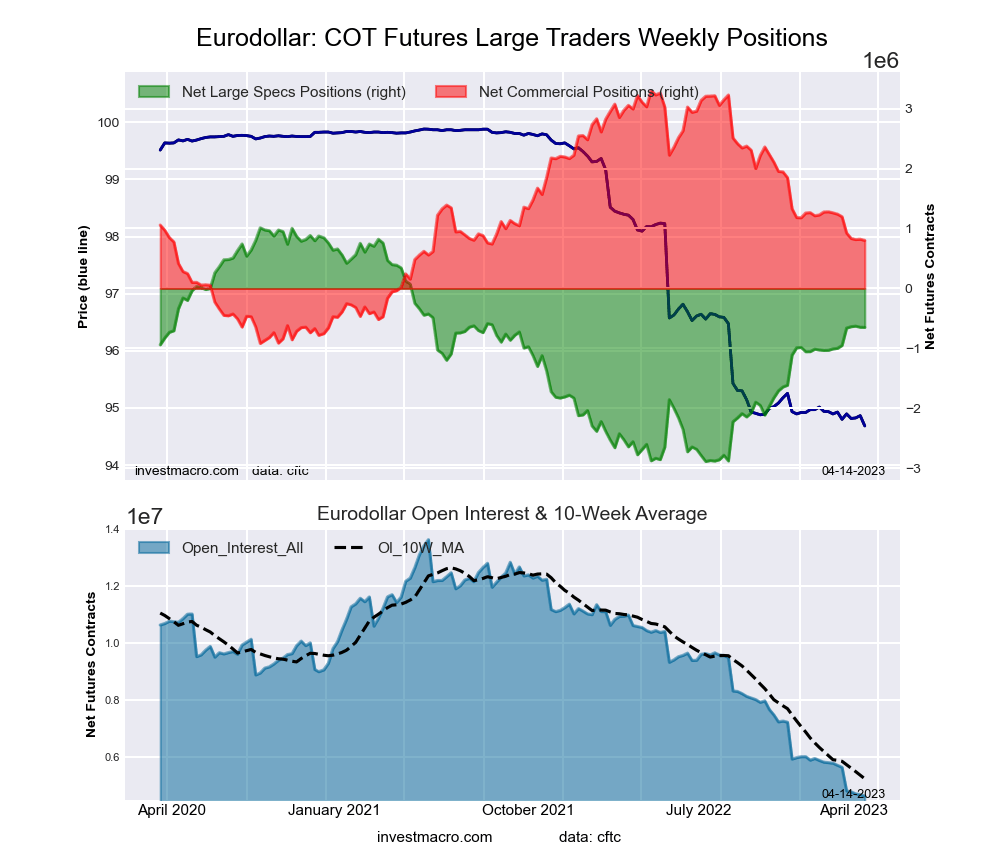
3-Month Eurodollars Futures:
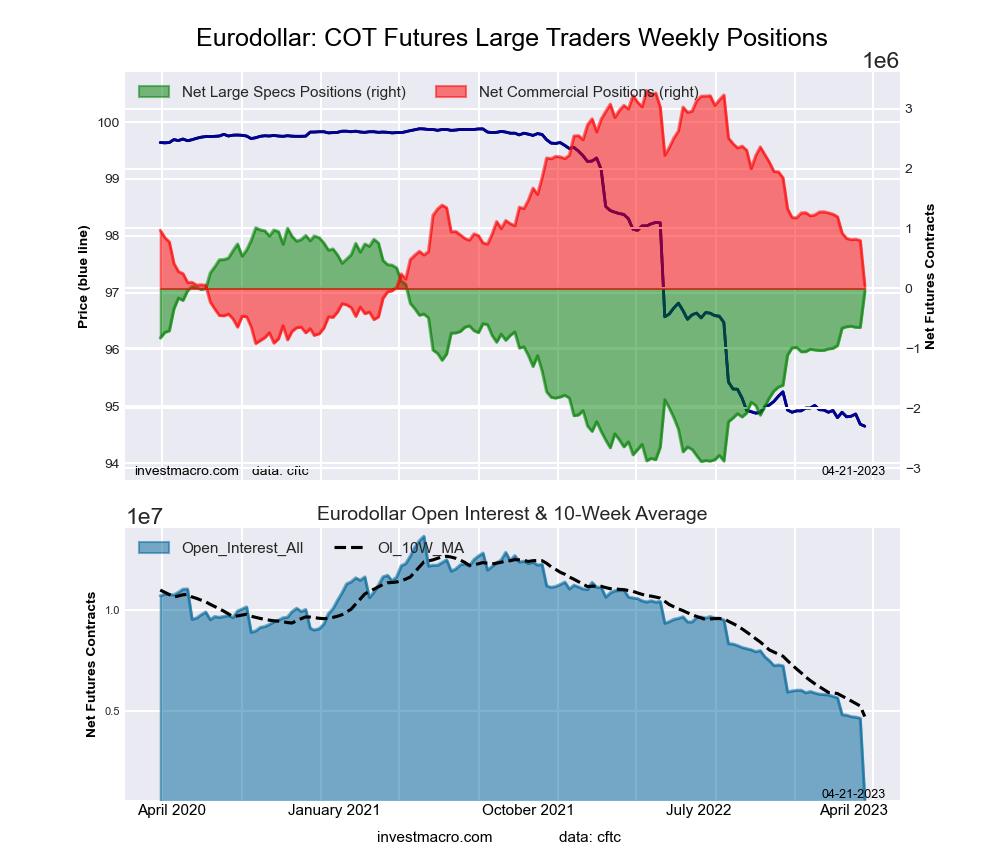 The 3-Month Eurodollars large speculator standing this week reached a net position of -51,231 contracts in the data reported through Tuesday. This was a weekly lift of 598,254 contracts from the previous week which had a total of -649,485 net contracts.
This week’s current strength score (the trader positioning range over the past three years, measured from 0 to 100) shows the speculators are currently Bullish with a score of 72.7 percent. The commercials are Bearish with a score of 22.9 percent and the small traders (not shown in chart) are Bullish-Extreme with a score of 100.0 percent.
| 3-Month Eurodollars Statistics | SPECULATORS | COMMERCIALS | SMALL TRADERS |
| – Percent of Open Interest Longs: | 26.3 | 60.6 | 11.1 |
| – Percent of Open Interest Shorts: | 34.8 | 52.7 | 10.5 |
| – Net Position: | -51,231 | 47,522 | 3,709 |
| – Gross Longs: | 158,876 | 365,308 | 67,086 |
| – Gross Shorts: | 210,107 | 317,786 | 63,377 |
| – Long to Short Ratio: | 0.8 to 1 | 1.1 to 1 | 1.1 to 1 |
| NET POSITION TREND: | |||
| – Strength Index Score (3 Year Range Pct): | 72.7 | 22.9 | 100.0 |
| – Strength Index Reading (3 Year Range): | Bullish | Bearish | Bullish-Extreme |
| NET POSITION MOVEMENT INDEX: | |||
| – 6-Week Change in Strength Index: | 23.1 | -27.2 | 52.0 |
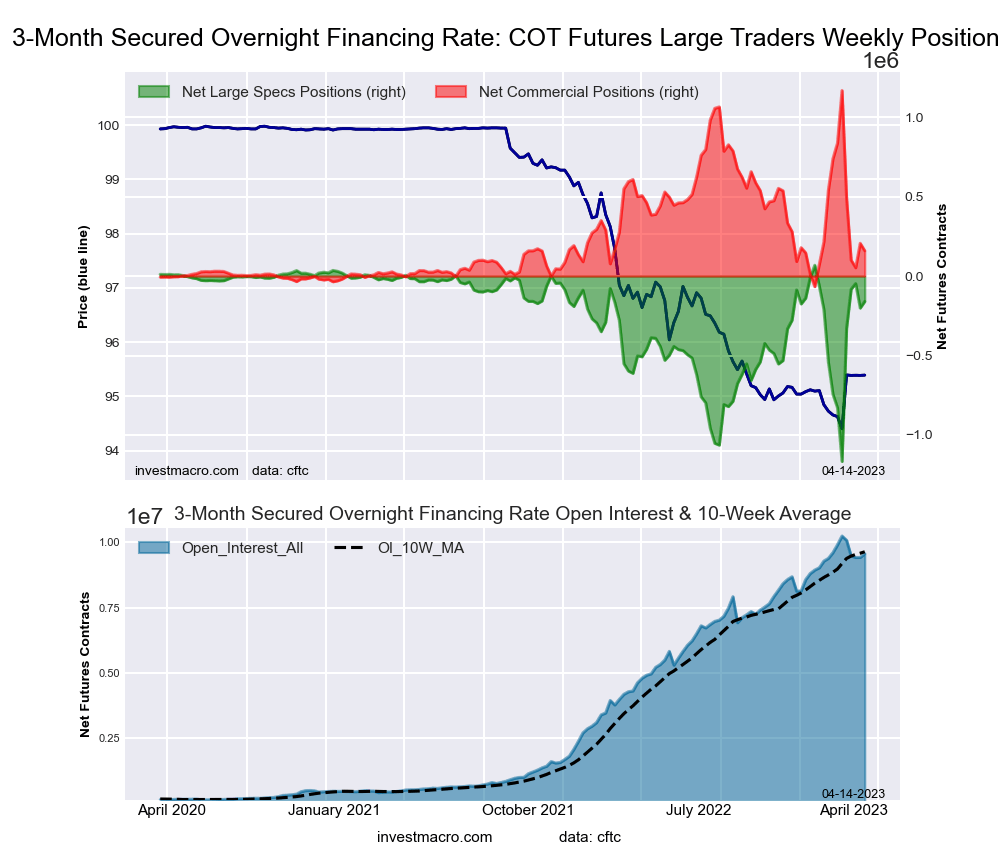
Secured Overnight Financing Rate (3-Month) Futures:
 The Secured Overnight Financing Rate (3-Month) large speculator standing this week reached a net position of -626,388 contracts in the data reported through Tuesday. This was a weekly lowering of -466,948 contracts from the previous week which had a total of -159,440 net contracts.
This week’s current strength score (the trader positioning range over the past three years, measured from 0 to 100) shows the speculators are currently Bearish with a score of 43.8 percent. The commercials are Bullish with a score of 56.3 percent and the small traders (not shown in chart) are Bullish-Extreme with a score of 87.0 percent.
| SOFR 3-Months Statistics | SPECULATORS | COMMERCIALS | SMALL TRADERS |
| – Percent of Open Interest Longs: | 13.9 | 65.0 | 0.6 |
| – Percent of Open Interest Shorts: | 20.5 | 58.3 | 0.6 |
| – Net Position: | -626,388 | 627,991 | -1,603 |
| – Gross Longs: | 1,301,626 | 6,103,493 | 54,601 |
| – Gross Shorts: | 1,928,014 | 5,475,502 | 56,204 |
| – Long to Short Ratio: | 0.7 to 1 | 1.1 to 1 | 1.0 to 1 |
| NET POSITION TREND: | |||
| – Strength Index Score (3 Year Range Pct): | 43.8 | 56.3 | 87.0 |
| – Strength Index Reading (3 Year Range): | Bearish | Bullish | Bullish-Extreme |
| NET POSITION MOVEMENT INDEX: | |||
| – 6-Week Change in Strength Index: | 43.8 | -43.7 | -0.3 |
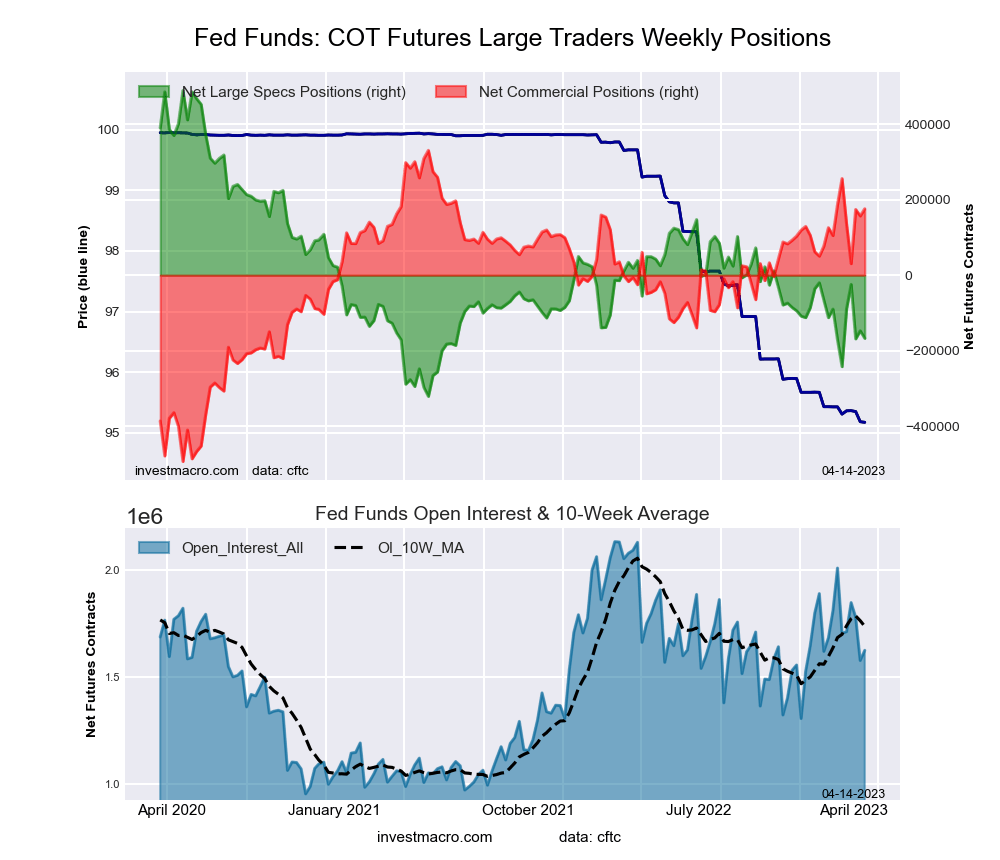
30-Day Federal Funds Futures:
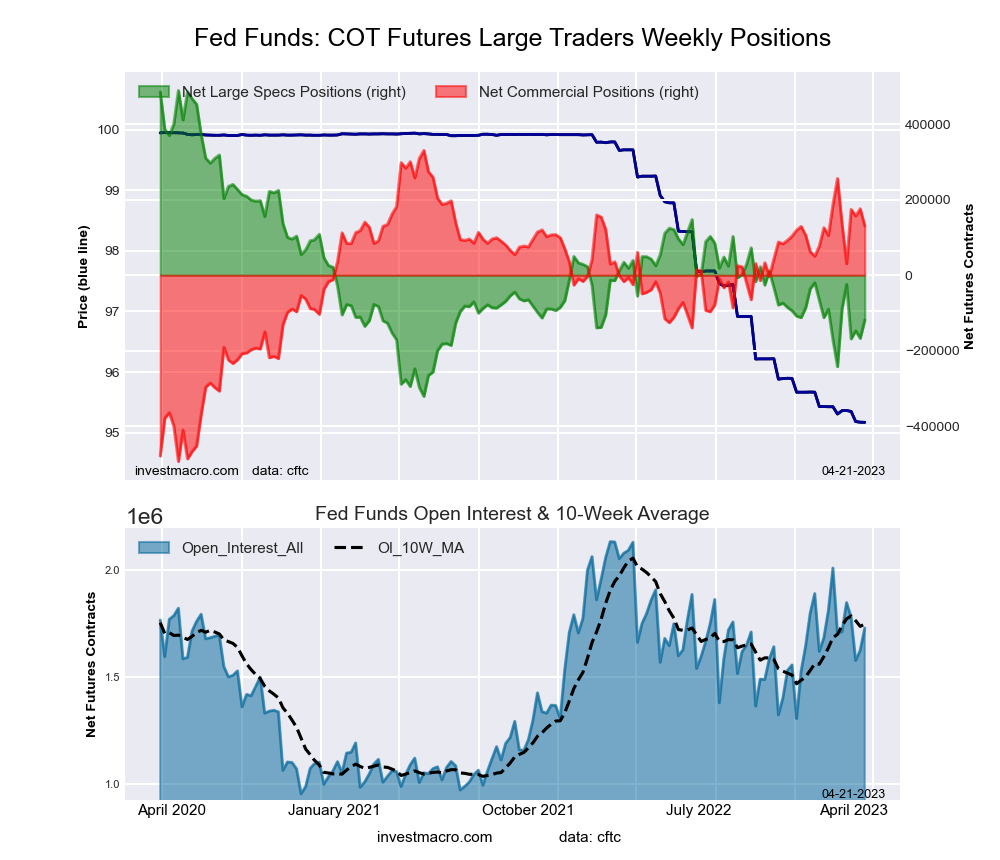 The 30-Day Federal Funds large speculator standing this week reached a net position of -118,719 contracts in the data reported through Tuesday. This was a weekly rise of 48,557 contracts from the previous week which had a total of -167,276 net contracts.
This week’s current strength score (the trader positioning range over the past three years, measured from 0 to 100) shows the speculators are currently Bearish with a score of 25.0 percent. The commercials are Bullish with a score of 75.7 percent and the small traders (not shown in chart) are Bullish with a score of 67.8 percent.
| 30-Day Federal Funds Statistics | SPECULATORS | COMMERCIALS | SMALL TRADERS |
| – Percent of Open Interest Longs: | 4.1 | 79.7 | 2.4 |
| – Percent of Open Interest Shorts: | 11.0 | 72.2 | 3.0 |
| – Net Position: | -118,719 | 130,563 | -11,844 |
| – Gross Longs: | 70,694 | 1,377,903 | 40,832 |
| – Gross Shorts: | 189,413 | 1,247,340 | 52,676 |
| – Long to Short Ratio: | 0.4 to 1 | 1.1 to 1 | 0.8 to 1 |
| NET POSITION TREND: | |||
| – Strength Index Score (3 Year Range Pct): | 25.0 | 75.7 | 67.8 |
| – Strength Index Reading (3 Year Range): | Bearish | Bullish | Bullish |
| NET POSITION MOVEMENT INDEX: | |||
| – 6-Week Change in Strength Index: | 15.2 | -15.2 | 3.8 |
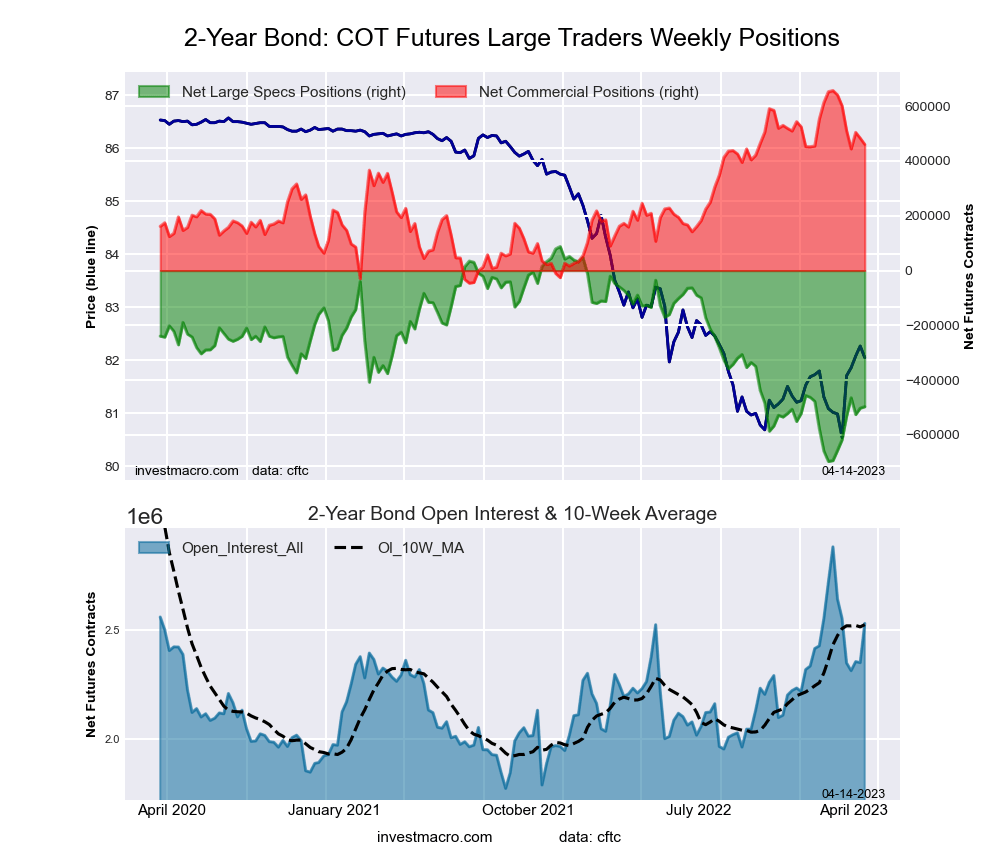
2-Year Treasury Note Futures:
 The 2-Year Treasury Note large speculator standing this week reached a net position of -574,914 contracts in the data reported through Tuesday. This was a weekly decrease of -78,073 contracts from the previous week which had a total of -496,841 net contracts.
This week’s current strength score (the trader positioning range over the past three years, measured from 0 to 100) shows the speculators are currently Bearish-Extreme with a score of 15.5 percent. The commercials are Bullish-Extreme with a score of 80.6 percent and the small traders (not shown in chart) are Bullish-Extreme with a score of 81.8 percent.
| 2-Year Treasury Note Statistics | SPECULATORS | COMMERCIALS | SMALL TRADERS |
| – Percent of Open Interest Longs: | 8.6 | 82.2 | 8.4 |
| – Percent of Open Interest Shorts: | 30.4 | 62.5 | 6.3 |
| – Net Position: | -574,914 | 520,558 | 54,356 |
| – Gross Longs: | 227,652 | 2,173,300 | 221,790 |
| – Gross Shorts: | 802,566 | 1,652,742 | 167,434 |
| – Long to Short Ratio: | 0.3 to 1 | 1.3 to 1 | 1.3 to 1 |
| NET POSITION TREND: | |||
| – Strength Index Score (3 Year Range Pct): | 15.5 | 80.6 | 81.8 |
| – Strength Index Reading (3 Year Range): | Bearish-Extreme | Bullish-Extreme | Bullish-Extreme |
| NET POSITION MOVEMENT INDEX: | |||
| – 6-Week Change in Strength Index: | 5.5 | -11.5 | 18.1 |
5-Year Treasury Note Futures:
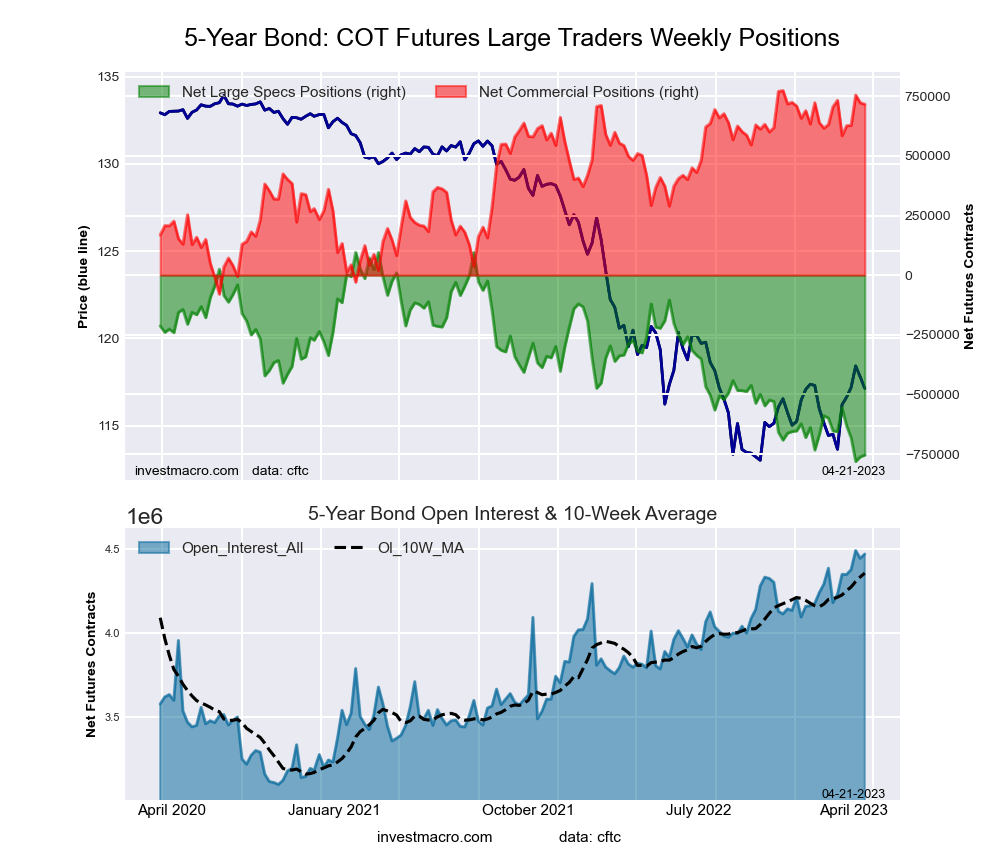 The 5-Year Treasury Note large speculator standing this week reached a net position of -754,502 contracts in the data reported through Tuesday. This was a weekly lift of 7,479 contracts from the previous week which had a total of -761,981 net contracts.
This week’s current strength score (the trader positioning range over the past three years, measured from 0 to 100) shows the speculators are currently Bearish-Extreme with a score of 3.0 percent. The commercials are Bullish-Extreme with a score of 93.3 percent and the small traders (not shown in chart) are Bullish-Extreme with a score of 91.4 percent.
| 5-Year Treasury Note Statistics | SPECULATORS | COMMERCIALS | SMALL TRADERS |
| – Percent of Open Interest Longs: | 6.0 | 84.4 | 8.2 |
| – Percent of Open Interest Shorts: | 22.9 | 68.4 | 7.4 |
| – Net Position: | -754,502 | 716,633 | 37,869 |
| – Gross Longs: | 270,063 | 3,775,123 | 366,773 |
| – Gross Shorts: | 1,024,565 | 3,058,490 | 328,904 |
| – Long to Short Ratio: | 0.3 to 1 | 1.2 to 1 | 1.1 to 1 |
| NET POSITION TREND: | |||
| – Strength Index Score (3 Year Range Pct): | 3.0 | 93.3 | 91.4 |
| – Strength Index Reading (3 Year Range): | Bearish-Extreme | Bullish-Extreme | Bullish-Extreme |
| NET POSITION MOVEMENT INDEX: | |||
| – 6-Week Change in Strength Index: | -11.2 | -1.9 | 31.5 |
10-Year Treasury Note Futures:
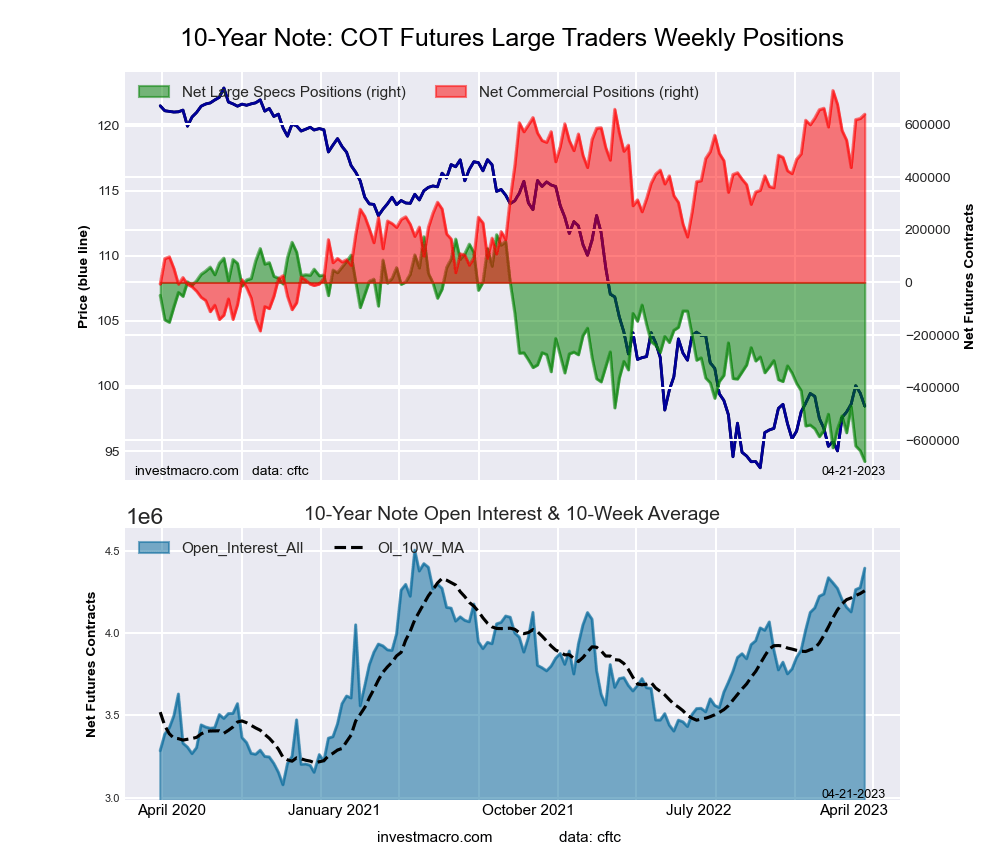 The 10-Year Treasury Note large speculator standing this week reached a net position of -680,081 contracts in the data reported through Tuesday. This was a weekly lowering of -41,044 contracts from the previous week which had a total of -639,037 net contracts.
This week’s current strength score (the trader positioning range over the past three years, measured from 0 to 100) shows the speculators are currently Bearish-Extreme with a score of 0.0 percent. The commercials are Bullish-Extreme with a score of 90.1 percent and the small traders (not shown in chart) are Bullish-Extreme with a score of 93.5 percent.
| 10-Year Treasury Note Statistics | SPECULATORS | COMMERCIALS | SMALL TRADERS |
| – Percent of Open Interest Longs: | 10.8 | 78.3 | 9.0 |
| – Percent of Open Interest Shorts: | 26.2 | 63.7 | 8.1 |
| – Net Position: | -680,081 | 638,740 | 41,341 |
| – Gross Longs: | 473,072 | 3,439,022 | 395,955 |
| – Gross Shorts: | 1,153,153 | 2,800,282 | 354,614 |
| – Long to Short Ratio: | 0.4 to 1 | 1.2 to 1 | 1.1 to 1 |
| NET POSITION TREND: | |||
| – Strength Index Score (3 Year Range Pct): | 0.0 | 90.1 | 93.5 |
| – Strength Index Reading (3 Year Range): | Bearish-Extreme | Bullish-Extreme | Bullish-Extreme |
| NET POSITION MOVEMENT INDEX: | |||
| – 6-Week Change in Strength Index: | -14.4 | -4.1 | 39.9 |
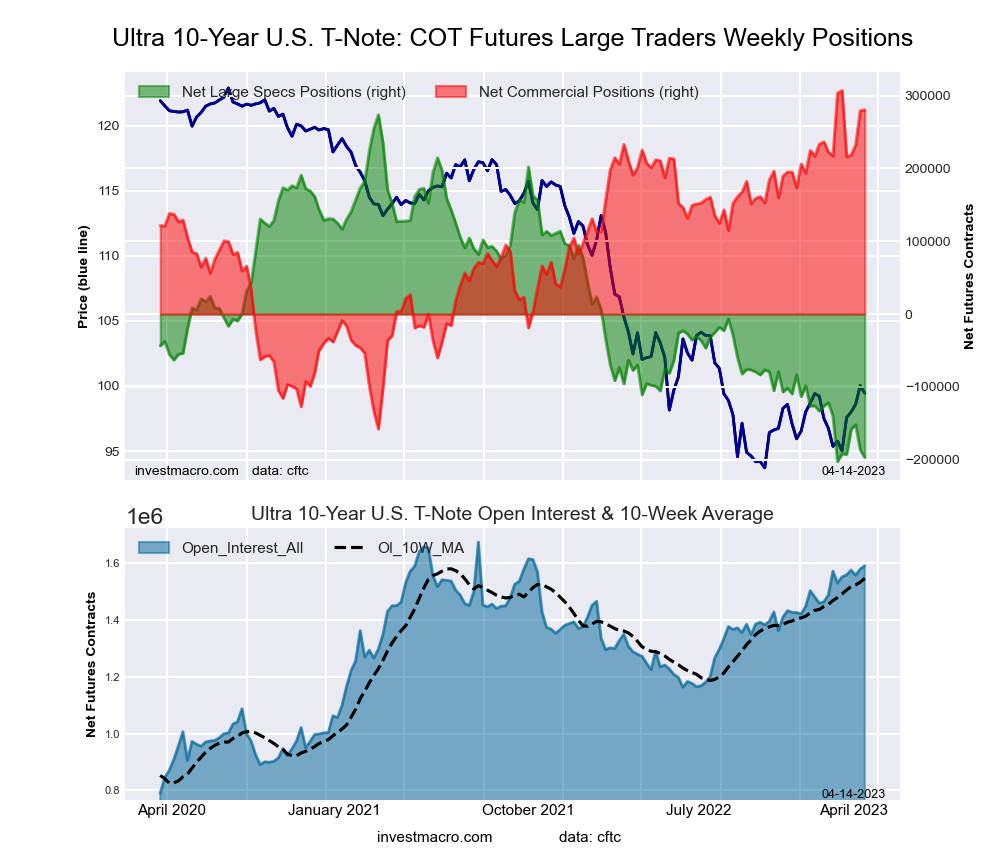
Ultra 10-Year Notes Futures:
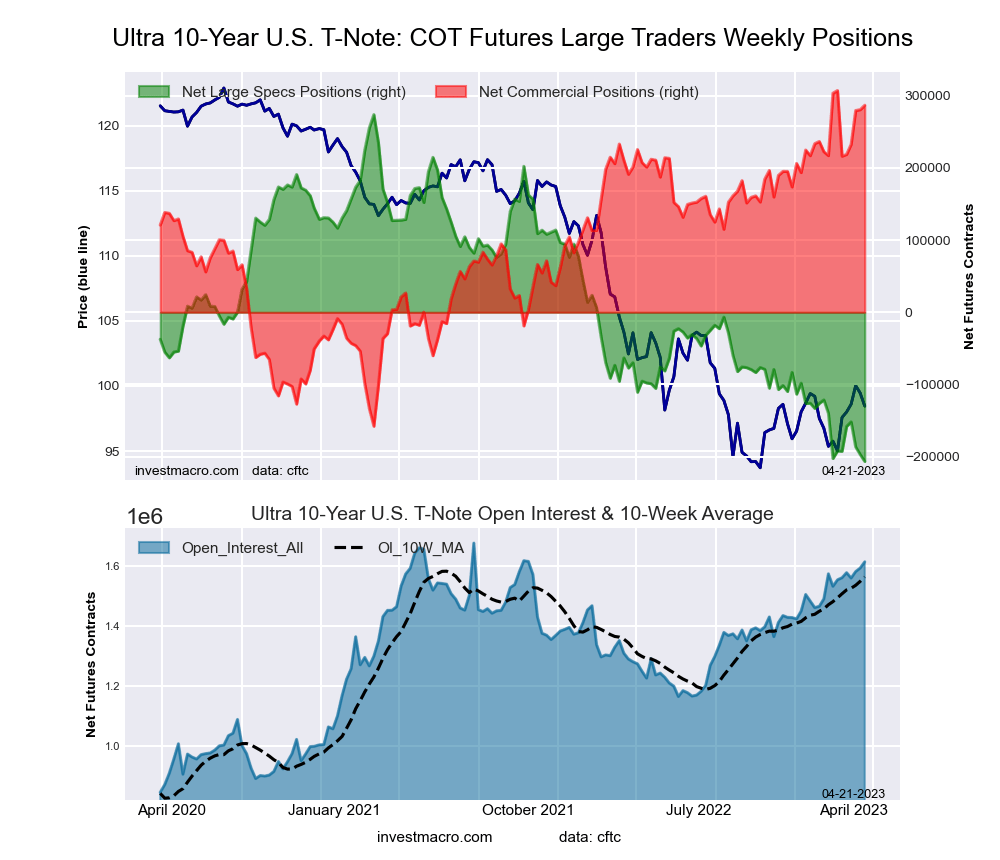 The Ultra 10-Year Notes large speculator standing this week reached a net position of -206,583 contracts in the data reported through Tuesday. This was a weekly lowering of -9,612 contracts from the previous week which had a total of -196,971 net contracts.
This week’s current strength score (the trader positioning range over the past three years, measured from 0 to 100) shows the speculators are currently Bearish-Extreme with a score of 0.0 percent. The commercials are Bullish-Extreme with a score of 95.6 percent and the small traders (not shown in chart) are Bullish with a score of 66.5 percent.
| Ultra 10-Year Notes Statistics | SPECULATORS | COMMERCIALS | SMALL TRADERS |
| – Percent of Open Interest Longs: | 8.7 | 79.8 | 10.3 |
| – Percent of Open Interest Shorts: | 21.5 | 62.0 | 15.3 |
| – Net Position: | -206,583 | 286,593 | -80,010 |
| – Gross Longs: | 140,107 | 1,286,225 | 166,166 |
| – Gross Shorts: | 346,690 | 999,632 | 246,176 |
| – Long to Short Ratio: | 0.4 to 1 | 1.3 to 1 | 0.7 to 1 |
| NET POSITION TREND: | |||
| – Strength Index Score (3 Year Range Pct): | 0.0 | 95.6 | 66.5 |
| – Strength Index Reading (3 Year Range): | Bearish-Extreme | Bullish-Extreme | Bullish |
| NET POSITION MOVEMENT INDEX: | |||
| – 6-Week Change in Strength Index: | -3.0 | -4.4 | 20.7 |
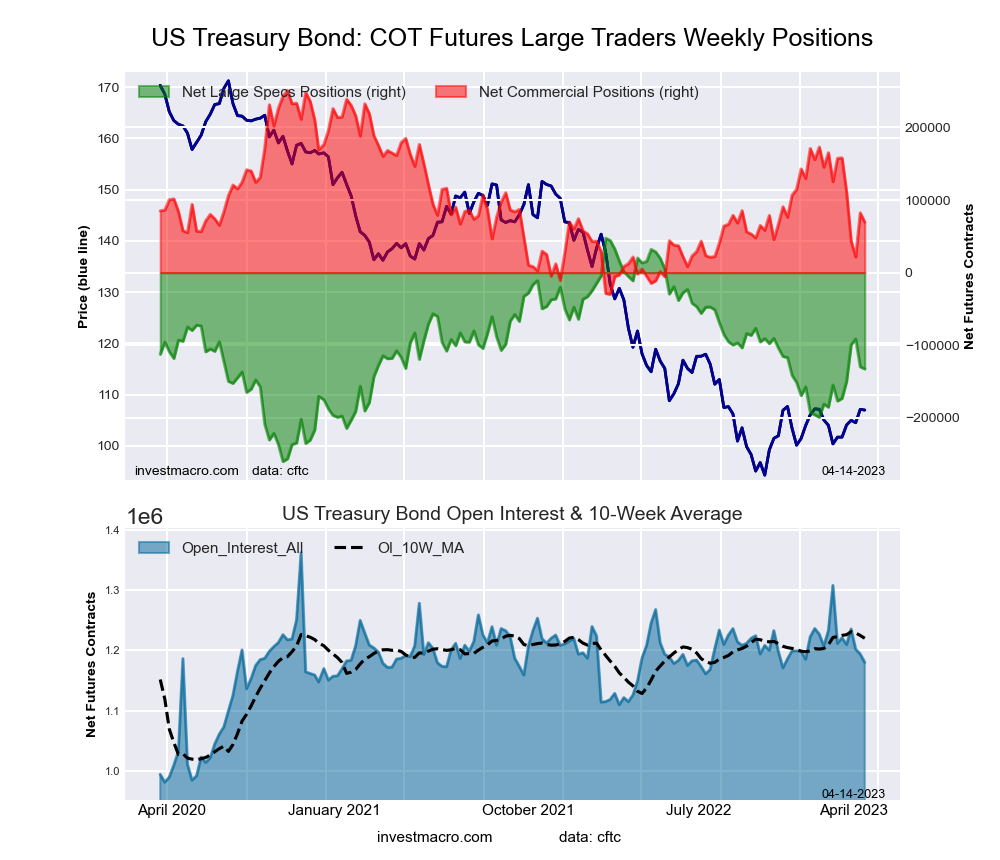
US Treasury Bonds Futures:
 The US Treasury Bonds large speculator standing this week reached a net position of -116,928 contracts in the data reported through Tuesday. This was a weekly boost of 15,656 contracts from the previous week which had a total of -132,584 net contracts.
This week’s current strength score (the trader positioning range over the past three years, measured from 0 to 100) shows the speculators are currently Bearish with a score of 46.5 percent. The commercials are Bearish with a score of 27.1 percent and the small traders (not shown in chart) are Bullish-Extreme with a score of 100.0 percent.
| US Treasury Bonds Statistics | SPECULATORS | COMMERCIALS | SMALL TRADERS |
| – Percent of Open Interest Longs: | 5.8 | 79.0 | 14.8 |
| – Percent of Open Interest Shorts: | 15.7 | 75.1 | 8.9 |
| – Net Position: | -116,928 | 46,235 | 70,693 |
| – Gross Longs: | 69,031 | 936,757 | 175,995 |
| – Gross Shorts: | 185,959 | 890,522 | 105,302 |
| – Long to Short Ratio: | 0.4 to 1 | 1.1 to 1 | 1.7 to 1 |
| NET POSITION TREND: | |||
| – Strength Index Score (3 Year Range Pct): | 46.5 | 27.1 | 100.0 |
| – Strength Index Reading (3 Year Range): | Bearish | Bearish | Bullish-Extreme |
| NET POSITION MOVEMENT INDEX: | |||
| – 6-Week Change in Strength Index: | 18.3 | -39.8 | 40.5 |
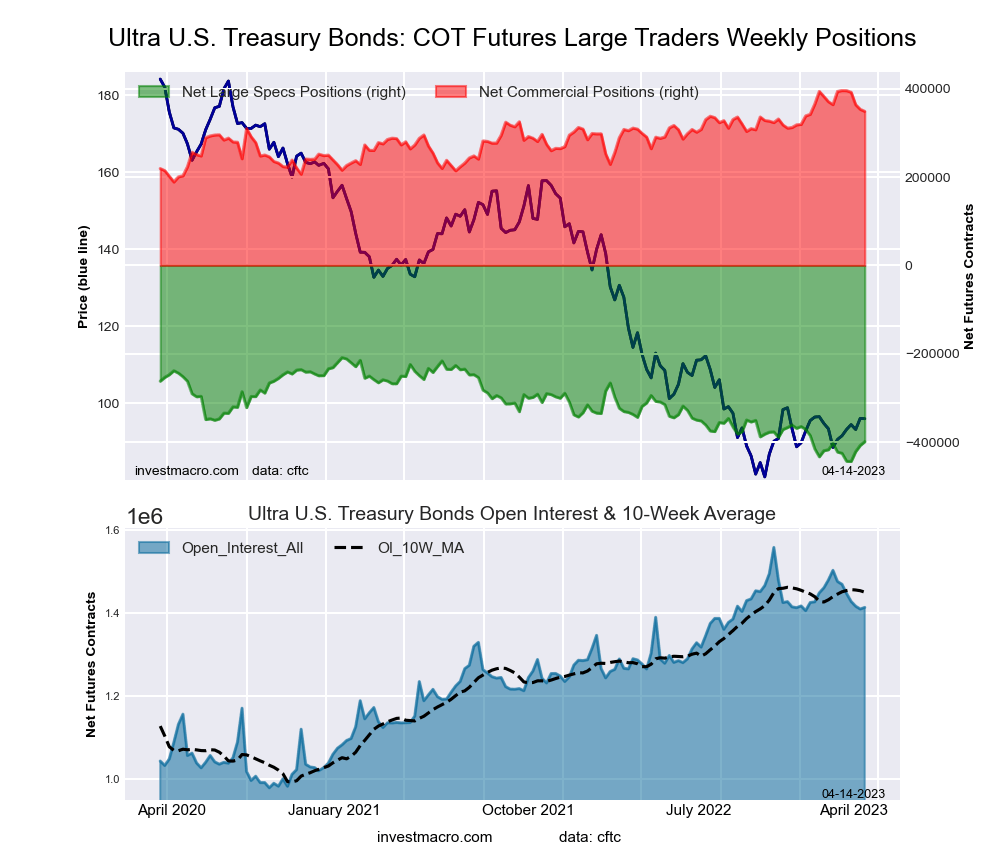
Ultra US Treasury Bonds Futures:
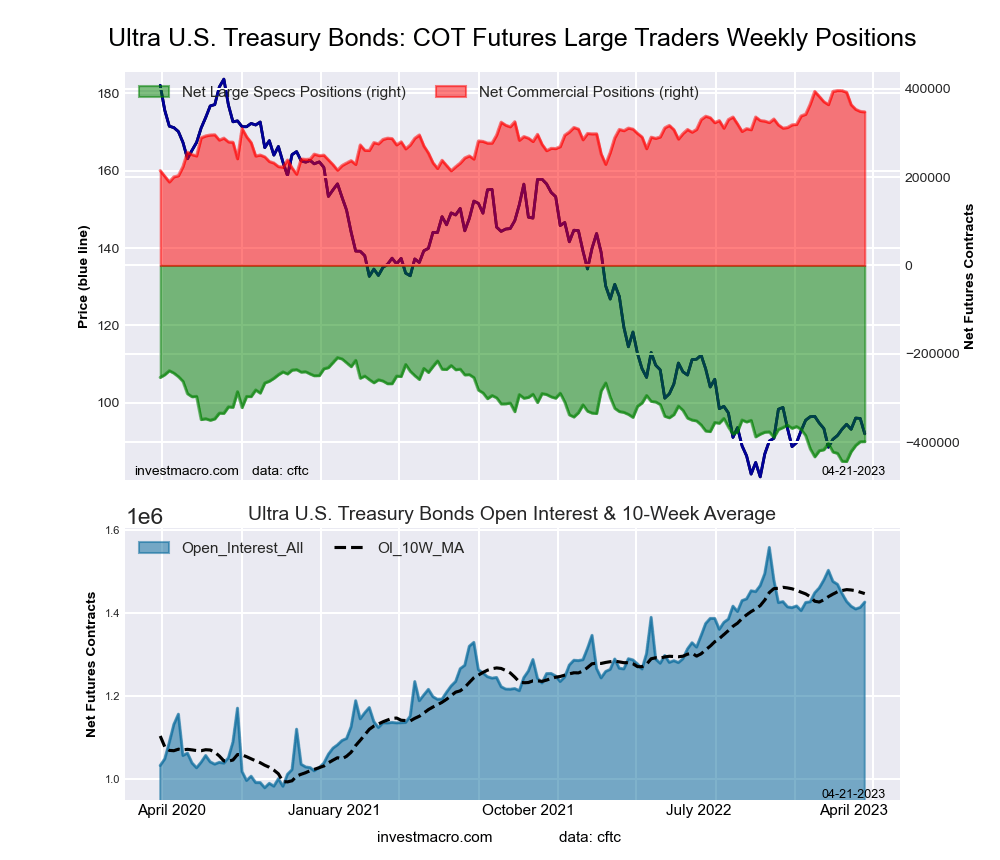 The Ultra US Treasury Bonds large speculator standing this week reached a net position of -399,001 contracts in the data reported through Tuesday. This was a weekly gain of 277 contracts from the previous week which had a total of -399,278 net contracts.
This week’s current strength score (the trader positioning range over the past three years, measured from 0 to 100) shows the speculators are currently Bearish-Extreme with a score of 19.1 percent. The commercials are Bullish with a score of 76.7 percent and the small traders (not shown in chart) are Bullish-Extreme with a score of 91.3 percent.
| Ultra US Treasury Bonds Statistics | SPECULATORS | COMMERCIALS | SMALL TRADERS |
| – Percent of Open Interest Longs: | 5.5 | 82.5 | 11.9 |
| – Percent of Open Interest Shorts: | 33.5 | 58.1 | 8.3 |
| – Net Position: | -399,001 | 347,521 | 51,480 |
| – Gross Longs: | 78,030 | 1,176,217 | 169,143 |
| – Gross Shorts: | 477,031 | 828,696 | 117,663 |
| – Long to Short Ratio: | 0.2 to 1 | 1.4 to 1 | 1.4 to 1 |
| NET POSITION TREND: | |||
| – Strength Index Score (3 Year Range Pct): | 19.1 | 76.7 | 91.3 |
| – Strength Index Reading (3 Year Range): | Bearish-Extreme | Bullish | Bullish-Extreme |
| NET POSITION MOVEMENT INDEX: | |||
| – 6-Week Change in Strength Index: | 11.3 | -23.3 | 21.9 |
Article By InvestMacro – Receive our weekly COT Newsletter
*COT Report: The COT data, released weekly to the public each Friday, is updated through the most recent Tuesday (data is 3 days old) and shows a quick view of how large speculators or non-commercials (for-profit traders) were positioned in the futures markets.
The CFTC categorizes trader positions according to commercial hedgers (traders who use futures contracts for hedging as part of the business), non-commercials (large traders who speculate to realize trading profits) and nonreportable traders (usually small traders/speculators) as well as their open interest (contracts open in the market at time of reporting). See CFTC criteria here.


