
By InvestMacro
Here are the latest charts and statistics for the Commitment of Traders (COT) reports data published by the Commodities Futures Trading Commission (CFTC).
The latest COT data is updated through Tuesday April 25th and shows a quick view of how large traders (for-profit speculators and commercial entities) were positioned in the futures markets.
Weekly Speculator Changes led by Cocoa & Sugar
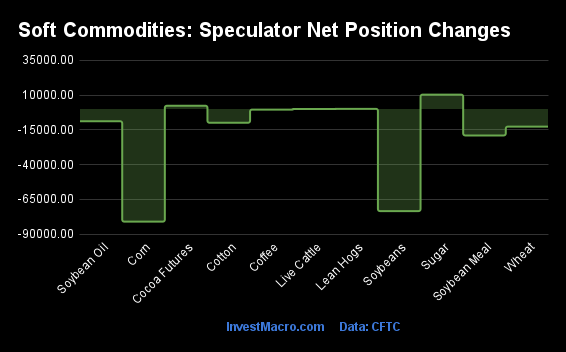
The COT soft commodities markets speculator bets were lower this week as three out of the eleven softs markets we cover had higher positioning while the other eight markets had lower speculator contracts.
Free Reports:
 Get our Weekly Commitment of Traders Reports - See where the biggest traders (Hedge Funds and Commercial Hedgers) are positioned in the futures markets on a weekly basis.
 Download Our Metatrader 4 Indicators – Put Our Free MetaTrader 4 Custom Indicators on your charts when you join our Weekly Newsletter
Leading the gains for the softs markets was Sugar (10,356 contracts) with Cocoa (2,359 contracts) and Lean Hogs (135 contracts) also showing positive weeks.
The markets with the declines in speculator bets this week were Corn (-80,988 contracts), Soybeans (-73,414 contracts), Wheat (-12,652 contracts), Soybean Meal (-19,017 contracts), Cotton (-9,883 contracts), Soybean Oil (-8,806 contracts), Coffee (-409 contracts) and Live Cattle (-38 contracts).
Cocoa bullish bets hit highest since March 2020
Highlighting the COT soft commodities data this week is the multi-year high in bullish bets of the Cocoa speculator’s positioning. The large speculator bets for Cocoa rose this week for the first time in the past four weeks but the boost pushed the overall net position to its highest level since 2020. This week’s gain brought the Cocoa speculator net position to a total of +61,714 contracts which marks the most bullish level of the past 164 weeks, dating back to March 10th of 2020.
Cocoa trader sentiment and futures prices have been pushed higher recently due to increased demand and because of supply issues arising out of Africa. Nigeria’s exports as well as the Ivory Coast’s exports have been on the decline while dryer weather conditions have also hampered production on the continent. Meanwhile, the demand for Cocoa is being forecast to grow approximately 5 percent annually for the next decade.
The Cocoa futures price fell modestly this week but has been on a strong bullish trend since hitting a recent low in September. Last week, the futures price hit its highest level since 2016 right around the 2995 price before retreating this week to 2937.
| Apr-25-2023 | OI | OI-Index | Spec-Net | Spec-Index | Com-Net | COM-Index | Smalls-Net | Smalls-Index |
|---|---|---|---|---|---|---|---|---|
| WTI Crude | 1,826,195 | 38 | 236,438 | 20 | -271,197 | 79 | 34,759 | 53 |
| Gold | 473,209 | 24 | 185,264 | 59 | -211,928 | 42 | 26,664 | 47 |
| Silver | 149,692 | 37 | 30,603 | 62 | -41,523 | 44 | 10,920 | 27 |
| Copper | 202,422 | 44 | -17,042 | 13 | 8,304 | 80 | 8,738 | 74 |
| Palladium | 12,270 | 88 | -5,877 | 11 | 6,309 | 90 | -432 | 16 |
| Platinum | 72,125 | 79 | 29,617 | 84 | -34,316 | 23 | 4,699 | 31 |
| Natural Gas | 1,274,536 | 63 | -136,150 | 18 | 105,774 | 82 | 30,376 | 52 |
| Brent | 140,321 | 6 | -40,564 | 26 | 36,713 | 73 | 3,851 | 61 |
| Heating Oil | 268,225 | 23 | 7,593 | 40 | -16,018 | 81 | 8,425 | 28 |
| Soybeans | 630,935 | 12 | 104,096 | 30 | -76,491 | 70 | -27,605 | 26 |
| Corn | 1,242,943 | 7 | 24,648 | 33 | 34,700 | 77 | -59,348 | 18 |
| Coffee | 192,927 | 7 | 36,592 | 65 | -37,705 | 38 | 1,113 | 26 |
| Sugar | 959,708 | 61 | 279,528 | 90 | -335,640 | 7 | 56,112 | 76 |
| Wheat | 366,390 | 47 | -83,188 | 0 | 75,369 | 100 | 7,819 | 100 |
Strength Scores led by Cocoa & Live Cattle
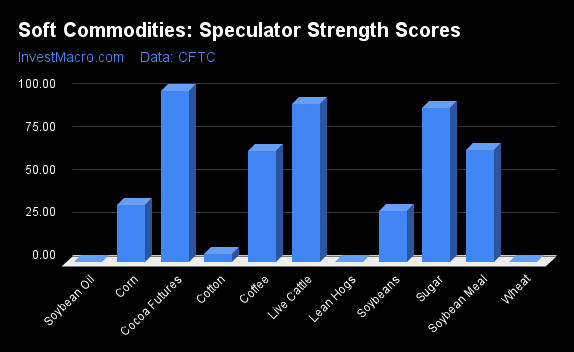
COT Strength Scores (a normalized measure of Speculator positions over a 3-Year range, from 0 to 100 where above 80 is Extreme-Bullish and below 20 is Extreme-Bearish) showed that Cocoa (100 percent) and Live Cattle (93 percent) lead the softs markets this week. Sugar (90 percent), Soybean Meal (66 percent) and Coffee (65 percent) come in as the next highest in the weekly strength scores.
On the downside, Lean Hogs (0 percent), Soybean Oil (0 percent), Wheat (0 percent) and the Cotton (5 percent) come in at the lowest strength levels currently and are in Extreme-Bearish territory (below 20 percent).
Strength Statistics:
Corn (33.2 percent) vs Corn previous week (43.5 percent)
Sugar (89.8 percent) vs Sugar previous week (86.1 percent)
Coffee (64.9 percent) vs Coffee previous week (65.4 percent)
Soybeans (30.1 percent) vs Soybeans previous week (58.9 percent)
Soybean Oil (0.0 percent) vs Soybean Oil previous week (5.5 percent)
Soybean Meal (65.7 percent) vs Soybean Meal previous week (75.6 percent)
Live Cattle (92.5 percent) vs Live Cattle previous week (92.5 percent)
Lean Hogs (0.1 percent) vs Lean Hogs previous week (0.0 percent)
Cotton (4.6 percent) vs Cotton previous week (12.1 percent)
Cocoa (100.0 percent) vs Cocoa previous week (97.0 percent)
Wheat (0.0 percent) vs Wheat previous week (9.7 percent)
Cocoa & Coffee top the 6-Week Strength Trends
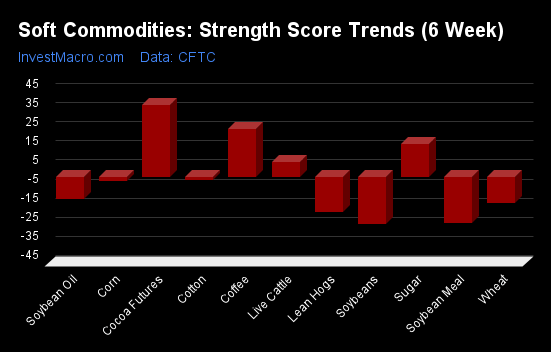
COT Strength Score Trends (or move index, calculates the 6-week changes in strength scores) showed that Cocoa (38 percent) and Coffee (25 percent) lead the past six weeks trends for soft commodities. Sugar (17 percent) and Live Cattle (7 percent) are the next highest positive movers in the latest trends data.
Soybeans (-25 percent) leads the downside trend scores currently with Soybean Meal (-24 percent), Lean Hogs (-19 percent) and Wheat (-14 percent) following next with lower trend scores.
Strength Trend Statistics:
Corn (-2.4 percent) vs Corn previous week (0.3 percent)
Sugar (17.1 percent) vs Sugar previous week (10.1 percent)
Coffee (24.9 percent) vs Coffee previous week (22.5 percent)
Soybeans (-25.1 percent) vs Soybeans previous week (-1.1 percent)
Soybean Oil (-12.0 percent) vs Soybean Oil previous week (-19.5 percent)
Soybean Meal (-24.2 percent) vs Soybean Meal previous week (-24.4 percent)
Live Cattle (7.4 percent) vs Live Cattle previous week (-7.5 percent)
Lean Hogs (-18.9 percent) vs Lean Hogs previous week (-17.5 percent)
Cotton (-2.0 percent) vs Cotton previous week (-1.1 percent)
Cocoa (37.7 percent) vs Cocoa previous week (5.9 percent)
Wheat (-13.8 percent) vs Wheat previous week (2.1 percent)
Individual Soft Commodities Markets:
CORN Futures:
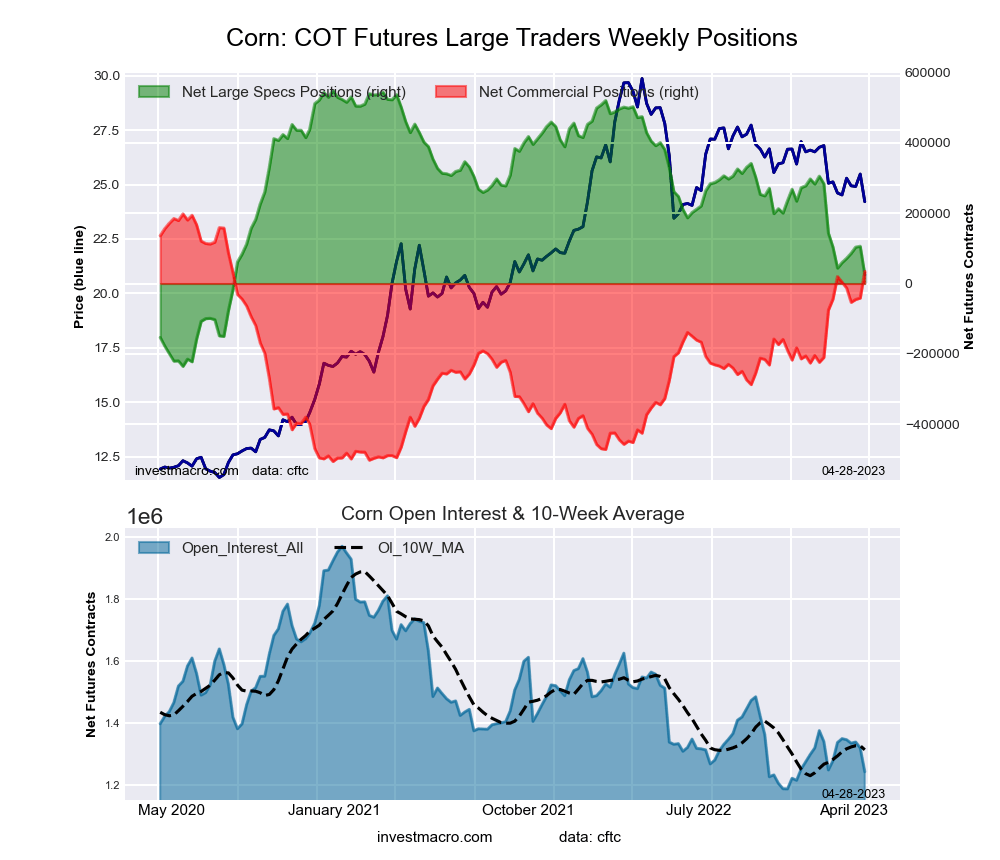 The CORN large speculator standing this week was a net position of 24,648 contracts in the data reported through Tuesday. This was a weekly lowering of -80,988 contracts from the previous week which had a total of 105,636 net contracts.
This week’s current strength score (the trader positioning range over the past three years, measured from 0 to 100) shows the speculators are currently Bearish with a score of 33.2 percent. The commercials are Bullish with a score of 76.8 percent and the small traders (not shown in chart) are Bearish-Extreme with a score of 17.9 percent.
| CORN Futures Statistics | SPECULATORS | COMMERCIALS | SMALL TRADERS |
| – Percent of Open Interest Longs: | 23.9 | 51.8 | 8.8 |
| – Percent of Open Interest Shorts: | 21.9 | 49.0 | 13.5 |
| – Net Position: | 24,648 | 34,700 | -59,348 |
| – Gross Longs: | 297,251 | 644,207 | 109,017 |
| – Gross Shorts: | 272,603 | 609,507 | 168,365 |
| – Long to Short Ratio: | 1.1 to 1 | 1.1 to 1 | 0.6 to 1 |
| NET POSITION TREND: | |||
| – Strength Index Score (3 Year Range Pct): | 33.2 | 76.8 | 17.9 |
| – Strength Index Reading (3 Year Range): | Bearish | Bullish | Bearish-Extreme |
| NET POSITION MOVEMENT INDEX: | |||
| – 6-Week Change in Strength Index: | -2.4 | 2.1 | 3.4 |
SUGAR Futures:
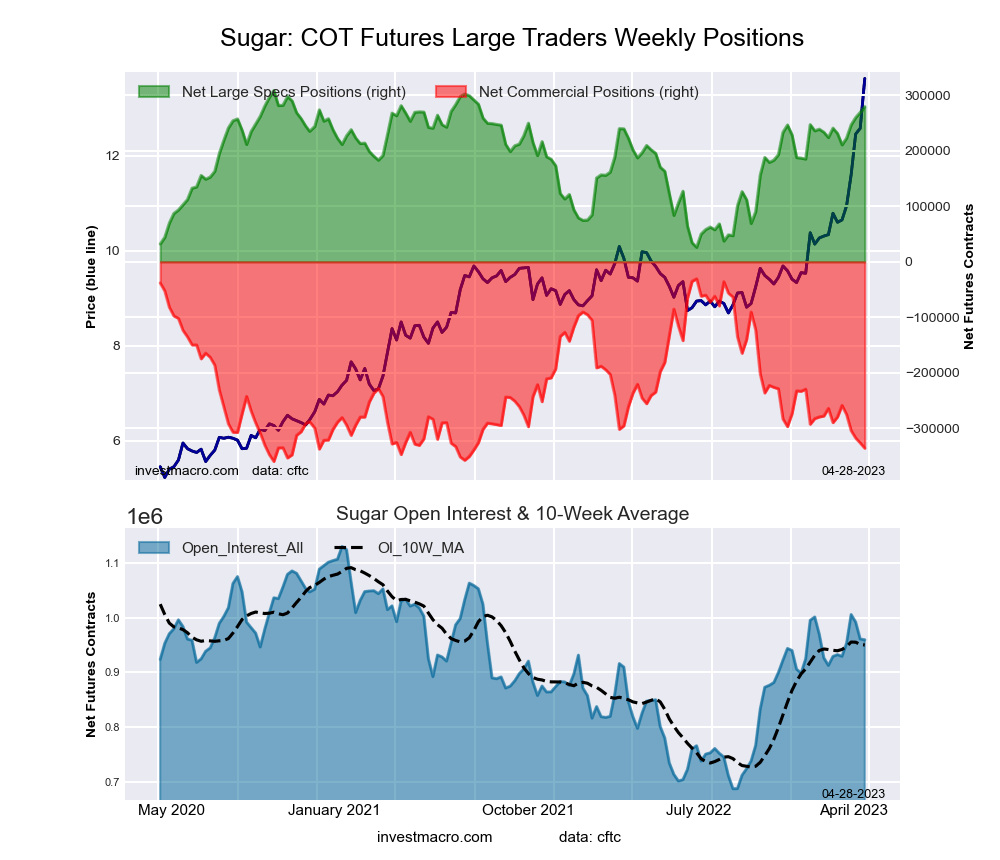 The SUGAR large speculator standing this week was a net position of 279,528 contracts in the data reported through Tuesday. This was a weekly gain of 10,356 contracts from the previous week which had a total of 269,172 net contracts.
This week’s current strength score (the trader positioning range over the past three years, measured from 0 to 100) shows the speculators are currently Bullish-Extreme with a score of 89.8 percent. The commercials are Bearish-Extreme with a score of 7.3 percent and the small traders (not shown in chart) are Bullish with a score of 75.8 percent.
| SUGAR Futures Statistics | SPECULATORS | COMMERCIALS | SMALL TRADERS |
| – Percent of Open Interest Longs: | 36.9 | 39.5 | 10.6 |
| – Percent of Open Interest Shorts: | 7.8 | 74.5 | 4.8 |
| – Net Position: | 279,528 | -335,640 | 56,112 |
| – Gross Longs: | 354,581 | 379,027 | 101,894 |
| – Gross Shorts: | 75,053 | 714,667 | 45,782 |
| – Long to Short Ratio: | 4.7 to 1 | 0.5 to 1 | 2.2 to 1 |
| NET POSITION TREND: | |||
| – Strength Index Score (3 Year Range Pct): | 89.8 | 7.3 | 75.8 |
| – Strength Index Reading (3 Year Range): | Bullish-Extreme | Bearish-Extreme | Bullish |
| NET POSITION MOVEMENT INDEX: | |||
| – 6-Week Change in Strength Index: | 17.1 | -17.1 | 10.3 |
COFFEE Futures:
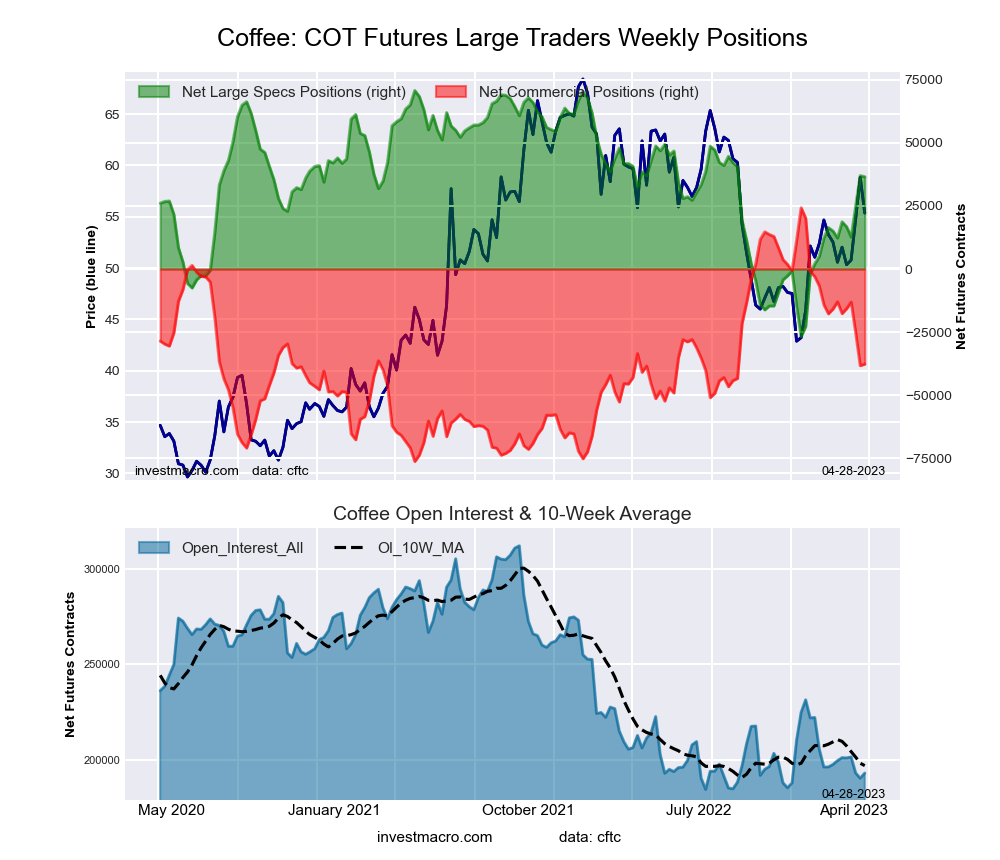 The COFFEE large speculator standing this week was a net position of 36,592 contracts in the data reported through Tuesday. This was a weekly lowering of -409 contracts from the previous week which had a total of 37,001 net contracts.
This week’s current strength score (the trader positioning range over the past three years, measured from 0 to 100) shows the speculators are currently Bullish with a score of 64.9 percent. The commercials are Bearish with a score of 38.4 percent and the small traders (not shown in chart) are Bearish with a score of 26.1 percent.
| COFFEE Futures Statistics | SPECULATORS | COMMERCIALS | SMALL TRADERS |
| – Percent of Open Interest Longs: | 30.2 | 42.3 | 3.8 |
| – Percent of Open Interest Shorts: | 11.2 | 61.9 | 3.3 |
| – Net Position: | 36,592 | -37,705 | 1,113 |
| – Gross Longs: | 58,266 | 81,704 | 7,412 |
| – Gross Shorts: | 21,674 | 119,409 | 6,299 |
| – Long to Short Ratio: | 2.7 to 1 | 0.7 to 1 | 1.2 to 1 |
| NET POSITION TREND: | |||
| – Strength Index Score (3 Year Range Pct): | 64.9 | 38.4 | 26.1 |
| – Strength Index Reading (3 Year Range): | Bullish | Bearish | Bearish |
| NET POSITION MOVEMENT INDEX: | |||
| – 6-Week Change in Strength Index: | 24.9 | -24.6 | 5.1 |
SOYBEANS Futures:
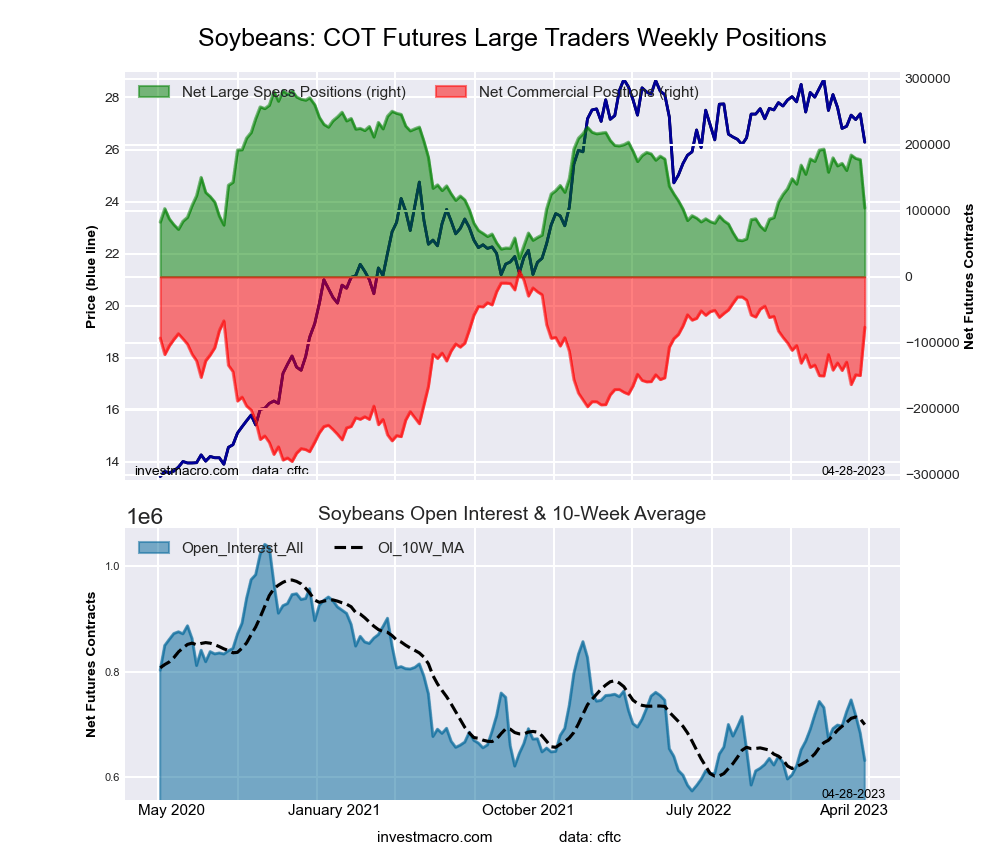 The SOYBEANS large speculator standing this week was a net position of 104,096 contracts in the data reported through Tuesday. This was a weekly reduction of -73,414 contracts from the previous week which had a total of 177,510 net contracts.
This week’s current strength score (the trader positioning range over the past three years, measured from 0 to 100) shows the speculators are currently Bearish with a score of 30.1 percent. The commercials are Bullish with a score of 70.4 percent and the small traders (not shown in chart) are Bearish with a score of 25.8 percent.
| SOYBEANS Futures Statistics | SPECULATORS | COMMERCIALS | SMALL TRADERS |
| – Percent of Open Interest Longs: | 25.4 | 49.0 | 7.1 |
| – Percent of Open Interest Shorts: | 8.9 | 61.1 | 11.5 |
| – Net Position: | 104,096 | -76,491 | -27,605 |
| – Gross Longs: | 160,083 | 309,256 | 45,031 |
| – Gross Shorts: | 55,987 | 385,747 | 72,636 |
| – Long to Short Ratio: | 2.9 to 1 | 0.8 to 1 | 0.6 to 1 |
| NET POSITION TREND: | |||
| – Strength Index Score (3 Year Range Pct): | 30.1 | 70.4 | 25.8 |
| – Strength Index Reading (3 Year Range): | Bearish | Bullish | Bearish |
| NET POSITION MOVEMENT INDEX: | |||
| – 6-Week Change in Strength Index: | -25.1 | 18.7 | 16.5 |
SOYBEAN OIL Futures:
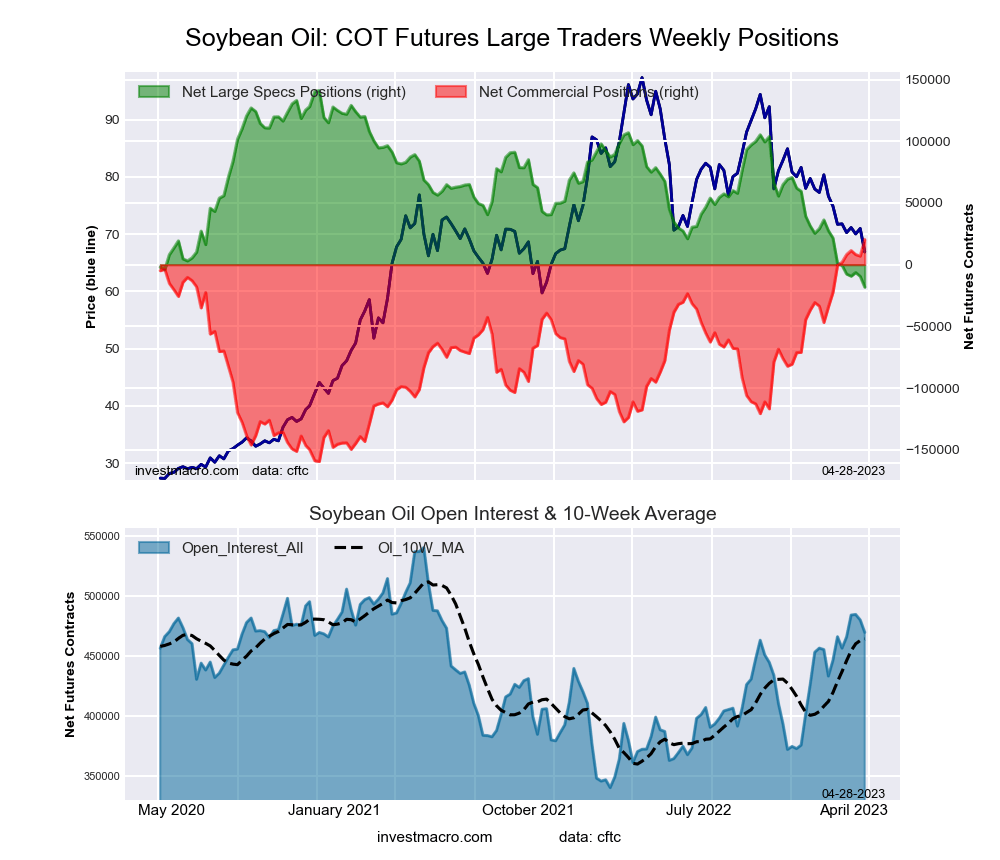 The SOYBEAN OIL large speculator standing this week was a net position of -18,257 contracts in the data reported through Tuesday. This was a weekly decrease of -8,806 contracts from the previous week which had a total of -9,451 net contracts.
This week’s current strength score (the trader positioning range over the past three years, measured from 0 to 100) shows the speculators are currently Bearish-Extreme with a score of 0.0 percent. The commercials are Bullish-Extreme with a score of 100.0 percent and the small traders (not shown in chart) are Bearish-Extreme with a score of 0.0 percent.
| SOYBEAN OIL Futures Statistics | SPECULATORS | COMMERCIALS | SMALL TRADERS |
| – Percent of Open Interest Longs: | 15.7 | 59.8 | 6.3 |
| – Percent of Open Interest Shorts: | 19.6 | 55.4 | 6.8 |
| – Net Position: | -18,257 | 20,425 | -2,168 |
| – Gross Longs: | 73,661 | 280,735 | 29,738 |
| – Gross Shorts: | 91,918 | 260,310 | 31,906 |
| – Long to Short Ratio: | 0.8 to 1 | 1.1 to 1 | 0.9 to 1 |
| NET POSITION TREND: | |||
| – Strength Index Score (3 Year Range Pct): | 0.0 | 100.0 | 0.0 |
| – Strength Index Reading (3 Year Range): | Bearish-Extreme | Bullish-Extreme | Bearish-Extreme |
| NET POSITION MOVEMENT INDEX: | |||
| – 6-Week Change in Strength Index: | -12.0 | 11.6 | -7.0 |
SOYBEAN MEAL Futures:
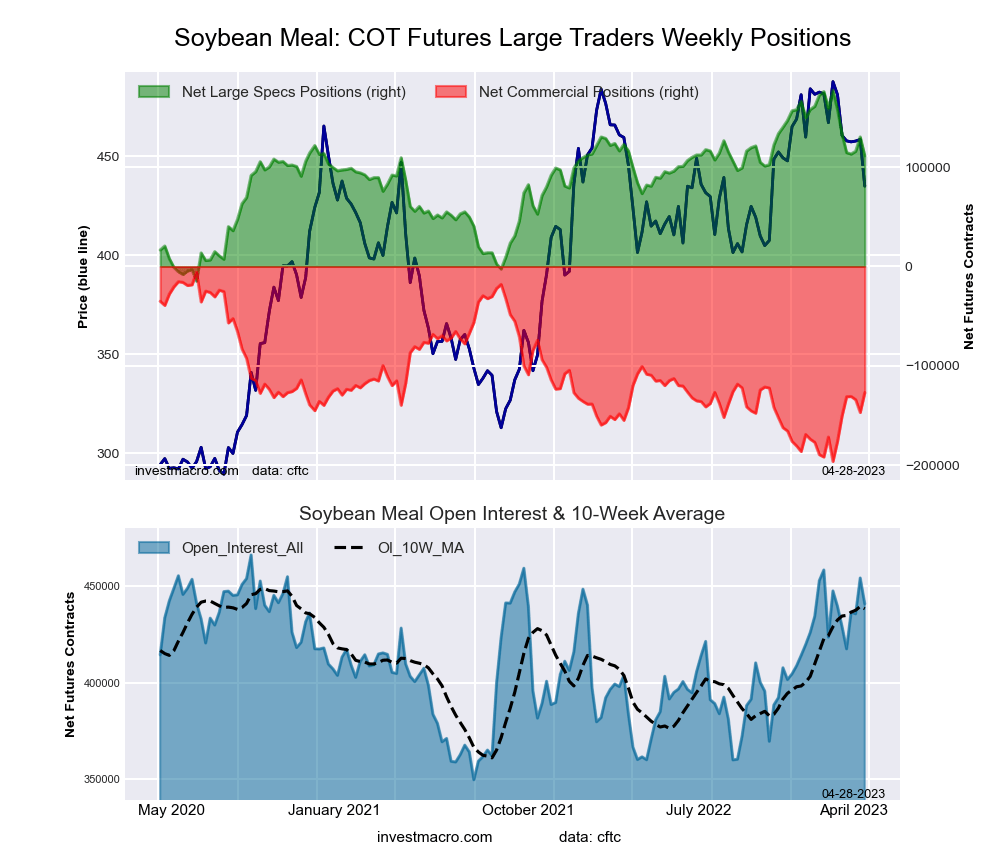 The SOYBEAN MEAL large speculator standing this week was a net position of 111,252 contracts in the data reported through Tuesday. This was a weekly decline of -19,017 contracts from the previous week which had a total of 130,269 net contracts.
This week’s current strength score (the trader positioning range over the past three years, measured from 0 to 100) shows the speculators are currently Bullish with a score of 65.7 percent. The commercials are Bearish with a score of 36.4 percent and the small traders (not shown in chart) are Bearish-Extreme with a score of 16.5 percent.
| SOYBEAN MEAL Futures Statistics | SPECULATORS | COMMERCIALS | SMALL TRADERS |
| – Percent of Open Interest Longs: | 31.6 | 39.0 | 10.1 |
| – Percent of Open Interest Shorts: | 6.3 | 67.8 | 6.6 |
| – Net Position: | 111,252 | -126,822 | 15,570 |
| – Gross Longs: | 139,164 | 171,929 | 44,665 |
| – Gross Shorts: | 27,912 | 298,751 | 29,095 |
| – Long to Short Ratio: | 5.0 to 1 | 0.6 to 1 | 1.5 to 1 |
| NET POSITION TREND: | |||
| – Strength Index Score (3 Year Range Pct): | 65.7 | 36.4 | 16.5 |
| – Strength Index Reading (3 Year Range): | Bullish | Bearish | Bearish-Extreme |
| NET POSITION MOVEMENT INDEX: | |||
| – 6-Week Change in Strength Index: | -24.2 | 25.9 | -13.9 |
LIVE CATTLE Futures:
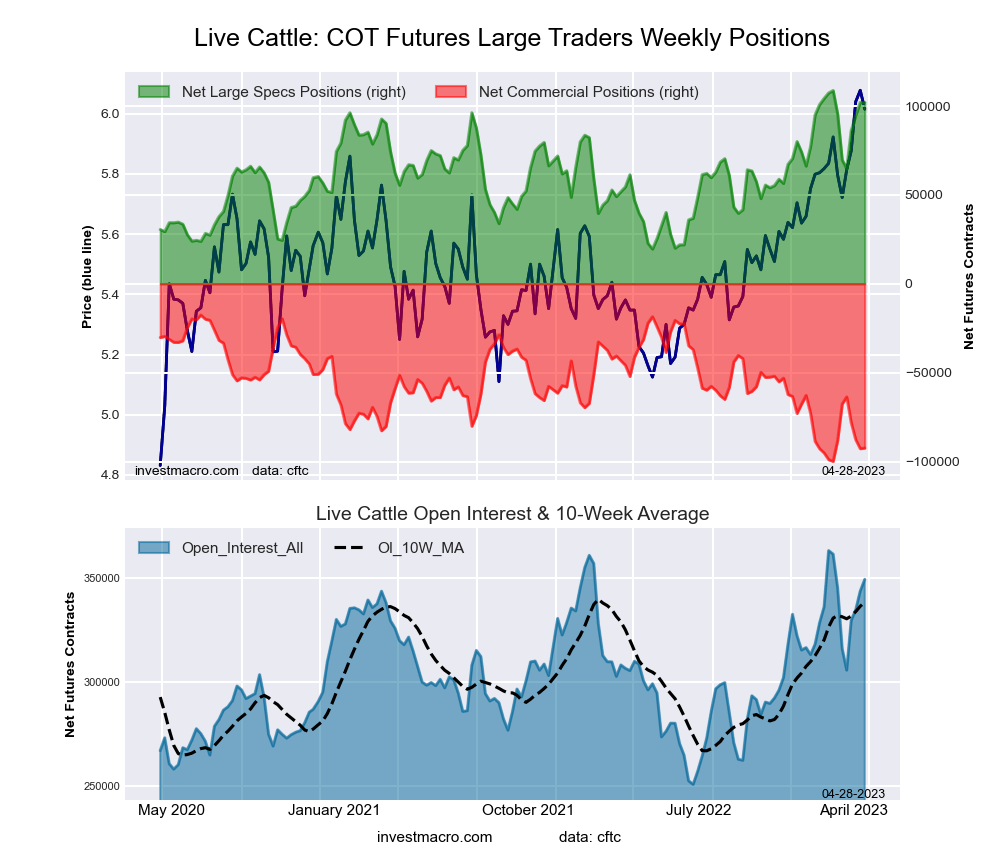 The LIVE CATTLE large speculator standing this week was a net position of 102,034 contracts in the data reported through Tuesday. This was a weekly decline of -38 contracts from the previous week which had a total of 102,072 net contracts.
This week’s current strength score (the trader positioning range over the past three years, measured from 0 to 100) shows the speculators are currently Bullish-Extreme with a score of 92.5 percent. The commercials are Bearish-Extreme with a score of 9.1 percent and the small traders (not shown in chart) are Bearish with a score of 36.1 percent.
| LIVE CATTLE Futures Statistics | SPECULATORS | COMMERCIALS | SMALL TRADERS |
| – Percent of Open Interest Longs: | 44.9 | 25.3 | 9.7 |
| – Percent of Open Interest Shorts: | 15.7 | 51.7 | 12.4 |
| – Net Position: | 102,034 | -92,450 | -9,584 |
| – Gross Longs: | 156,838 | 88,281 | 33,814 |
| – Gross Shorts: | 54,804 | 180,731 | 43,398 |
| – Long to Short Ratio: | 2.9 to 1 | 0.5 to 1 | 0.8 to 1 |
| NET POSITION TREND: | |||
| – Strength Index Score (3 Year Range Pct): | 92.5 | 9.1 | 36.1 |
| – Strength Index Reading (3 Year Range): | Bullish-Extreme | Bearish-Extreme | Bearish |
| NET POSITION MOVEMENT INDEX: | |||
| – 6-Week Change in Strength Index: | 7.4 | -5.3 | -12.4 |
LEAN HOGS Futures:
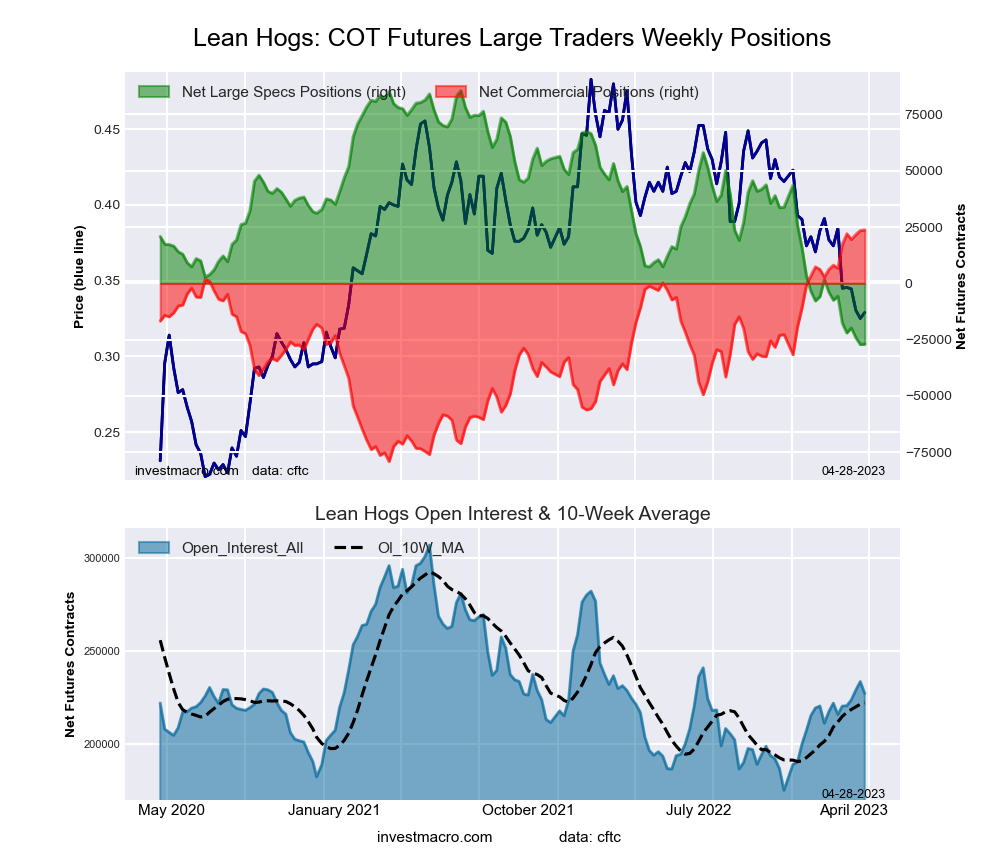 The LEAN HOGS large speculator standing this week was a net position of -27,022 contracts in the data reported through Tuesday. This was a weekly rise of 135 contracts from the previous week which had a total of -27,157 net contracts.
This week’s current strength score (the trader positioning range over the past three years, measured from 0 to 100) shows the speculators are currently Bearish-Extreme with a score of 0.1 percent. The commercials are Bullish-Extreme with a score of 100.0 percent and the small traders (not shown in chart) are Bullish-Extreme with a score of 98.3 percent.
| LEAN HOGS Futures Statistics | SPECULATORS | COMMERCIALS | SMALL TRADERS |
| – Percent of Open Interest Longs: | 26.6 | 37.3 | 12.4 |
| – Percent of Open Interest Shorts: | 38.5 | 26.9 | 10.9 |
| – Net Position: | -27,022 | 23,686 | 3,336 |
| – Gross Longs: | 60,383 | 84,742 | 28,143 |
| – Gross Shorts: | 87,405 | 61,056 | 24,807 |
| – Long to Short Ratio: | 0.7 to 1 | 1.4 to 1 | 1.1 to 1 |
| NET POSITION TREND: | |||
| – Strength Index Score (3 Year Range Pct): | 0.1 | 100.0 | 98.3 |
| – Strength Index Reading (3 Year Range): | Bearish-Extreme | Bullish-Extreme | Bullish-Extreme |
| NET POSITION MOVEMENT INDEX: | |||
| – 6-Week Change in Strength Index: | -18.9 | 16.5 | 19.3 |
COTTON Futures:
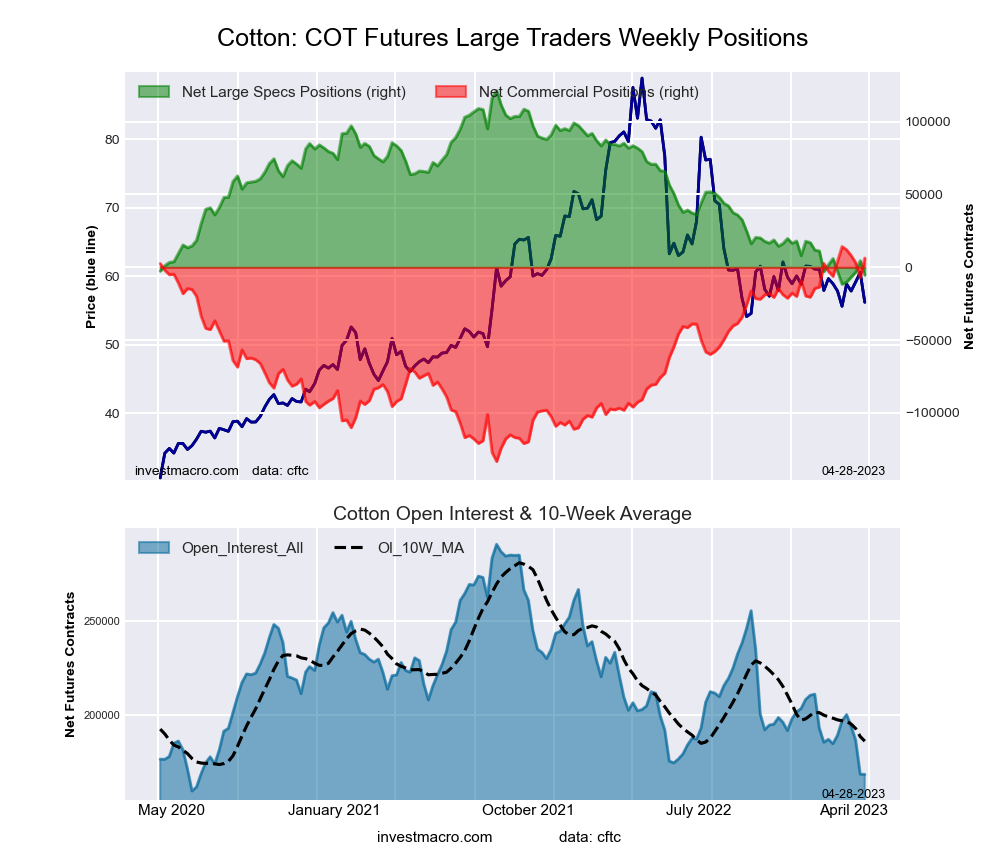 The COTTON large speculator standing this week was a net position of -5,413 contracts in the data reported through Tuesday. This was a weekly reduction of -9,883 contracts from the previous week which had a total of 4,470 net contracts.
This week’s current strength score (the trader positioning range over the past three years, measured from 0 to 100) shows the speculators are currently Bearish-Extreme with a score of 4.6 percent. The commercials are Bullish-Extreme with a score of 94.6 percent and the small traders (not shown in chart) are Bearish-Extreme with a score of 10.5 percent.
| COTTON Futures Statistics | SPECULATORS | COMMERCIALS | SMALL TRADERS |
| – Percent of Open Interest Longs: | 31.3 | 49.2 | 6.3 |
| – Percent of Open Interest Shorts: | 34.5 | 45.4 | 6.9 |
| – Net Position: | -5,413 | 6,321 | -908 |
| – Gross Longs: | 52,624 | 82,680 | 10,665 |
| – Gross Shorts: | 58,037 | 76,359 | 11,573 |
| – Long to Short Ratio: | 0.9 to 1 | 1.1 to 1 | 0.9 to 1 |
| NET POSITION TREND: | |||
| – Strength Index Score (3 Year Range Pct): | 4.6 | 94.6 | 10.5 |
| – Strength Index Reading (3 Year Range): | Bearish-Extreme | Bullish-Extreme | Bearish-Extreme |
| NET POSITION MOVEMENT INDEX: | |||
| – 6-Week Change in Strength Index: | -2.0 | 1.4 | 3.2 |
COCOA Futures:
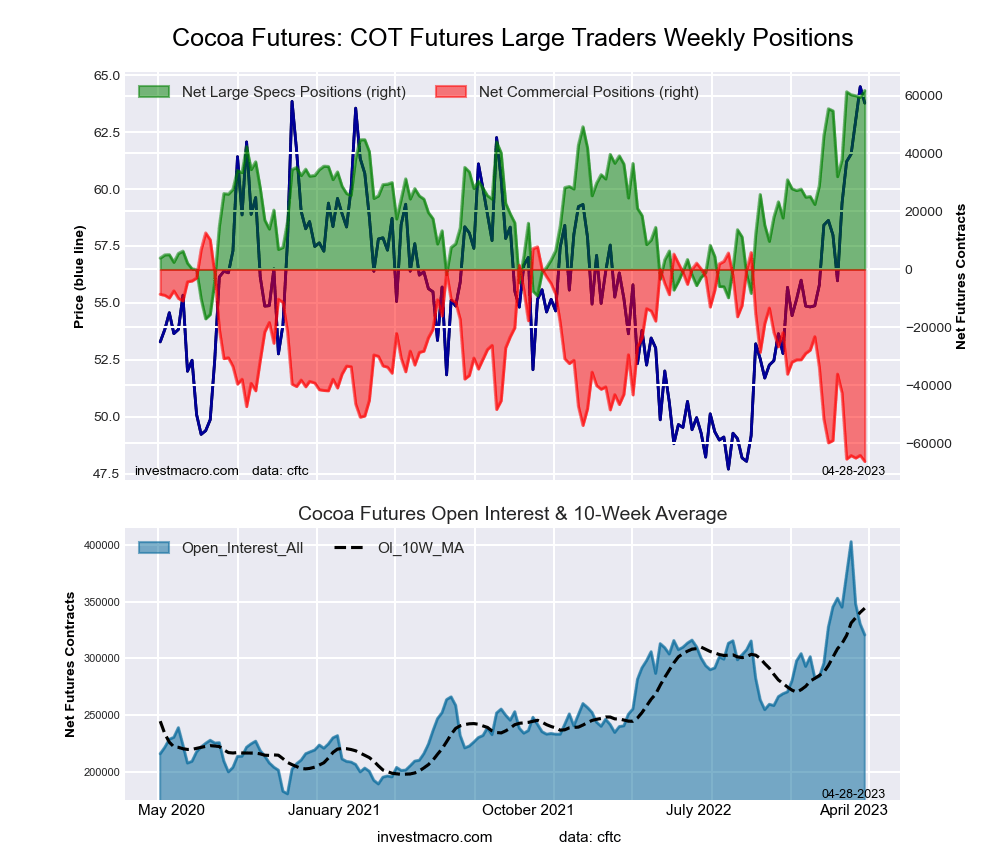 The COCOA large speculator standing this week was a net position of 61,714 contracts in the data reported through Tuesday. This was a weekly lift of 2,359 contracts from the previous week which had a total of 59,355 net contracts.
This week’s current strength score (the trader positioning range over the past three years, measured from 0 to 100) shows the speculators are currently Bullish-Extreme with a score of 100.0 percent. The commercials are Bearish-Extreme with a score of 0.0 percent and the small traders (not shown in chart) are Bearish with a score of 41.9 percent.
| COCOA Futures Statistics | SPECULATORS | COMMERCIALS | SMALL TRADERS |
| – Percent of Open Interest Longs: | 42.2 | 31.1 | 4.7 |
| – Percent of Open Interest Shorts: | 22.9 | 51.8 | 3.3 |
| – Net Position: | 61,714 | -66,251 | 4,537 |
| – Gross Longs: | 135,292 | 99,730 | 15,048 |
| – Gross Shorts: | 73,578 | 165,981 | 10,511 |
| – Long to Short Ratio: | 1.8 to 1 | 0.6 to 1 | 1.4 to 1 |
| NET POSITION TREND: | |||
| – Strength Index Score (3 Year Range Pct): | 100.0 | 0.0 | 41.9 |
| – Strength Index Reading (3 Year Range): | Bullish-Extreme | Bearish-Extreme | Bearish |
| NET POSITION MOVEMENT INDEX: | |||
| – 6-Week Change in Strength Index: | 37.7 | -38.2 | 4.4 |
WHEAT Futures:
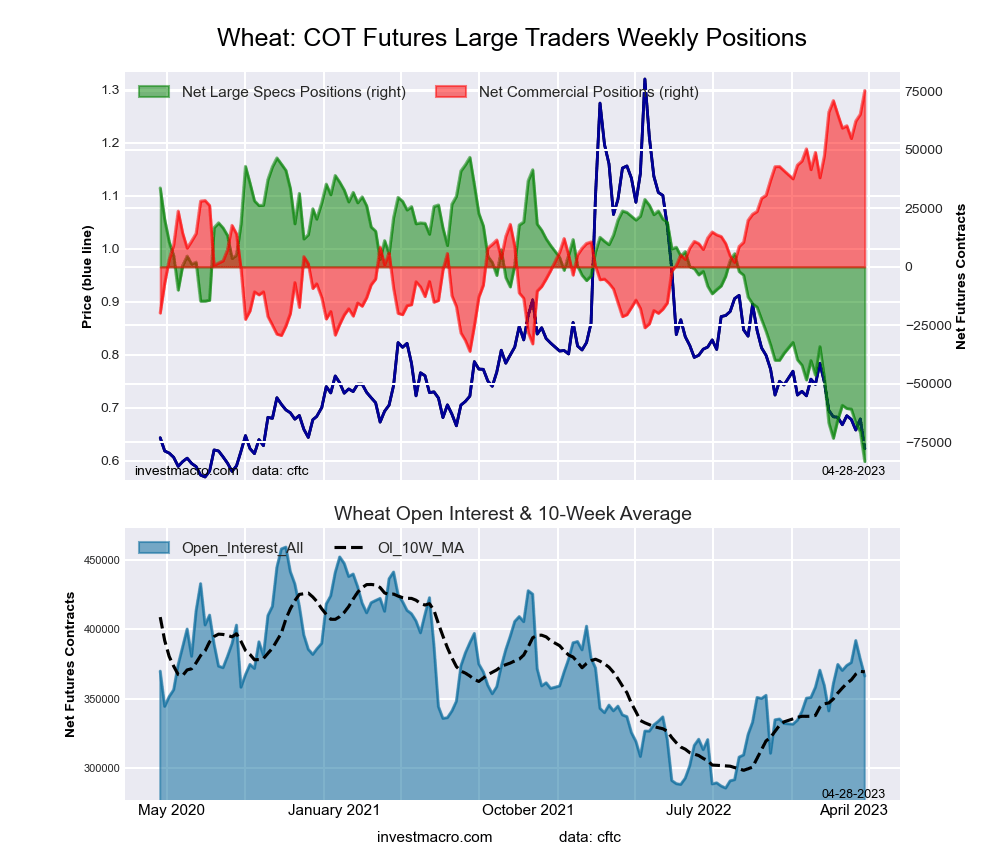 The WHEAT large speculator standing this week was a net position of -83,188 contracts in the data reported through Tuesday. This was a weekly reduction of -12,652 contracts from the previous week which had a total of -70,536 net contracts.
This week’s current strength score (the trader positioning range over the past three years, measured from 0 to 100) shows the speculators are currently Bearish-Extreme with a score of 0.0 percent. The commercials are Bullish-Extreme with a score of 100.0 percent and the small traders (not shown in chart) are Bullish-Extreme with a score of 100.0 percent.
| WHEAT Futures Statistics | SPECULATORS | COMMERCIALS | SMALL TRADERS |
| – Percent of Open Interest Longs: | 27.8 | 37.7 | 11.8 |
| – Percent of Open Interest Shorts: | 50.5 | 17.1 | 9.6 |
| – Net Position: | -83,188 | 75,369 | 7,819 |
| – Gross Longs: | 101,941 | 137,977 | 43,119 |
| – Gross Shorts: | 185,129 | 62,608 | 35,300 |
| – Long to Short Ratio: | 0.6 to 1 | 2.2 to 1 | 1.2 to 1 |
| NET POSITION TREND: | |||
| – Strength Index Score (3 Year Range Pct): | 0.0 | 100.0 | 100.0 |
| – Strength Index Reading (3 Year Range): | Bearish-Extreme | Bullish-Extreme | Bullish-Extreme |
| NET POSITION MOVEMENT INDEX: | |||
| – 6-Week Change in Strength Index: | -13.8 | 9.3 | 26.0 |
Article By InvestMacro – Receive our weekly COT Newsletter
*COT Report: The COT data, released weekly to the public each Friday, is updated through the most recent Tuesday (data is 3 days old) and shows a quick view of how large speculators or non-commercials (for-profit traders) were positioned in the futures markets.
The CFTC categorizes trader positions according to commercial hedgers (traders who use futures contracts for hedging as part of the business), non-commercials (large traders who speculate to realize trading profits) and nonreportable traders (usually small traders/speculators) as well as their open interest (contracts open in the market at time of reporting). See CFTC criteria here.

- Geopolitical and macroeconomic conditions continue to pressure market sentiment Jul 20, 2026
- USD/JPY Poised to Continue Gains as Expensive Oil and Lack of Support Weigh on Yen Jul 20, 2026
- COT Metals Charts: Weekly Speculator Bets led by Copper & Steel Jul 18, 2026
- COT Bonds Charts: Weekly Speculator Bets led by 2-Year, SOFR 3M & 5-Year Bonds Jul 18, 2026
- COT Energy Charts: Weekly Speculator Bets led by Brent Oil & Heating Oil Jul 18, 2026
- COT Soft Commodities Charts: Weekly Speculator Bets led by Wheat, Corn & Soybean Meal Jul 18, 2026
- The Bank of Canada kept its interest rate unchanged. Platinum prices reached a three‑week high Jul 16, 2026
- Stock indices rose after the release of US inflation data. China’s GDP slowed sharply Jul 15, 2026
- GBP/USD Awaits Political News: What Will Happen Next Jul 15, 2026
- USD/JPY Holds at Highs: Pressure Lingers on Yen Jul 14, 2026