
By InvestMacro
Here are the latest charts and statistics for the Commitment of Traders (COT) data published by the Commodities Futures Trading Commission (CFTC).
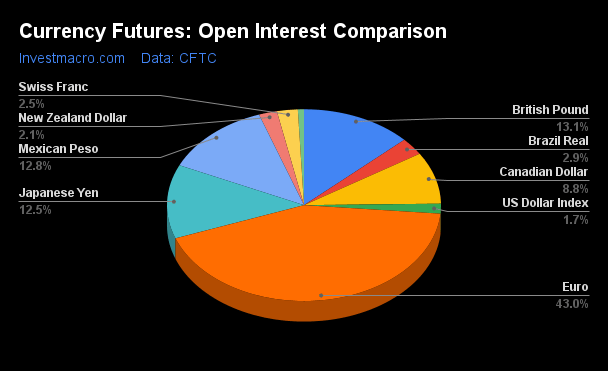
The latest COT data is updated through Tuesday May 23rd and shows a quick view of how large market participants (for-profit speculators and commercial traders) were positioned in the futures markets. All currency positions are in direct relation to the US dollar where, for example, a bet for the euro is a bet that the euro will rise versus the dollar while a bet against the euro will be a bet that the euro will decline versus the dollar.
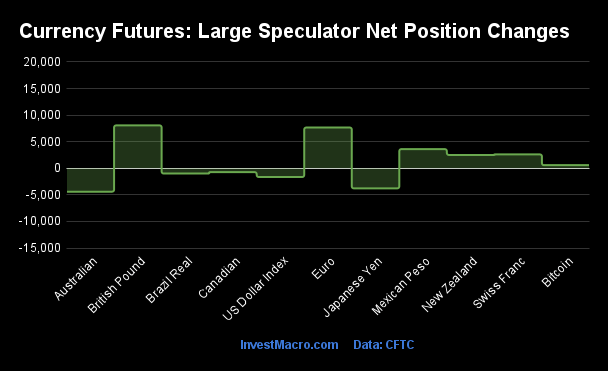
Weekly Speculator Changes led by the Australian Dollar & Mexican Peso
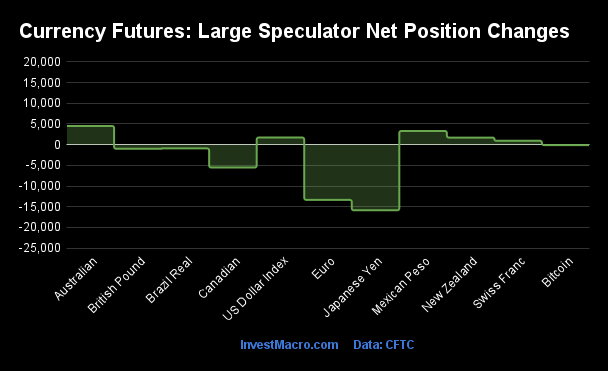
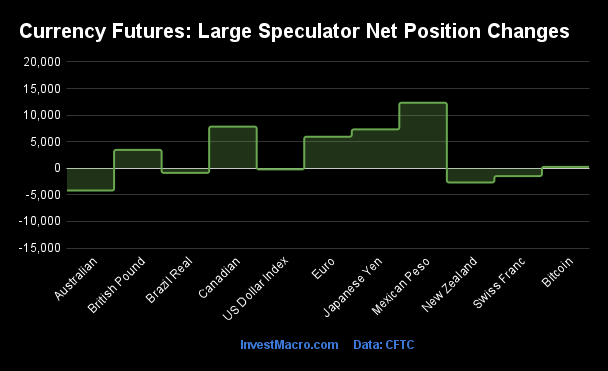
The COT currency market speculator bets were lower this week as five out of the eleven currency markets we cover had higher positioning while the other six markets had lower speculator contracts.
Leading the gains for the currency markets was the Australian Dollar (4,513 contracts) with the Mexican Peso (3,308 contracts), US Dollar Index (1,726 contracts), New Zealand Dollar (1,712 contracts) and the Swiss Franc (956 contracts) also showing positive weeks.
The currencies seeing declines in speculator bets on the week were the Japanese Yen (-15,869 contracts), EuroFX (-13,353 contracts), Canadian Dollar (-5,536 contracts), British Pound (-1,004 contracts), Brazilian Real (-914 contracts) and Bitcoin (-118 contracts) also registering lower bets on the week.
Speculators drop Japanese Yen bets to 30-week low
Highlighting the COT currency’s data this week is the renewed weakness of the speculator’s positioning for the Japanese yen.
Large speculative yen positions dropped this week by -15,869 net contracts and fell for the second week in a row. Over the past fifteen weeks, yen speculator bets have declined in eight of those weeks and a total of -51,571 contracts has been added to the bearish standing.
This week’s yen net position of -80,660 contracts marks the most bearish level of the past 30 weeks, dating back to October. From November to late-January, the yen positions had started to improve and started to shed bearish bets. The spec position saw improving positions in 10 out of 12 weeks through January 31st and this improvement brought the overall net position down to just -20,060 contracts. Since then, however, bearish bets have steadily risen and culminated in this week’s 30-week high.
The yen futures price is also back in a downtrend after rising approximately 17 percent from the most recent bottom in October to the most recent top in January. The yen futures have now fallen for three straight weeks and for six out of the past seven weeks with this week’s closing price at 0.0071 and at the lowest level since November.
| May-23-2023 | OI | OI-Index | Spec-Net | Spec-Index | Com-Net | COM-Index | Smalls-Net | Smalls-Index |
|---|---|---|---|---|---|---|---|---|
| USD Index | 30,203 | 24 | 11,240 | 44 | -13,869 | 54 | 2,629 | 45 |
| EUR | 781,123 | 84 | 173,736 | 85 | -224,195 | 15 | 50,459 | 59 |
| GBP | 237,614 | 60 | 11,589 | 79 | -16,676 | 23 | 5,087 | 68 |
| JPY | 226,400 | 64 | -80,660 | 19 | 92,378 | 81 | -11,718 | 30 |
| CHF | 44,808 | 52 | -903 | 52 | 1,691 | 48 | -788 | 55 |
| CAD | 159,199 | 36 | -48,526 | 9 | 49,140 | 90 | -614 | 21 |
| AUD | 180,138 | 74 | -49,081 | 39 | 60,043 | 64 | -10,962 | 26 |
| NZD | 39,011 | 32 | -363 | 53 | -556 | 45 | 919 | 61 |
| MXN | 233,538 | 49 | 76,943 | 100 | -82,616 | 0 | 5,673 | 83 |
| RUB | 20,930 | 4 | 7,543 | 31 | -7,150 | 69 | -393 | 24 |
| BRL | 53,223 | 44 | 32,692 | 77 | -36,671 | 20 | 3,979 | 76 |
| Bitcoin | 13,043 | 56 | 893 | 93 | -1,245 | 0 | 352 | 21 |
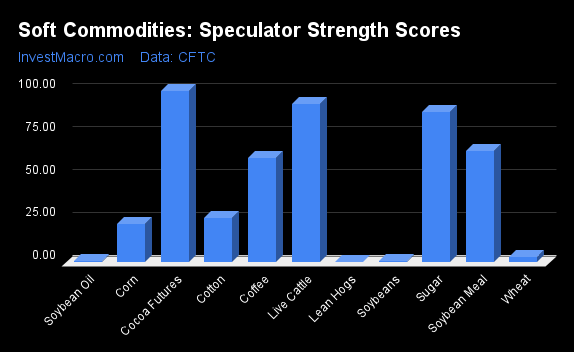
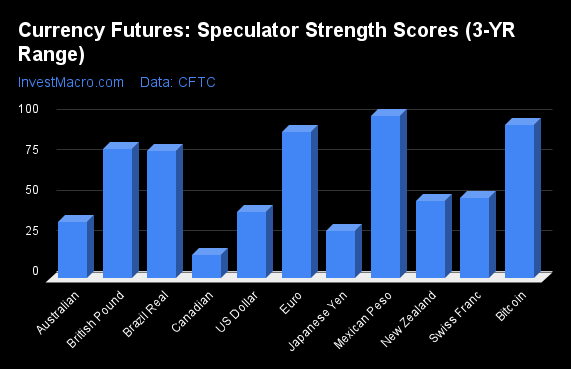
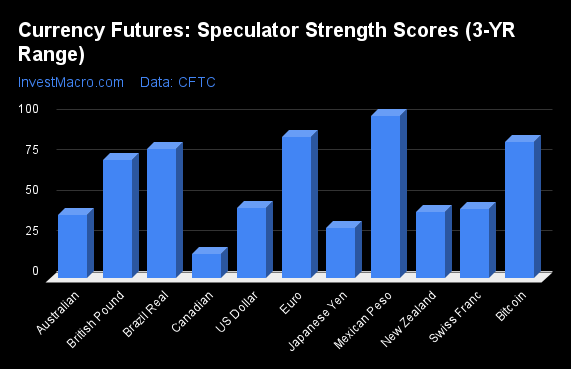
Strength Scores led by Mexican Peso & Bitcoin
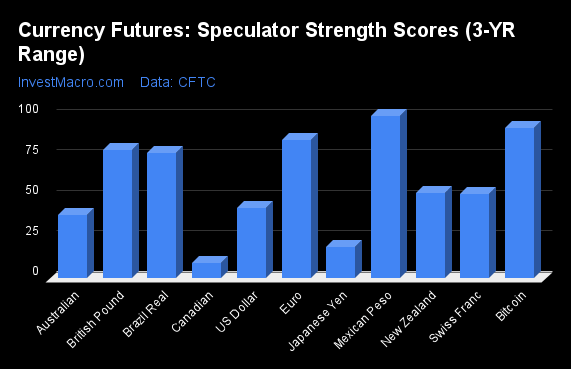
COT Strength Scores (a normalized measure of Speculator positions over a 3-Year range, from 0 to 100 where above 80 is Extreme-Bullish and below 20 is Extreme-Bearish) showed that the Mexican Peso (100 percent) and Bitcoin (93 percent) lead the currency markets this week. The EuroFX (85 percent), British Pound (79 percent) and the Brazilian Real (77 percent) come in as the next highest in the weekly strength scores.
On the downside, the Canadian Dollar (9 percent) and the Japanese Yen (19 percent) come in at the lowest strength levels currently and are in Extreme-Bearish territory (below 20 percent). The next lowest strength scores are the Australian Dollar (39 percent) and the US Dollar Index (44 percent).
Strength Statistics:
US Dollar Index (43.7 percent) vs US Dollar Index previous week (40.8 percent)
EuroFX (85.3 percent) vs EuroFX previous week (90.5 percent)
British Pound Sterling (79.0 percent) vs British Pound Sterling previous week (79.8 percent)
Japanese Yen (19.2 percent) vs Japanese Yen previous week (29.0 percent)
Swiss Franc (52.2 percent) vs Swiss Franc previous week (49.7 percent)
Canadian Dollar (9.3 percent) vs Canadian Dollar previous week (14.5 percent)
Australian Dollar (39.3 percent) vs Australian Dollar previous week (35.1 percent)
New Zealand Dollar (52.6 percent) vs New Zealand Dollar previous week (48.0 percent)
Mexican Peso (100.0 percent) vs Mexican Peso previous week (97.7 percent)
Brazilian Real (77.4 percent) vs Brazilian Real previous week (78.5 percent)
Bitcoin (92.5 percent) vs Bitcoin previous week (94.6 percent)
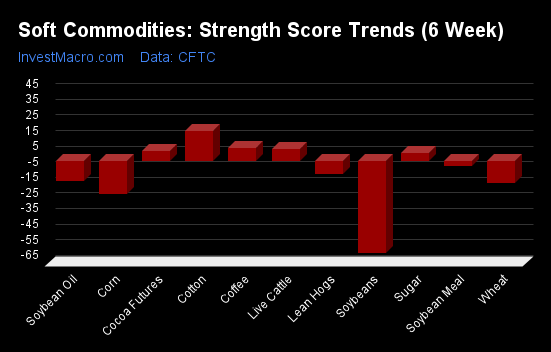
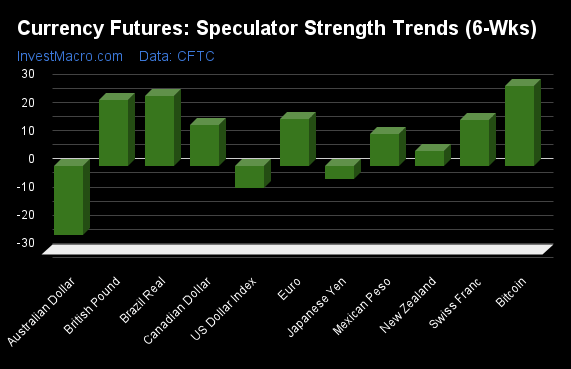
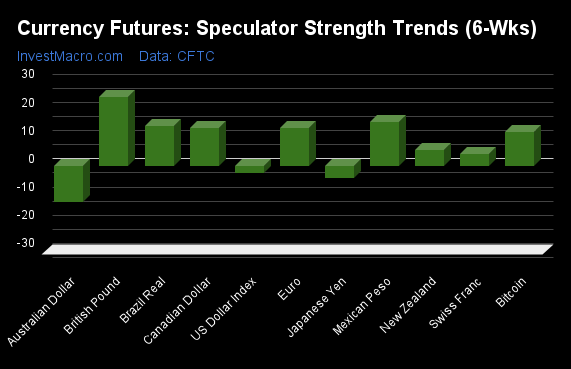
Bitcoin & Brazilian Real top the 6-Week Strength Trends
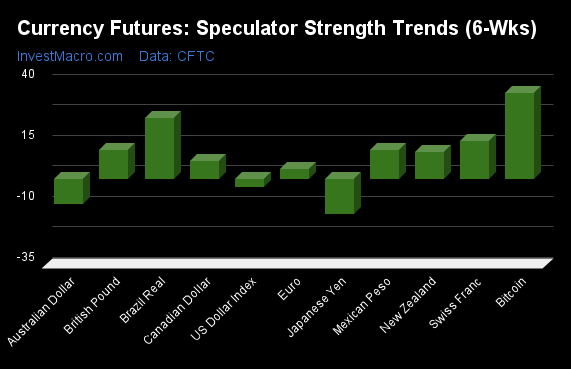
COT Strength Score Trends (or move index, calculates the 6-week changes in strength scores) showed that the Bitcoin (35 percent) and the Brazilian Real (25 percent) lead the past six weeks trends for the currencies. The Swiss Franc (15 percent), the British Pound (12 percent) and the Mexican Peso (12 percent) are the next highest positive movers in the latest trends data.
The Japanese Yen (-14 percent) leads the downside trend scores currently with the Australian Dollar (-10 percent) and the US Dollar Index (-3 percent) following next with lower trend scores.
Strength Trend Statistics:
US Dollar Index (-3.4 percent) vs US Dollar Index previous week (-7.7 percent)
EuroFX (4.0 percent) vs EuroFX previous week (16.8 percent)
British Pound Sterling (12.0 percent) vs British Pound Sterling previous week (23.5 percent)
Japanese Yen (-14.4 percent) vs Japanese Yen previous week (-4.8 percent)
Swiss Franc (15.4 percent) vs Swiss Franc previous week (16.2 percent)
Canadian Dollar (7.5 percent) vs Canadian Dollar previous week (14.5 percent)
Australian Dollar (-10.3 percent) vs Australian Dollar previous week (-24.4 percent)
New Zealand Dollar (11.2 percent) vs New Zealand Dollar previous week (5.3 percent)
Mexican Peso (11.7 percent) vs Mexican Peso previous week (11.1 percent)
Brazilian Real (25.1 percent) vs Brazilian Real previous week (24.9 percent)
Bitcoin (35.1 percent) vs Bitcoin previous week (28.4 percent)
Individual COT Forex Markets:
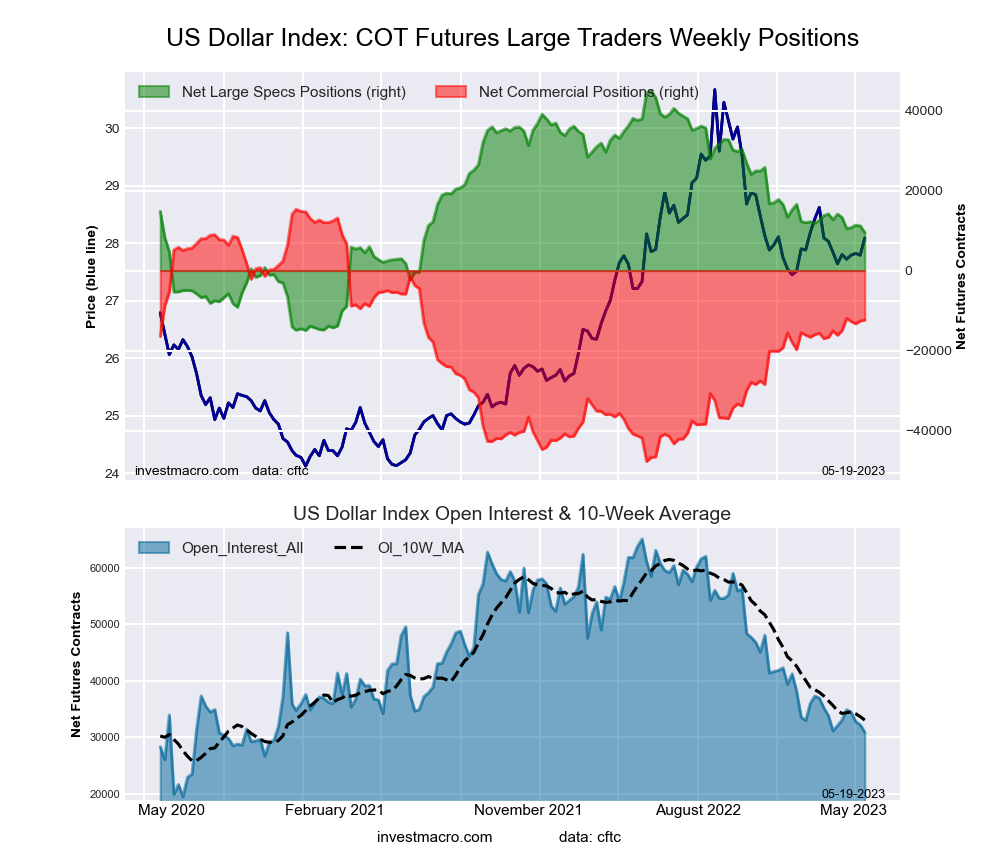
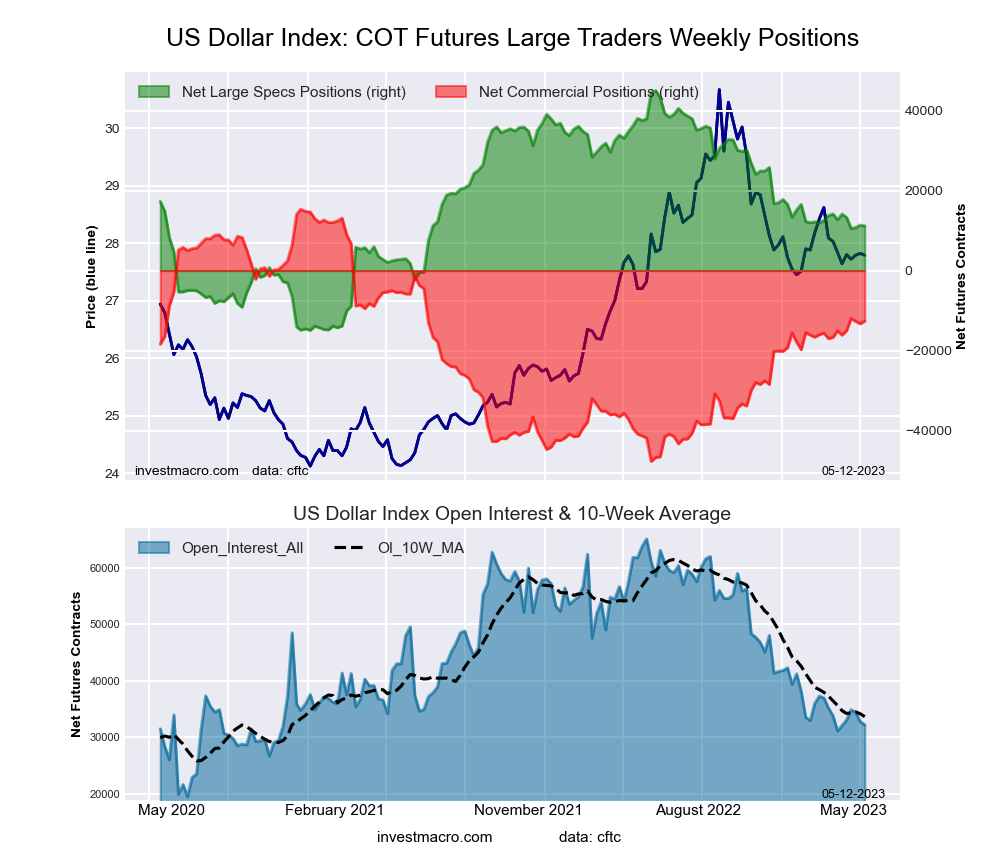
US Dollar Index Futures:
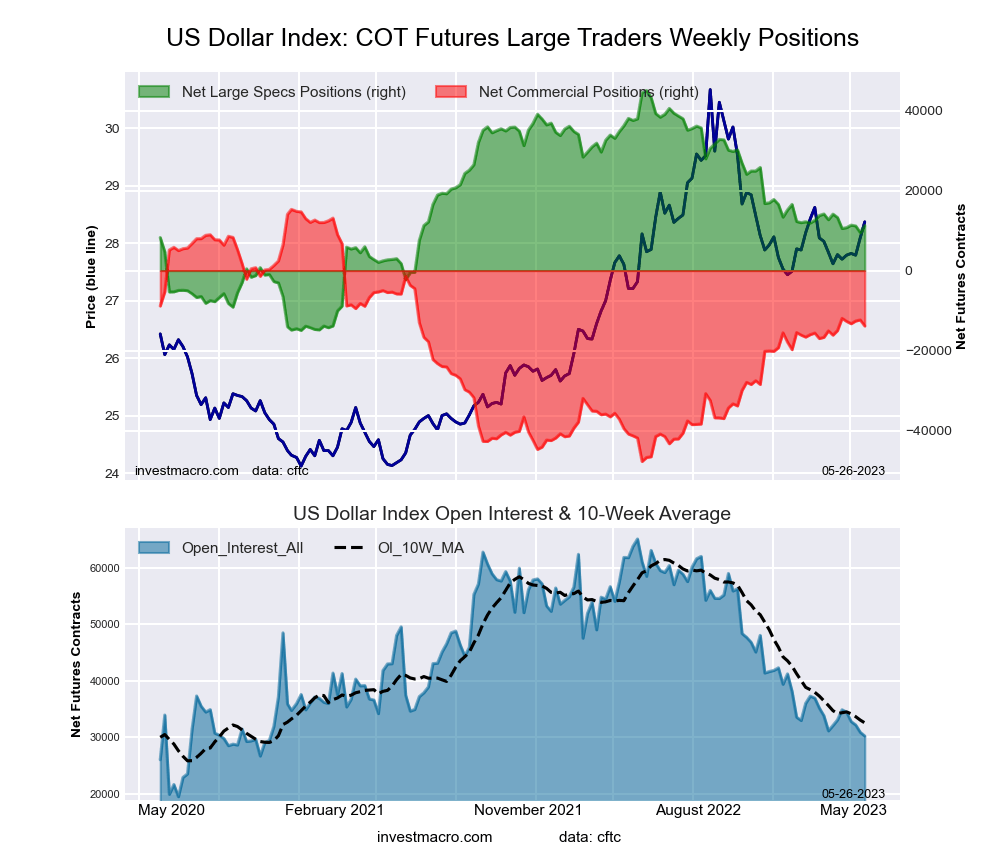 The US Dollar Index large speculator standing this week came in at a net position of 11,240 contracts in the data reported through Tuesday. This was a weekly increase of 1,726 contracts from the previous week which had a total of 9,514 net contracts.
This week’s current strength score (the trader positioning range over the past three years, measured from 0 to 100) shows the speculators are currently Bearish with a score of 43.7 percent. The commercials are Bullish with a score of 53.7 percent and the small traders (not shown in chart) are Bearish with a score of 45.3 percent.
| US DOLLAR INDEX Statistics | SPECULATORS | COMMERCIALS | SMALL TRADERS |
| – Percent of Open Interest Longs: | 73.5 | 2.8 | 17.9 |
| – Percent of Open Interest Shorts: | 36.3 | 48.8 | 9.2 |
| – Net Position: | 11,240 | -13,869 | 2,629 |
| – Gross Longs: | 22,194 | 859 | 5,398 |
| – Gross Shorts: | 10,954 | 14,728 | 2,769 |
| – Long to Short Ratio: | 2.0 to 1 | 0.1 to 1 | 1.9 to 1 |
| NET POSITION TREND: | |||
| – Strength Index Score (3 Year Range Pct): | 43.7 | 53.7 | 45.3 |
| – Strength Index Reading (3 Year Range): | Bearish | Bullish | Bearish |
| NET POSITION MOVEMENT INDEX: | |||
| – 6-Week Change in Strength Index: | -3.4 | 1.8 | 9.6 |
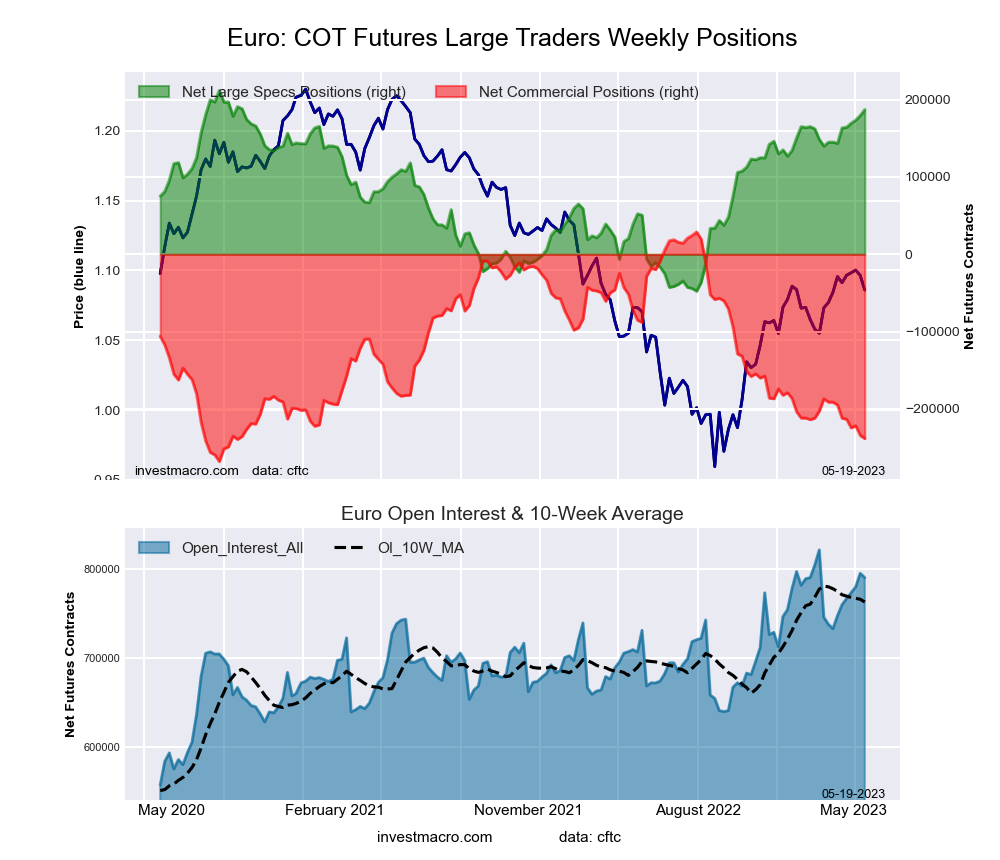
Euro Currency Futures:
 The Euro Currency large speculator standing this week came in at a net position of 173,736 contracts in the data reported through Tuesday. This was a weekly reduction of -13,353 contracts from the previous week which had a total of 187,089 net contracts.
This week’s current strength score (the trader positioning range over the past three years, measured from 0 to 100) shows the speculators are currently Bullish-Extreme with a score of 85.3 percent. The commercials are Bearish-Extreme with a score of 14.8 percent and the small traders (not shown in chart) are Bullish with a score of 59.5 percent.
| EURO Currency Statistics | SPECULATORS | COMMERCIALS | SMALL TRADERS |
| – Percent of Open Interest Longs: | 32.0 | 53.5 | 11.8 |
| – Percent of Open Interest Shorts: | 9.8 | 82.2 | 5.3 |
| – Net Position: | 173,736 | -224,195 | 50,459 |
| – Gross Longs: | 250,070 | 418,071 | 92,077 |
| – Gross Shorts: | 76,334 | 642,266 | 41,618 |
| – Long to Short Ratio: | 3.3 to 1 | 0.7 to 1 | 2.2 to 1 |
| NET POSITION TREND: | |||
| – Strength Index Score (3 Year Range Pct): | 85.3 | 14.8 | 59.5 |
| – Strength Index Reading (3 Year Range): | Bullish-Extreme | Bearish-Extreme | Bullish |
| NET POSITION MOVEMENT INDEX: | |||
| – 6-Week Change in Strength Index: | 4.0 | -4.1 | 2.8 |
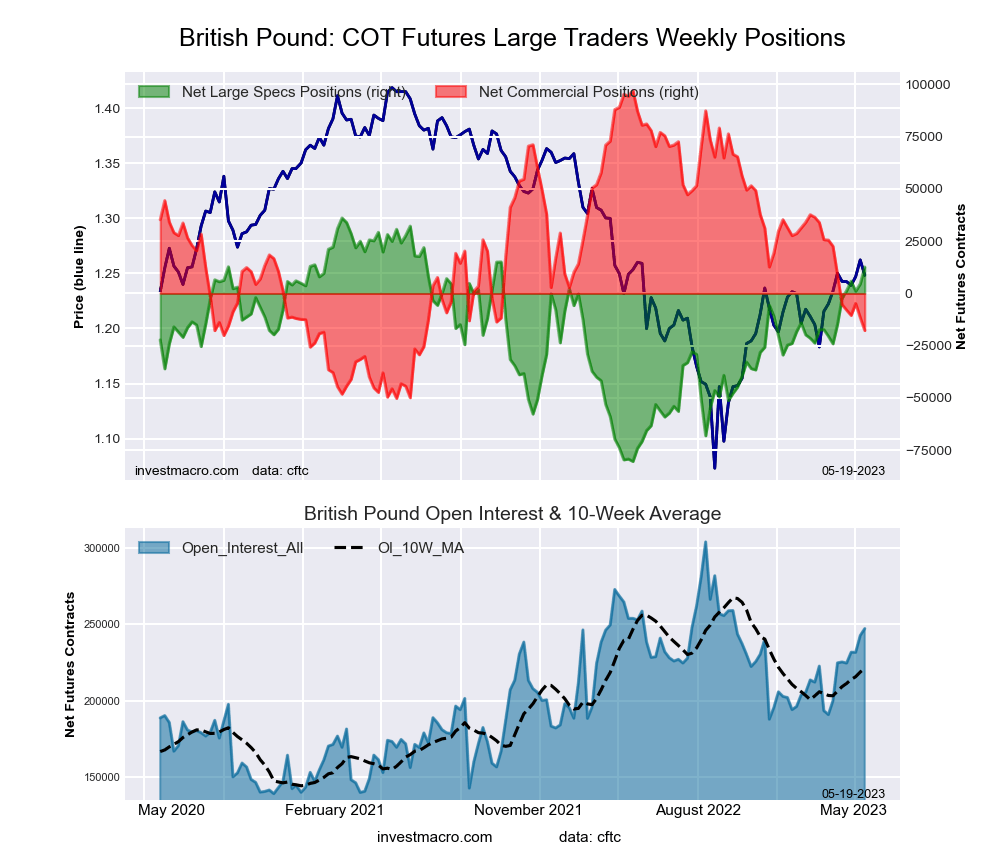
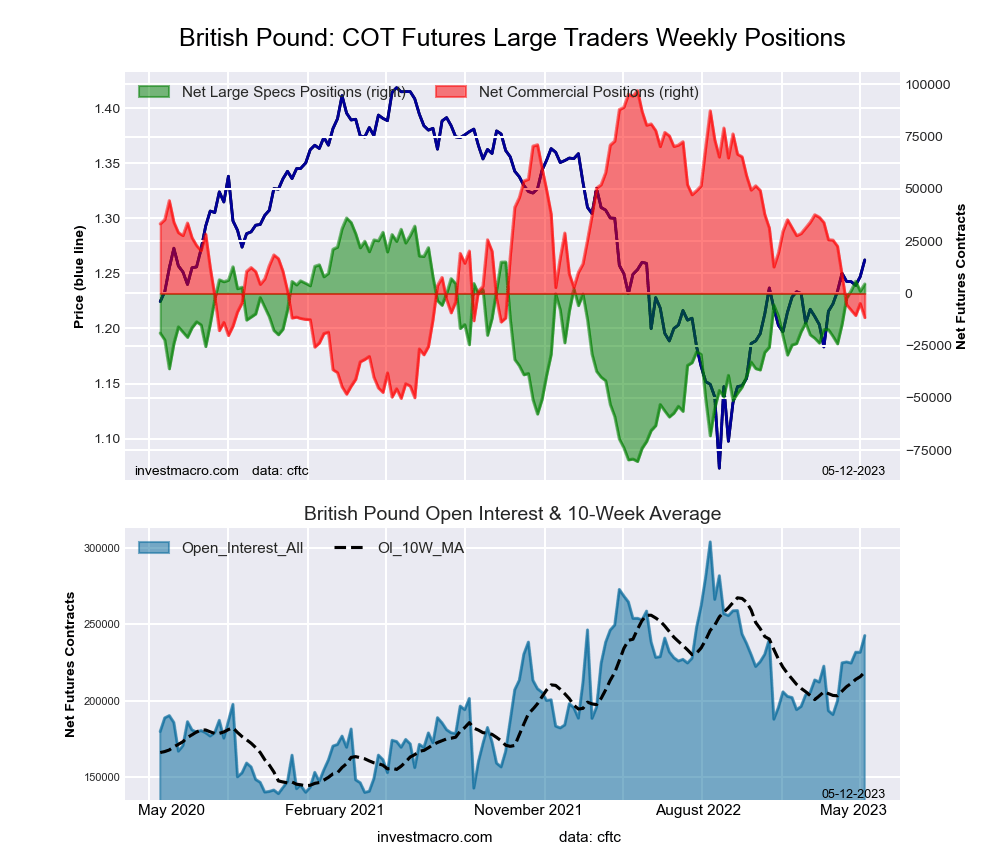
British Pound Sterling Futures:
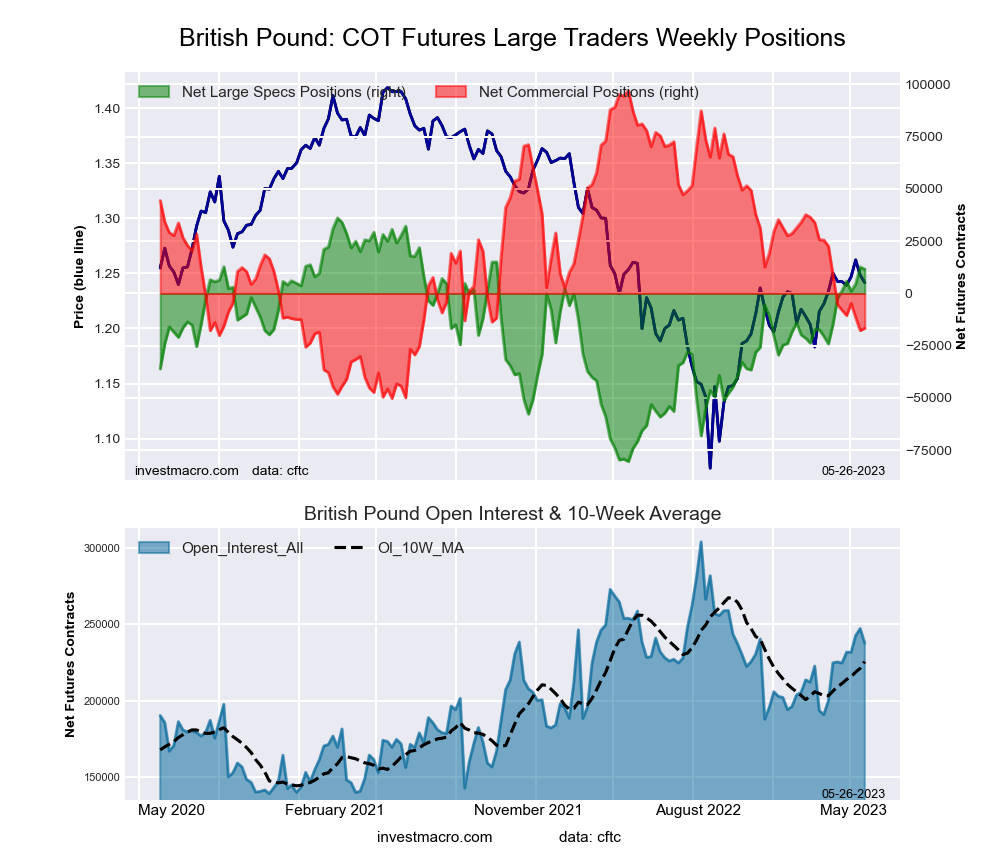 The British Pound Sterling large speculator standing this week came in at a net position of 11,589 contracts in the data reported through Tuesday. This was a weekly fall of -1,004 contracts from the previous week which had a total of 12,593 net contracts.
This week’s current strength score (the trader positioning range over the past three years, measured from 0 to 100) shows the speculators are currently Bullish with a score of 79.0 percent. The commercials are Bearish with a score of 22.8 percent and the small traders (not shown in chart) are Bullish with a score of 68.0 percent.
| BRITISH POUND Statistics | SPECULATORS | COMMERCIALS | SMALL TRADERS |
| – Percent of Open Interest Longs: | 29.1 | 51.9 | 13.1 |
| – Percent of Open Interest Shorts: | 24.2 | 58.9 | 10.9 |
| – Net Position: | 11,589 | -16,676 | 5,087 |
| – Gross Longs: | 69,203 | 123,348 | 31,097 |
| – Gross Shorts: | 57,614 | 140,024 | 26,010 |
| – Long to Short Ratio: | 1.2 to 1 | 0.9 to 1 | 1.2 to 1 |
| NET POSITION TREND: | |||
| – Strength Index Score (3 Year Range Pct): | 79.0 | 22.8 | 68.0 |
| – Strength Index Reading (3 Year Range): | Bullish | Bearish | Bullish |
| NET POSITION MOVEMENT INDEX: | |||
| – 6-Week Change in Strength Index: | 12.0 | -7.7 | -5.2 |
Japanese Yen Futures:
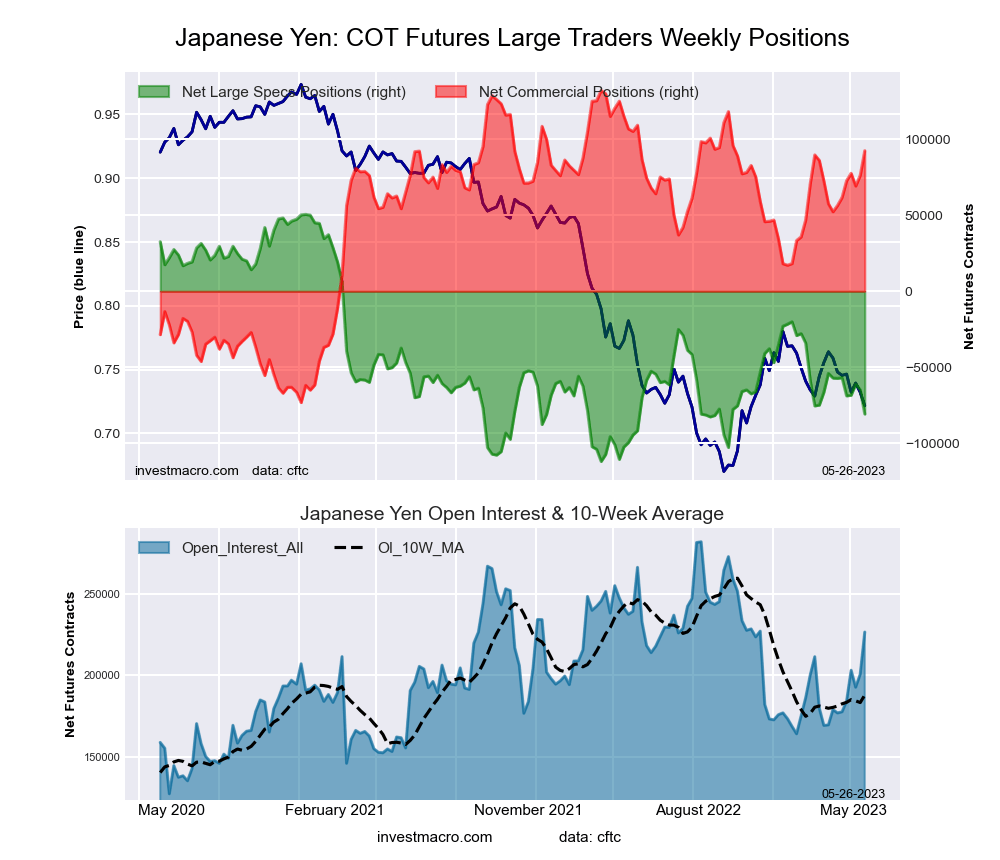 The Japanese Yen large speculator standing this week came in at a net position of -80,660 contracts in the data reported through Tuesday. This was a weekly decline of -15,869 contracts from the previous week which had a total of -64,791 net contracts.
This week’s current strength score (the trader positioning range over the past three years, measured from 0 to 100) shows the speculators are currently Bearish-Extreme with a score of 19.2 percent. The commercials are Bullish-Extreme with a score of 80.7 percent and the small traders (not shown in chart) are Bearish with a score of 29.6 percent.
| JAPANESE YEN Statistics | SPECULATORS | COMMERCIALS | SMALL TRADERS |
| – Percent of Open Interest Longs: | 16.2 | 69.6 | 12.2 |
| – Percent of Open Interest Shorts: | 51.9 | 28.8 | 17.4 |
| – Net Position: | -80,660 | 92,378 | -11,718 |
| – Gross Longs: | 36,760 | 157,498 | 27,680 |
| – Gross Shorts: | 117,420 | 65,120 | 39,398 |
| – Long to Short Ratio: | 0.3 to 1 | 2.4 to 1 | 0.7 to 1 |
| NET POSITION TREND: | |||
| – Strength Index Score (3 Year Range Pct): | 19.2 | 80.7 | 29.6 |
| – Strength Index Reading (3 Year Range): | Bearish-Extreme | Bullish-Extreme | Bearish |
| NET POSITION MOVEMENT INDEX: | |||
| – 6-Week Change in Strength Index: | -14.4 | 17.6 | -25.5 |
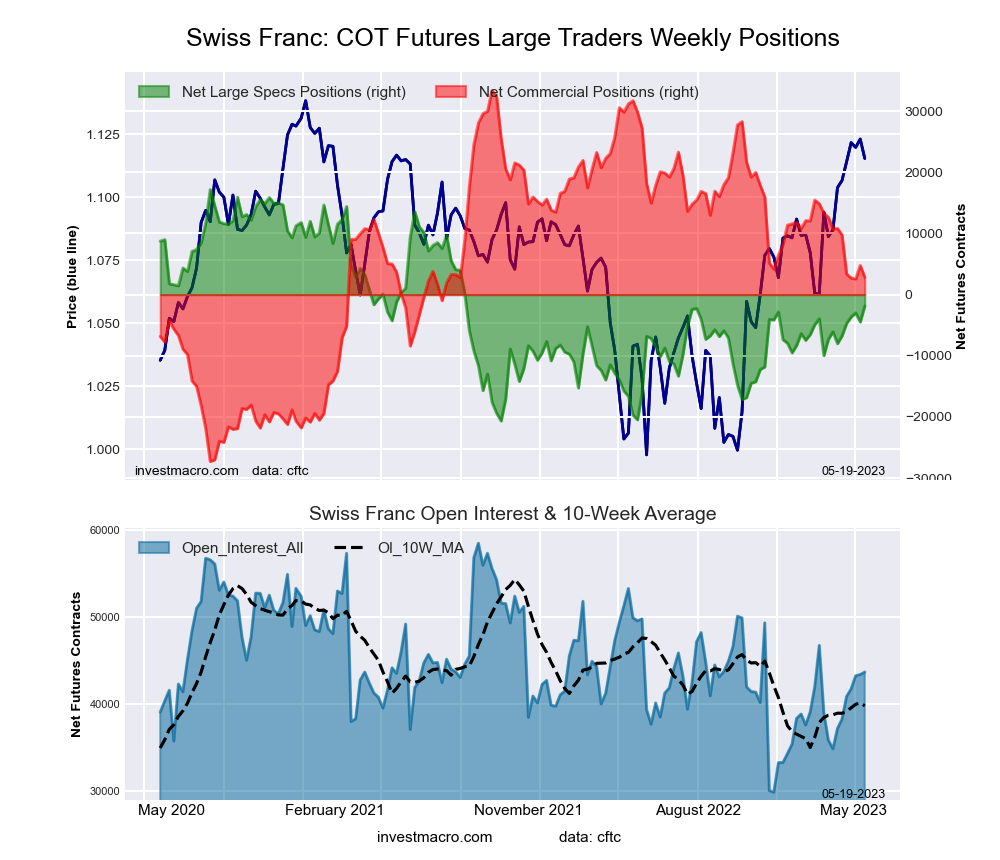
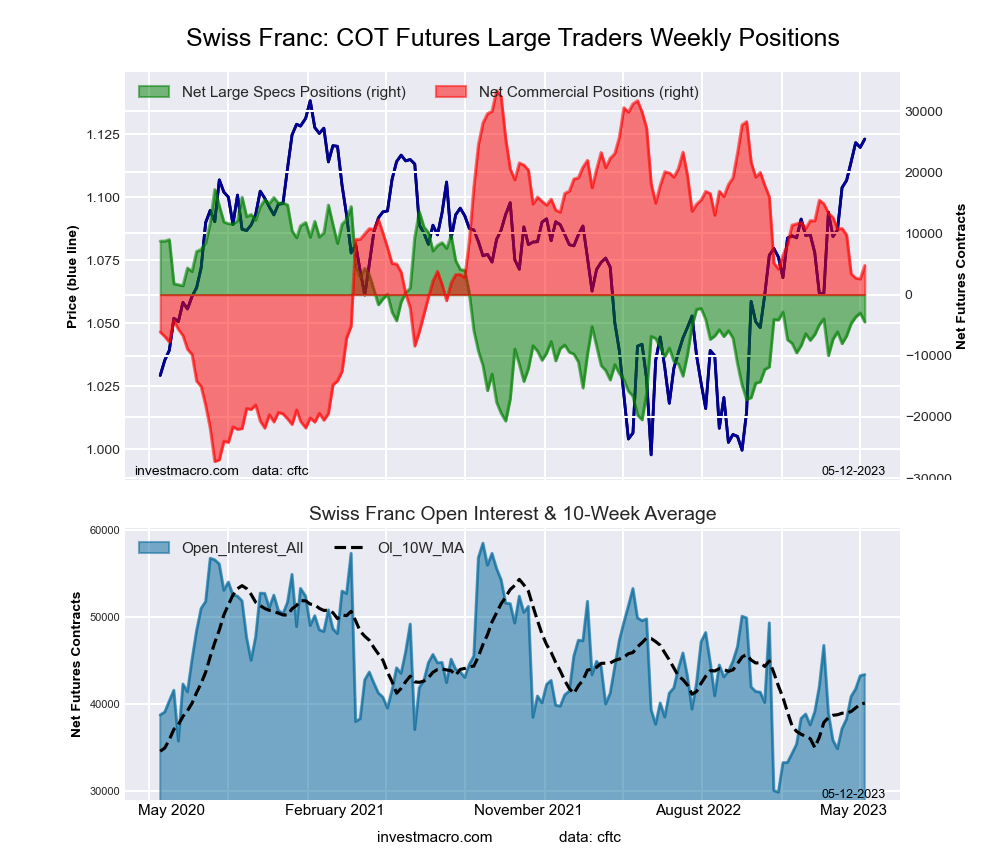
Swiss Franc Futures:
 The Swiss Franc large speculator standing this week came in at a net position of -903 contracts in the data reported through Tuesday. This was a weekly increase of 956 contracts from the previous week which had a total of -1,859 net contracts.
This week’s current strength score (the trader positioning range over the past three years, measured from 0 to 100) shows the speculators are currently Bullish with a score of 52.2 percent. The commercials are Bearish with a score of 47.8 percent and the small traders (not shown in chart) are Bullish with a score of 54.9 percent.
| SWISS FRANC Statistics | SPECULATORS | COMMERCIALS | SMALL TRADERS |
| – Percent of Open Interest Longs: | 22.9 | 40.9 | 30.5 |
| – Percent of Open Interest Shorts: | 24.9 | 37.1 | 32.3 |
| – Net Position: | -903 | 1,691 | -788 |
| – Gross Longs: | 10,267 | 18,328 | 13,674 |
| – Gross Shorts: | 11,170 | 16,637 | 14,462 |
| – Long to Short Ratio: | 0.9 to 1 | 1.1 to 1 | 0.9 to 1 |
| NET POSITION TREND: | |||
| – Strength Index Score (3 Year Range Pct): | 52.2 | 47.8 | 54.9 |
| – Strength Index Reading (3 Year Range): | Bullish | Bearish | Bullish |
| NET POSITION MOVEMENT INDEX: | |||
| – 6-Week Change in Strength Index: | 15.4 | -13.3 | 7.5 |
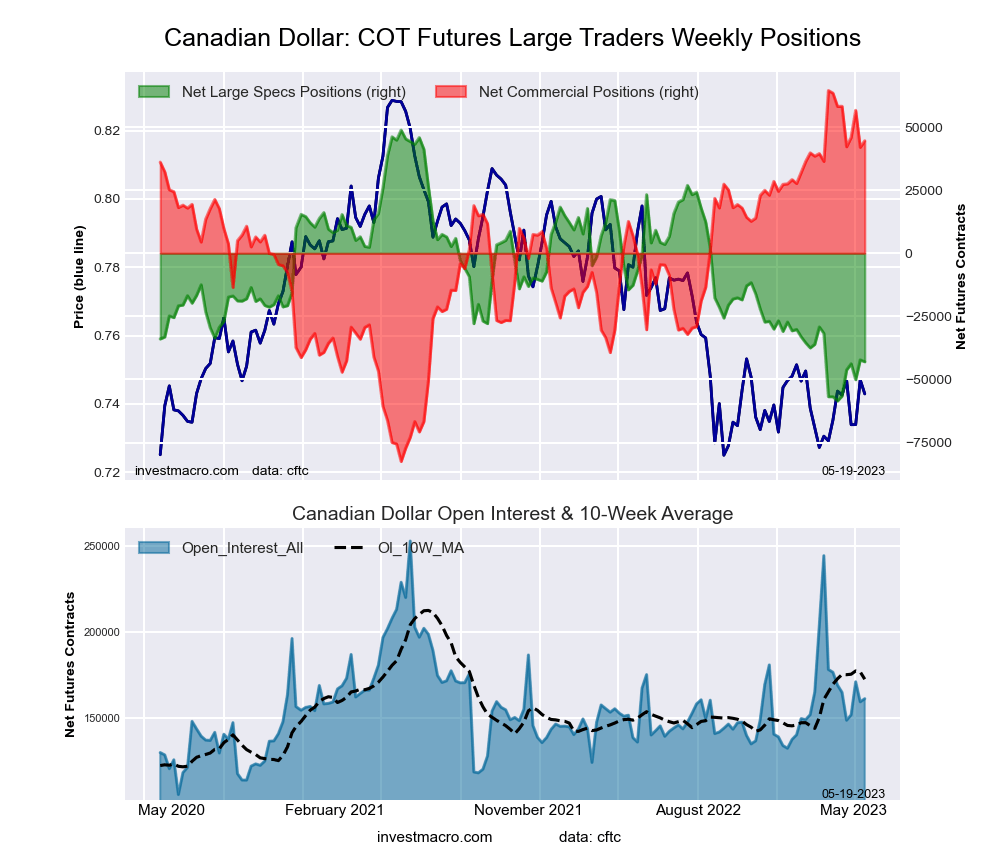
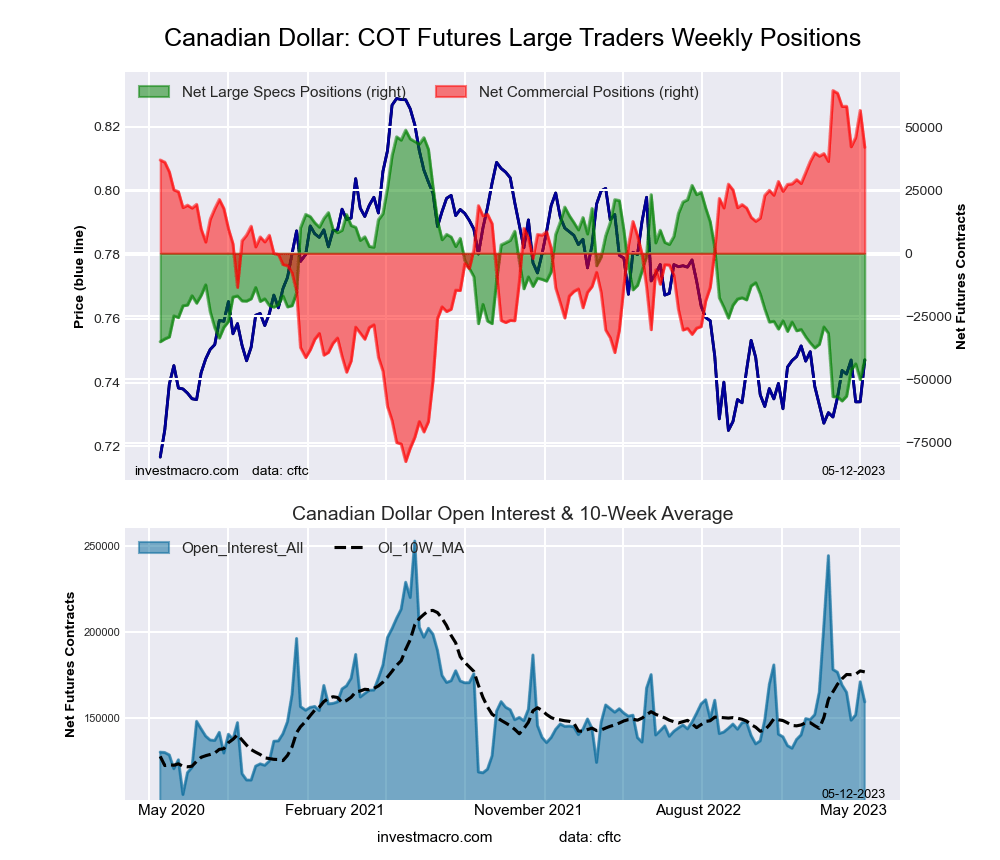
Canadian Dollar Futures:
 The Canadian Dollar large speculator standing this week came in at a net position of -48,526 contracts in the data reported through Tuesday. This was a weekly decline of -5,536 contracts from the previous week which had a total of -42,990 net contracts.
This week’s current strength score (the trader positioning range over the past three years, measured from 0 to 100) shows the speculators are currently Bearish-Extreme with a score of 9.3 percent. The commercials are Bullish-Extreme with a score of 89.6 percent and the small traders (not shown in chart) are Bearish with a score of 21.4 percent.
| CANADIAN DOLLAR Statistics | SPECULATORS | COMMERCIALS | SMALL TRADERS |
| – Percent of Open Interest Longs: | 12.8 | 65.1 | 19.6 |
| – Percent of Open Interest Shorts: | 43.3 | 34.2 | 19.9 |
| – Net Position: | -48,526 | 49,140 | -614 |
| – Gross Longs: | 20,388 | 103,597 | 31,126 |
| – Gross Shorts: | 68,914 | 54,457 | 31,740 |
| – Long to Short Ratio: | 0.3 to 1 | 1.9 to 1 | 1.0 to 1 |
| NET POSITION TREND: | |||
| – Strength Index Score (3 Year Range Pct): | 9.3 | 89.6 | 21.4 |
| – Strength Index Reading (3 Year Range): | Bearish-Extreme | Bullish-Extreme | Bearish |
| NET POSITION MOVEMENT INDEX: | |||
| – 6-Week Change in Strength Index: | 7.5 | -6.2 | 2.2 |
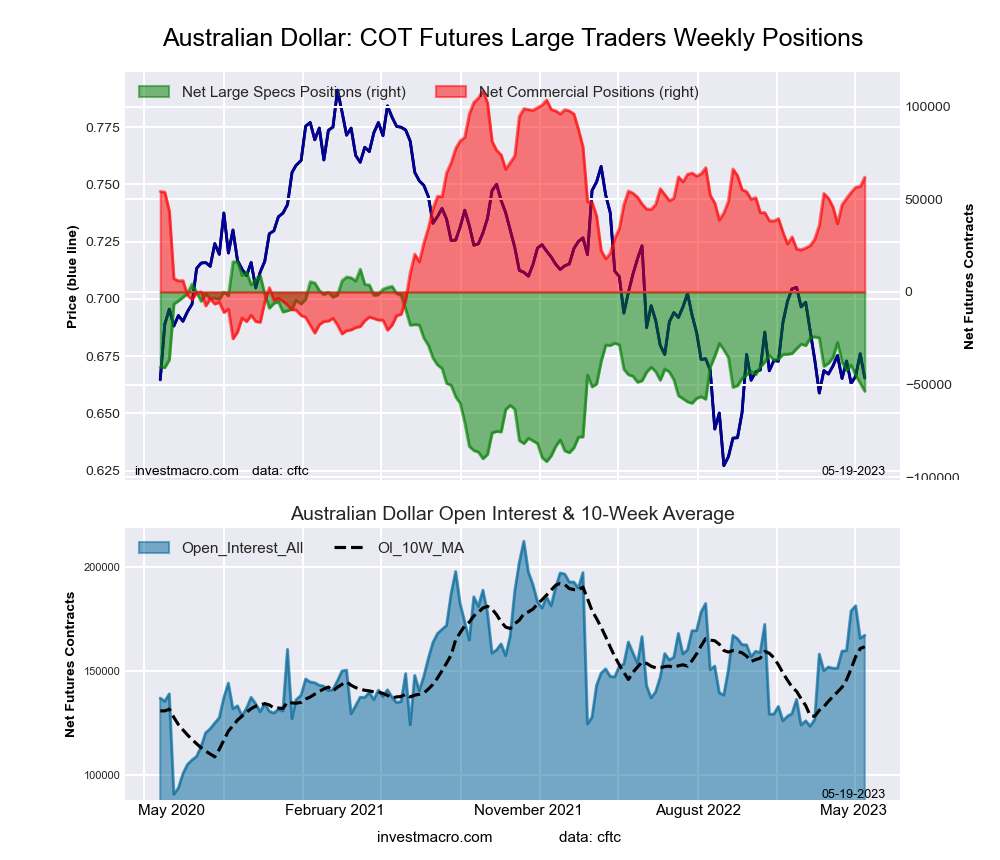
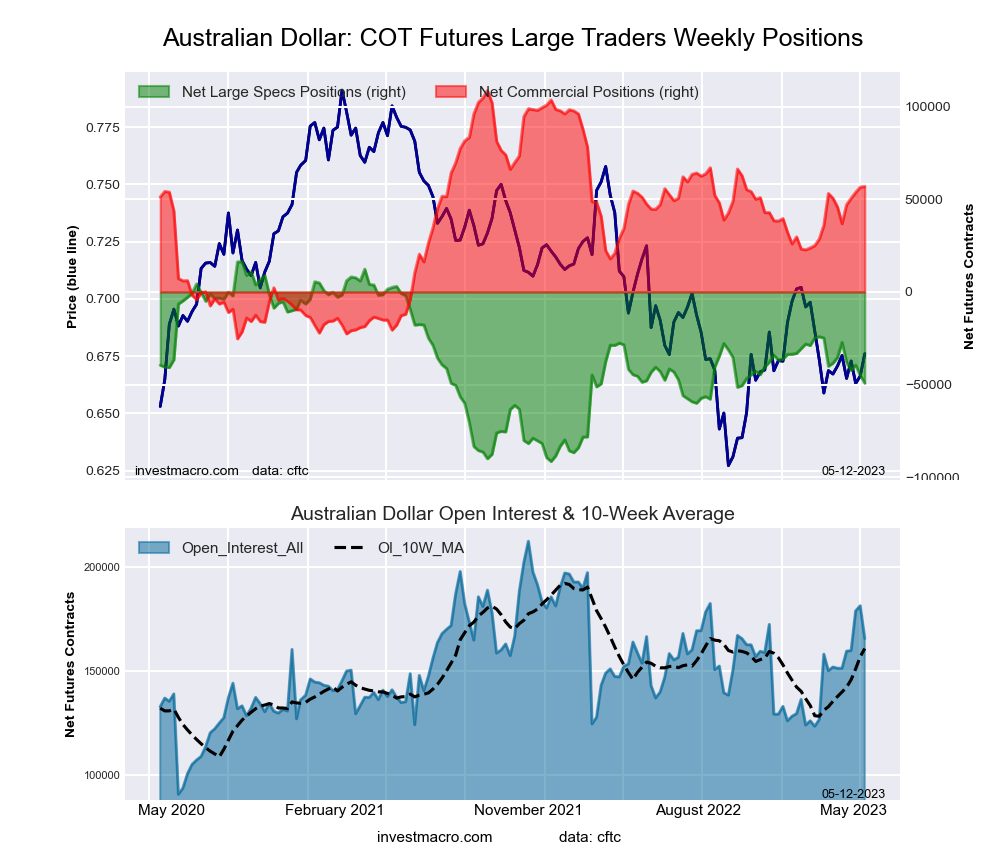
Australian Dollar Futures:
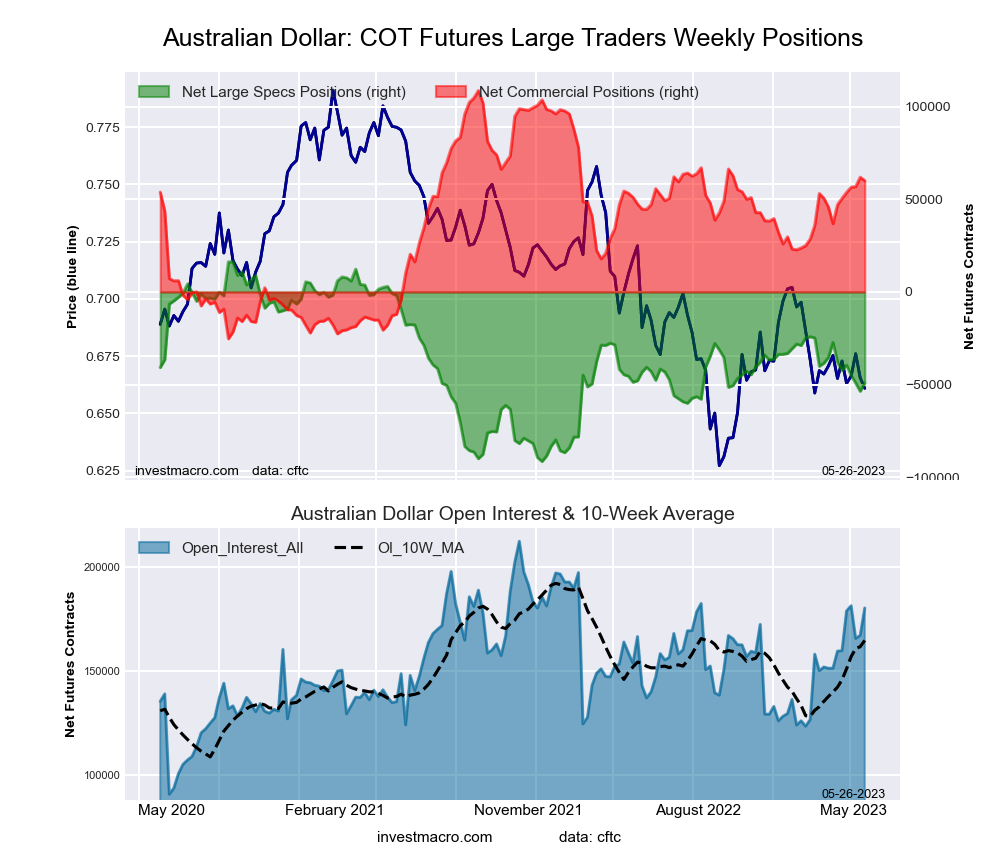 The Australian Dollar large speculator standing this week came in at a net position of -49,081 contracts in the data reported through Tuesday. This was a weekly rise of 4,513 contracts from the previous week which had a total of -53,594 net contracts.
This week’s current strength score (the trader positioning range over the past three years, measured from 0 to 100) shows the speculators are currently Bearish with a score of 39.3 percent. The commercials are Bullish with a score of 63.7 percent and the small traders (not shown in chart) are Bearish with a score of 25.7 percent.
| AUSTRALIAN DOLLAR Statistics | SPECULATORS | COMMERCIALS | SMALL TRADERS |
| – Percent of Open Interest Longs: | 29.7 | 56.7 | 10.6 |
| – Percent of Open Interest Shorts: | 56.9 | 23.3 | 16.7 |
| – Net Position: | -49,081 | 60,043 | -10,962 |
| – Gross Longs: | 53,419 | 102,079 | 19,057 |
| – Gross Shorts: | 102,500 | 42,036 | 30,019 |
| – Long to Short Ratio: | 0.5 to 1 | 2.4 to 1 | 0.6 to 1 |
| NET POSITION TREND: | |||
| – Strength Index Score (3 Year Range Pct): | 39.3 | 63.7 | 25.7 |
| – Strength Index Reading (3 Year Range): | Bearish | Bullish | Bearish |
| NET POSITION MOVEMENT INDEX: | |||
| – 6-Week Change in Strength Index: | -10.3 | 9.7 | -4.5 |
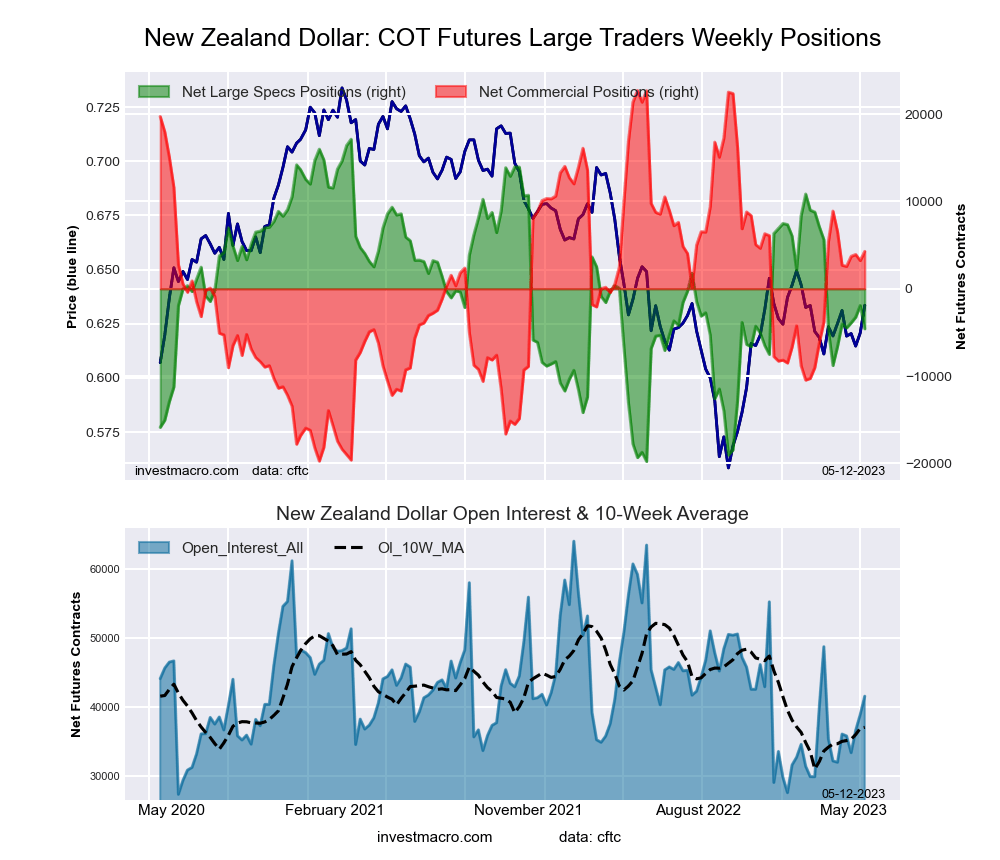
New Zealand Dollar Futures:
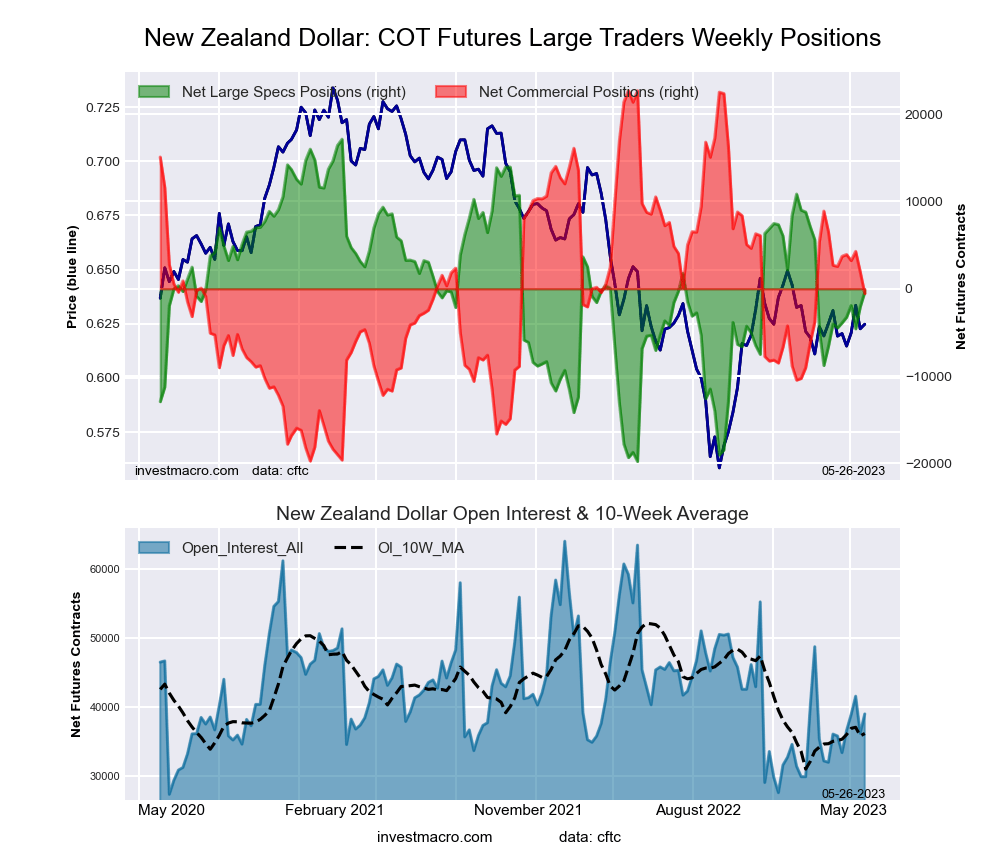 The New Zealand Dollar large speculator standing this week came in at a net position of -363 contracts in the data reported through Tuesday. This was a weekly rise of 1,712 contracts from the previous week which had a total of -2,075 net contracts.
This week’s current strength score (the trader positioning range over the past three years, measured from 0 to 100) shows the speculators are currently Bullish with a score of 52.6 percent. The commercials are Bearish with a score of 45.2 percent and the small traders (not shown in chart) are Bullish with a score of 60.9 percent.
| NEW ZEALAND DOLLAR Statistics | SPECULATORS | COMMERCIALS | SMALL TRADERS |
| – Percent of Open Interest Longs: | 42.7 | 45.8 | 10.3 |
| – Percent of Open Interest Shorts: | 43.6 | 47.2 | 8.0 |
| – Net Position: | -363 | -556 | 919 |
| – Gross Longs: | 16,648 | 17,854 | 4,036 |
| – Gross Shorts: | 17,011 | 18,410 | 3,117 |
| – Long to Short Ratio: | 1.0 to 1 | 1.0 to 1 | 1.3 to 1 |
| NET POSITION TREND: | |||
| – Strength Index Score (3 Year Range Pct): | 52.6 | 45.2 | 60.9 |
| – Strength Index Reading (3 Year Range): | Bullish | Bearish | Bullish |
| NET POSITION MOVEMENT INDEX: | |||
| – 6-Week Change in Strength Index: | 11.2 | -7.4 | -11.8 |
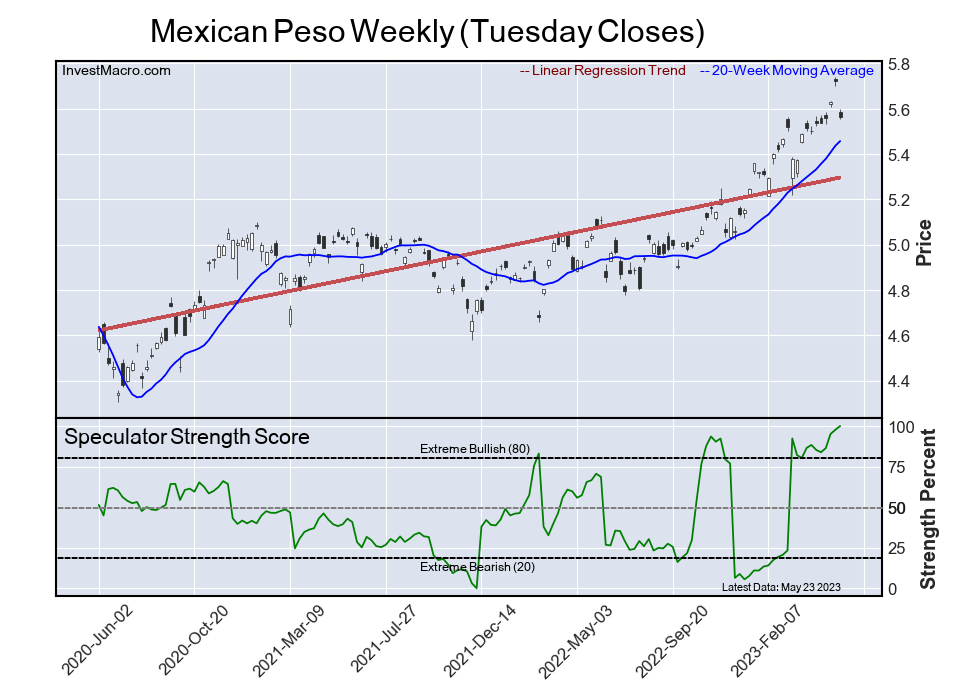
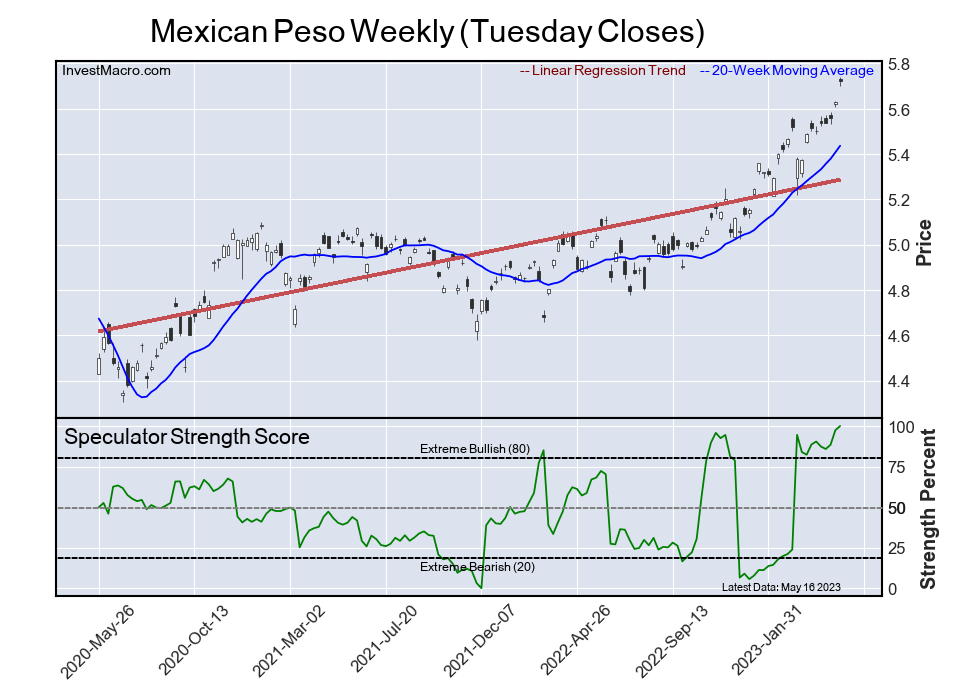
Mexican Peso Futures:
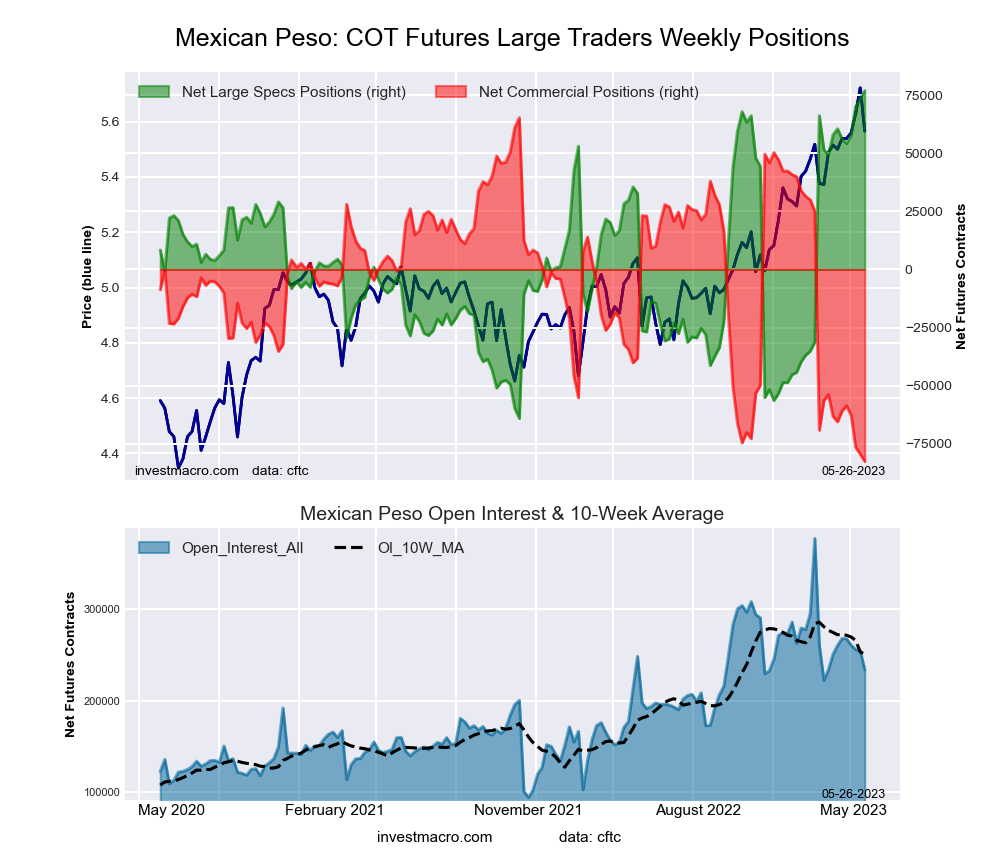 The Mexican Peso large speculator standing this week came in at a net position of 76,943 contracts in the data reported through Tuesday. This was a weekly gain of 3,308 contracts from the previous week which had a total of 73,635 net contracts.
This week’s current strength score (the trader positioning range over the past three years, measured from 0 to 100) shows the speculators are currently Bullish-Extreme with a score of 100.0 percent. The commercials are Bearish-Extreme with a score of 0.0 percent and the small traders (not shown in chart) are Bullish-Extreme with a score of 82.6 percent.
| MEXICAN PESO Statistics | SPECULATORS | COMMERCIALS | SMALL TRADERS |
| – Percent of Open Interest Longs: | 50.8 | 45.6 | 3.5 |
| – Percent of Open Interest Shorts: | 17.8 | 81.0 | 1.1 |
| – Net Position: | 76,943 | -82,616 | 5,673 |
| – Gross Longs: | 118,579 | 106,541 | 8,155 |
| – Gross Shorts: | 41,636 | 189,157 | 2,482 |
| – Long to Short Ratio: | 2.8 to 1 | 0.6 to 1 | 3.3 to 1 |
| NET POSITION TREND: | |||
| – Strength Index Score (3 Year Range Pct): | 100.0 | 0.0 | 82.6 |
| – Strength Index Reading (3 Year Range): | Bullish-Extreme | Bearish-Extreme | Bullish-Extreme |
| NET POSITION MOVEMENT INDEX: | |||
| – 6-Week Change in Strength Index: | 11.7 | -11.6 | 7.1 |
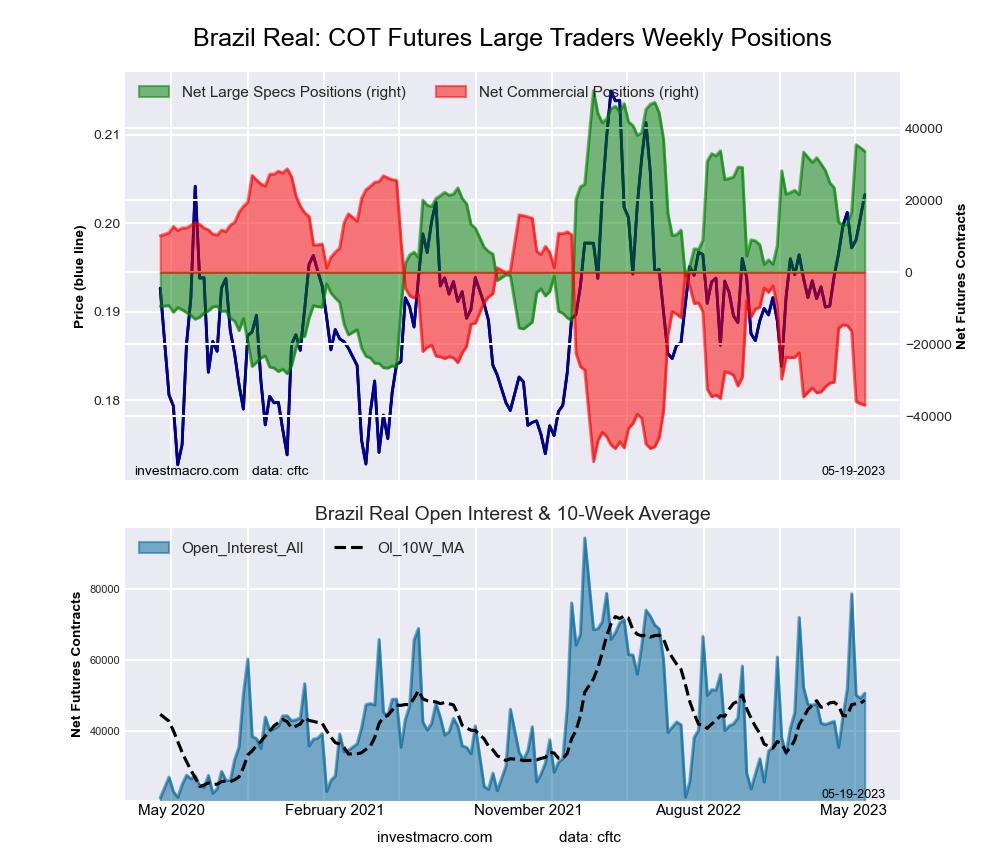
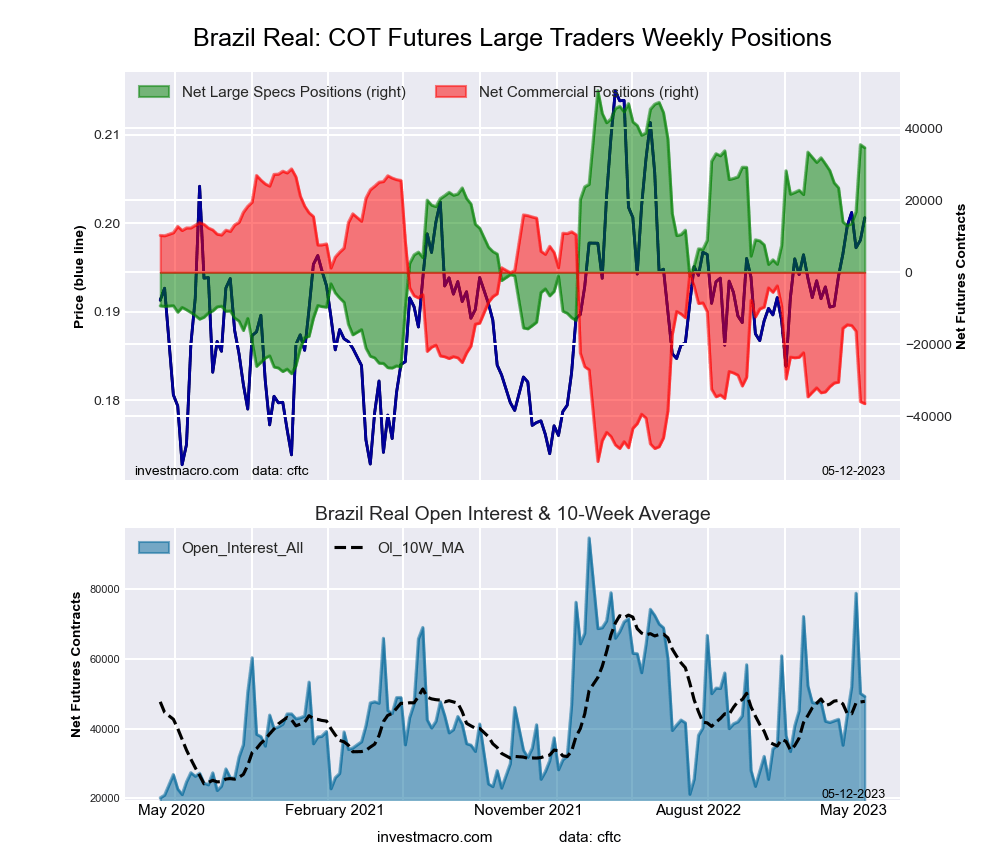
Brazilian Real Futures:
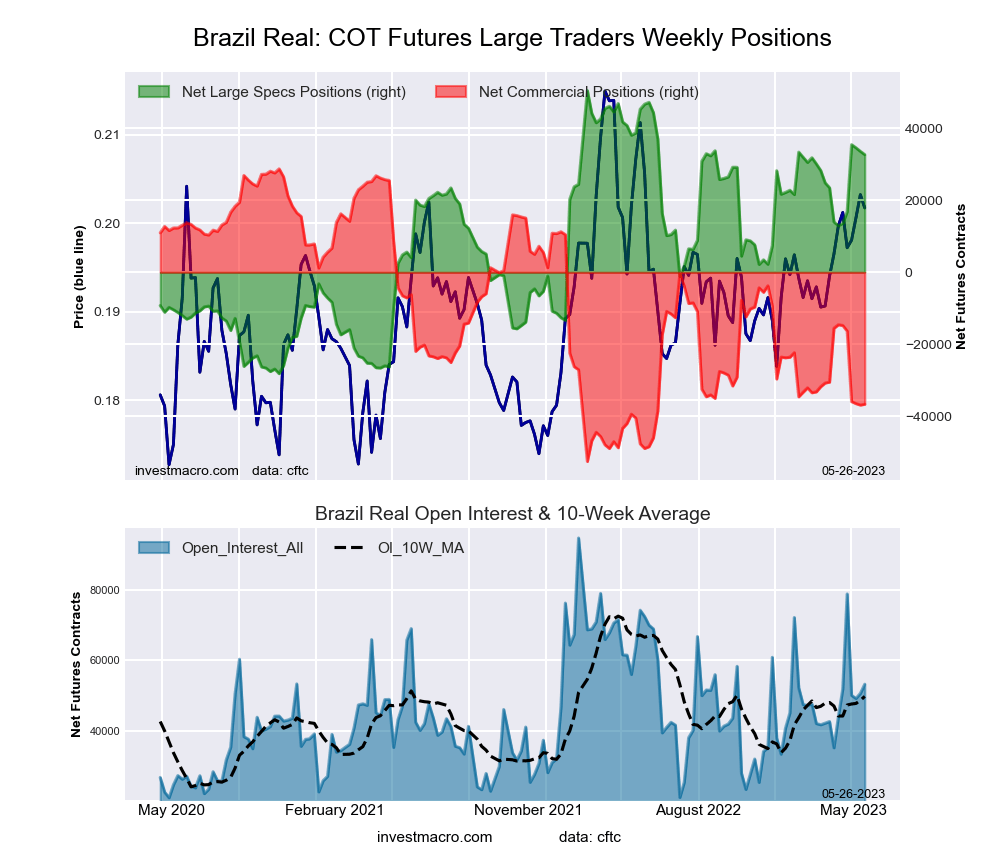 The Brazilian Real large speculator standing this week came in at a net position of 32,692 contracts in the data reported through Tuesday. This was a weekly fall of -914 contracts from the previous week which had a total of 33,606 net contracts.
This week’s current strength score (the trader positioning range over the past three years, measured from 0 to 100) shows the speculators are currently Bullish with a score of 77.4 percent. The commercials are Bearish-Extreme with a score of 19.5 percent and the small traders (not shown in chart) are Bullish with a score of 75.6 percent.
| BRAZIL REAL Statistics | SPECULATORS | COMMERCIALS | SMALL TRADERS |
| – Percent of Open Interest Longs: | 72.1 | 17.0 | 10.8 |
| – Percent of Open Interest Shorts: | 10.7 | 85.9 | 3.3 |
| – Net Position: | 32,692 | -36,671 | 3,979 |
| – Gross Longs: | 38,371 | 9,074 | 5,736 |
| – Gross Shorts: | 5,679 | 45,745 | 1,757 |
| – Long to Short Ratio: | 6.8 to 1 | 0.2 to 1 | 3.3 to 1 |
| NET POSITION TREND: | |||
| – Strength Index Score (3 Year Range Pct): | 77.4 | 19.5 | 75.6 |
| – Strength Index Reading (3 Year Range): | Bullish | Bearish-Extreme | Bullish |
| NET POSITION MOVEMENT INDEX: | |||
| – 6-Week Change in Strength Index: | 25.1 | -27.2 | 18.6 |
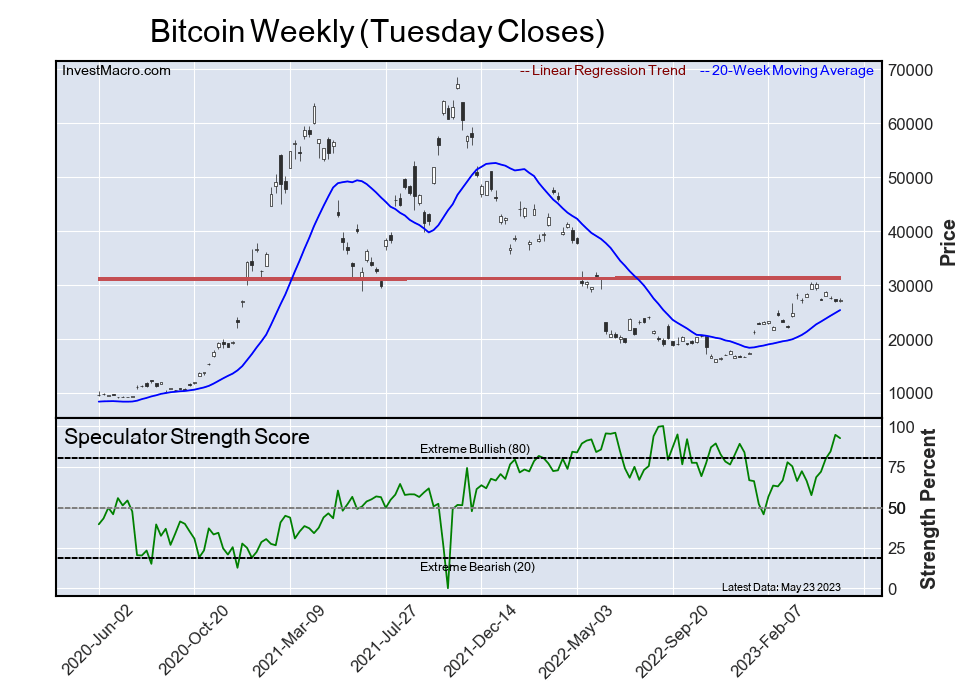
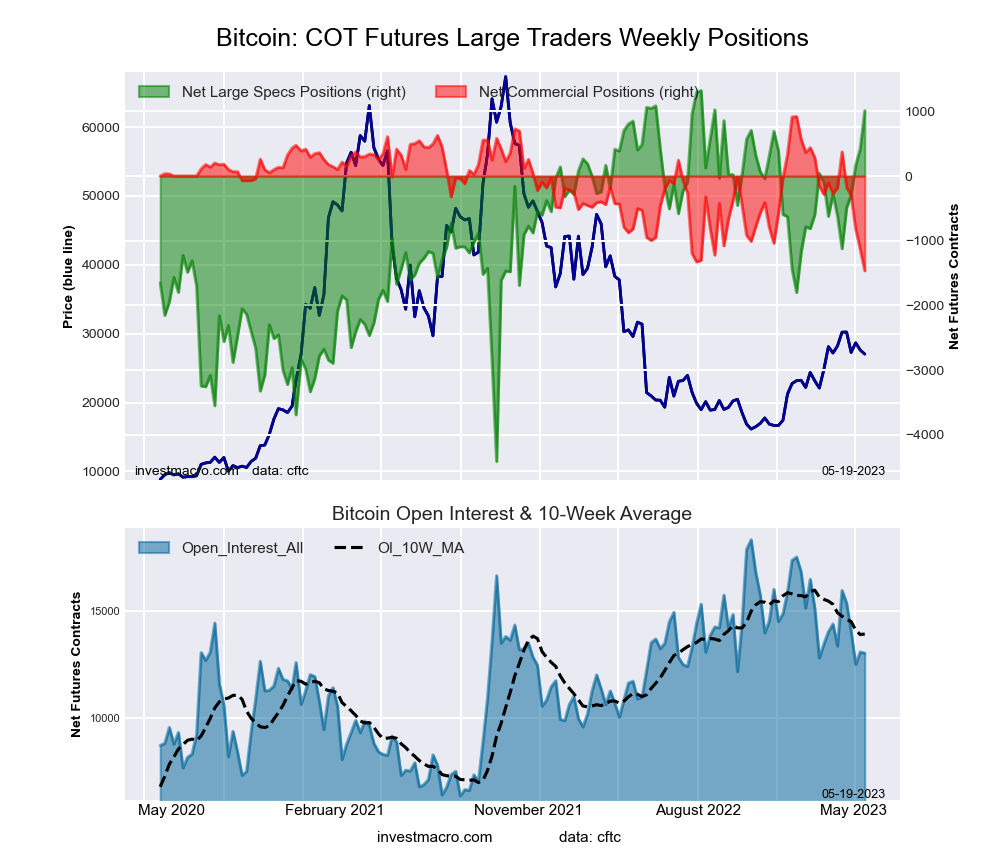
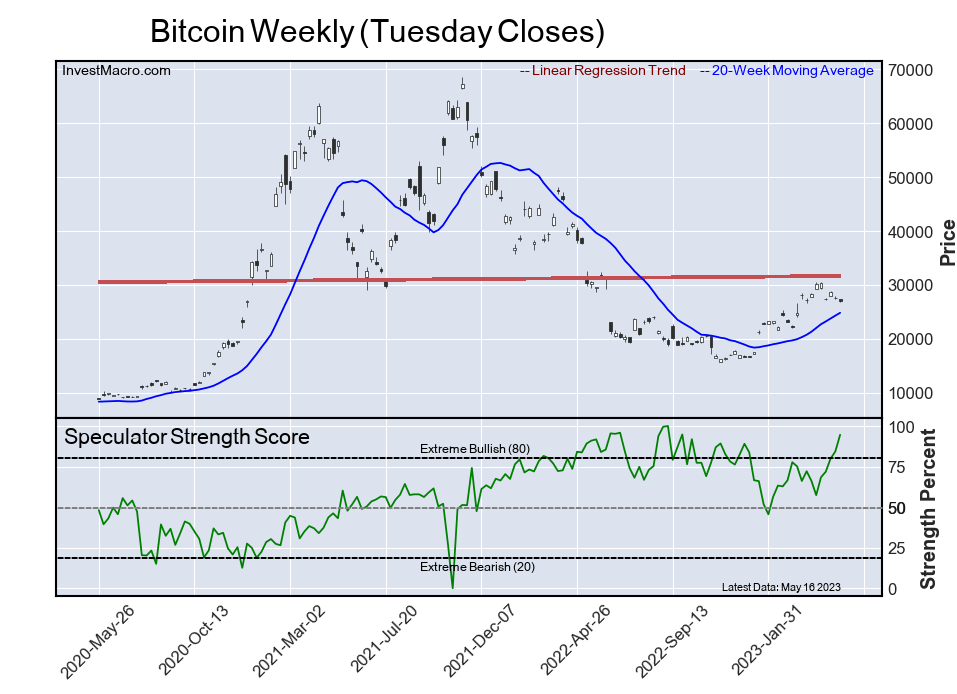
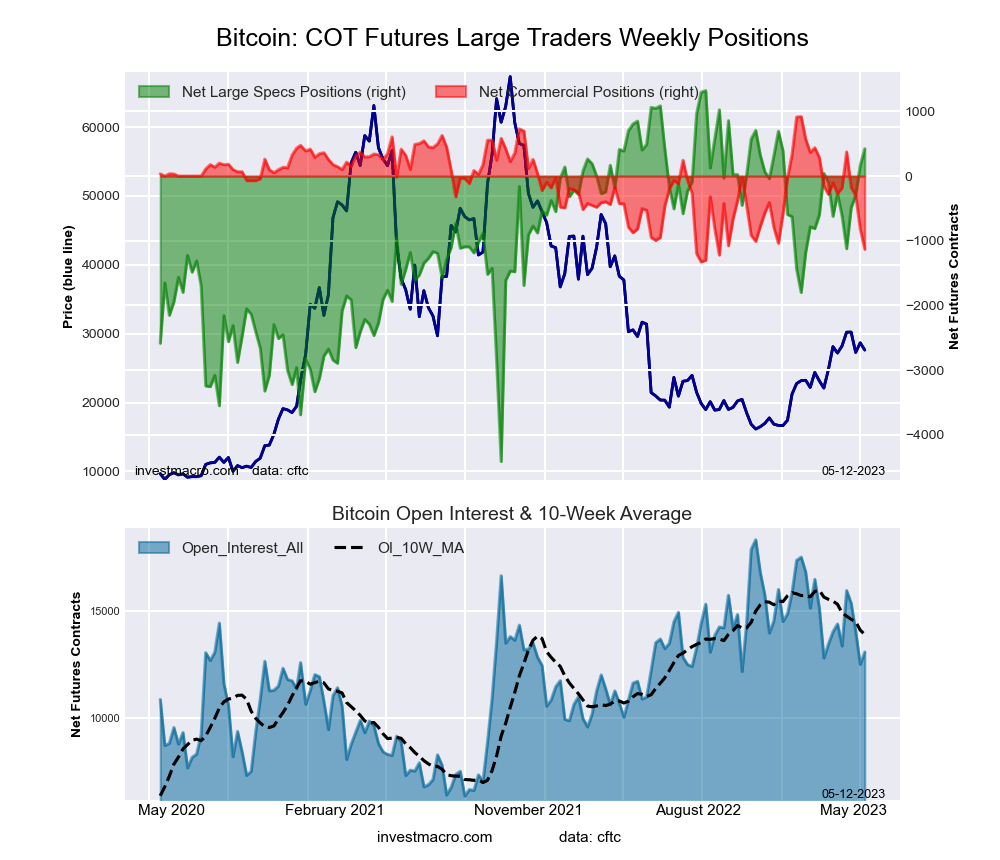
Bitcoin Futures:
 The Bitcoin large speculator standing this week came in at a net position of 893 contracts in the data reported through Tuesday. This was a weekly lowering of -118 contracts from the previous week which had a total of 1,011 net contracts.
This week’s current strength score (the trader positioning range over the past three years, measured from 0 to 100) shows the speculators are currently Bullish-Extreme with a score of 92.5 percent. The commercials are Bearish-Extreme with a score of 9.1 percent and the small traders (not shown in chart) are Bearish with a score of 20.9 percent.
| BITCOIN Statistics | SPECULATORS | COMMERCIALS | SMALL TRADERS |
| – Percent of Open Interest Longs: | 77.6 | 1.3 | 9.3 |
| – Percent of Open Interest Shorts: | 70.8 | 10.8 | 6.6 |
| – Net Position: | 893 | -1,245 | 352 |
| – Gross Longs: | 10,124 | 168 | 1,207 |
| – Gross Shorts: | 9,231 | 1,413 | 855 |
| – Long to Short Ratio: | 1.1 to 1 | 0.1 to 1 | 1.4 to 1 |
| NET POSITION TREND: | |||
| – Strength Index Score (3 Year Range Pct): | 92.5 | 9.1 | 20.9 |
| – Strength Index Reading (3 Year Range): | Bullish-Extreme | Bearish-Extreme | Bearish |
| NET POSITION MOVEMENT INDEX: | |||
| – 6-Week Change in Strength Index: | 35.1 | -67.9 | -9.0 |
Article By InvestMacro – Receive our weekly COT Newsletter
*COT Report: The COT data, released weekly to the public each Friday, is updated through the most recent Tuesday (data is 3 days old) and shows a quick view of how large speculators or non-commercials (for-profit traders) were positioned in the futures markets.
The CFTC categorizes trader positions according to commercial hedgers (traders who use futures contracts for hedging as part of the business), non-commercials (large traders who speculate to realize trading profits) and nonreportable traders (usually small traders/speculators) as well as their open interest (contracts open in the market at time of reporting). See CFTC criteria here.


