
By InvestMacro
The latest update for the weekly Commitment of Traders (COT) report was released by the Commodity Futures Trading Commission (CFTC) on Friday for data ending on May 16th.
This weekly Extreme Positions report highlights the Most Bullish and Most Bearish Positions for the speculator category. Extreme positioning in these markets can foreshadow strong moves in the underlying market.
To signify an extreme position, we use the Strength Index (also known as the COT Index) of each instrument, a common method of measuring COT data. The Strength Index is simply a comparison of current trader positions against the range of positions over the previous 3 years. We use over 80 percent as extremely bullish and under 20 percent as extremely bearish. (Compare Strength Index scores across all markets in the data table or cot leaders table)
Here Are This Week’s Most Bullish Speculator Positions:
Mexican Peso
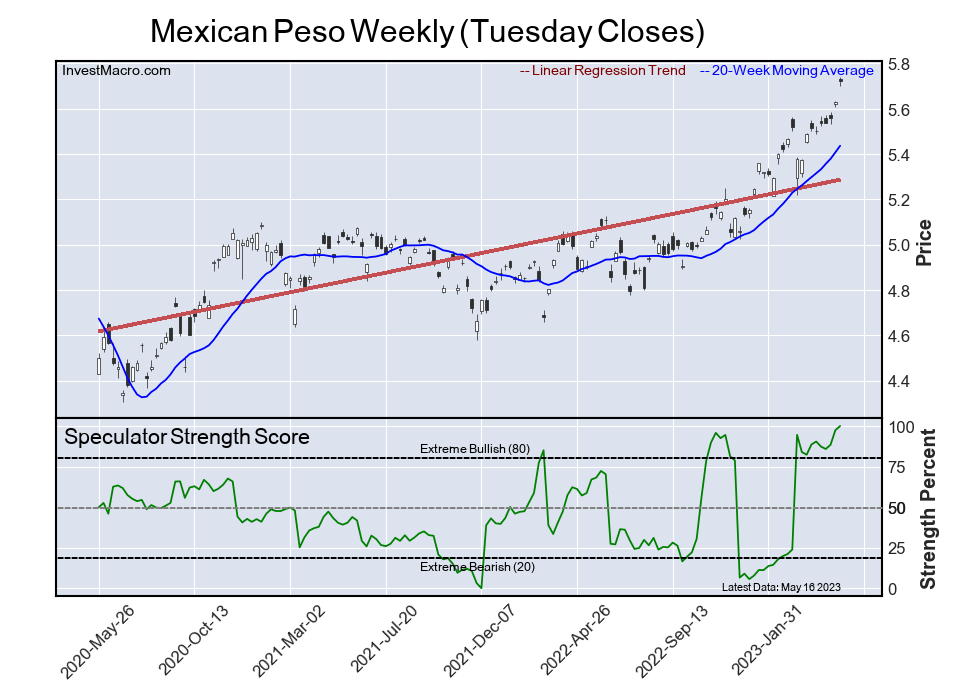
The Mexican Peso speculator position comes in as the most bullish extreme standing this week. The Mexican Peso speculator level is currently at a 100.0 percent score of its 3-year range.
Free Reports:
 Get our Weekly Commitment of Traders Reports - See where the biggest traders (Hedge Funds and Commercial Hedgers) are positioned in the futures markets on a weekly basis.
 Sign Up for Our Stock Market Newsletter – Get updated on News, Charts & Rankings of Public Companies when you join our Stocks Newsletter
The six-week trend for the percent strength score totaled 11.4 this week. The overall net speculator position was a total of 73,635 net contracts this week with a gain of 3,603 contract in the weekly speculator bets.
Bloomberg Commodity Index
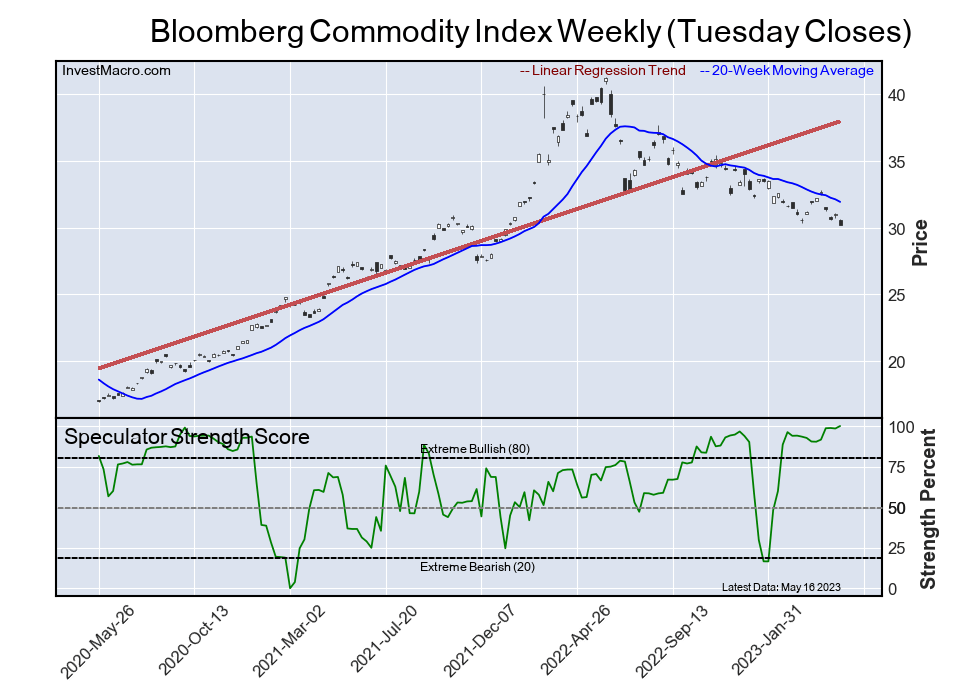
The Bloomberg Commodity Index speculator position comes next in the extreme standings this week. The Bloomberg Commodity Index speculator level is now at a 100.0 percent score of its 3-year range.
The six-week trend for the percent strength score was 9.6 this week. The speculator position registered -1,697 net contracts this week with a weekly rise of 404 contracts in speculator bets.
Cocoa Futures
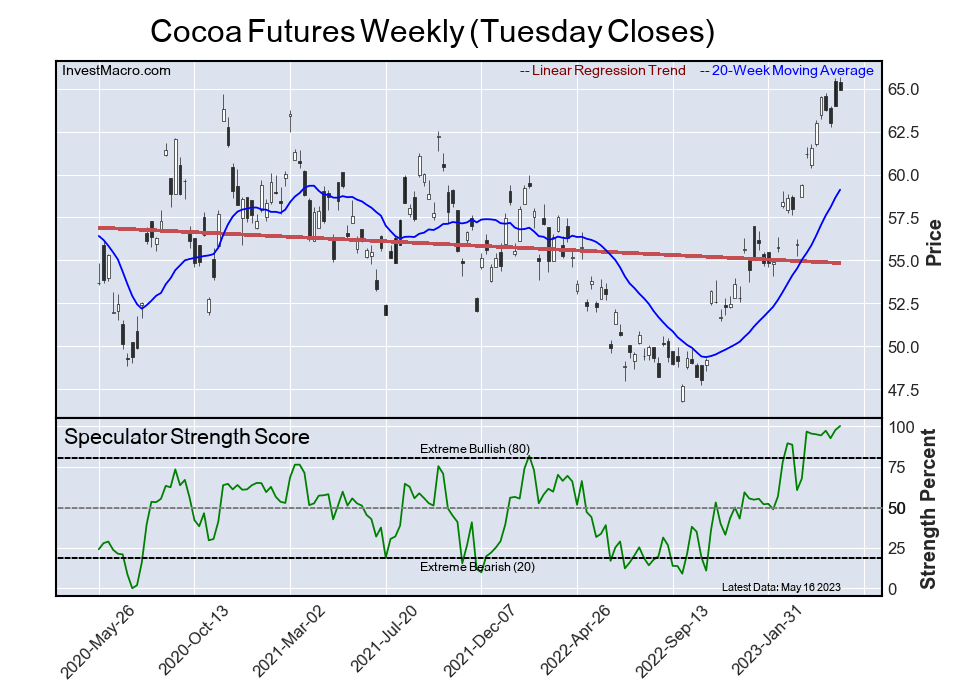
The Cocoa Futures speculator position comes in third this week in the extreme standings. The Cocoa Futures speculator level resides at a 100.0 percent score of its 3-year range.
The six-week trend for the speculator strength score came in at 4.7 this week. The overall speculator position was 64,055 net contracts this week with a gain of 2,026 contracts in the weekly speculator bets.
Bitcoin
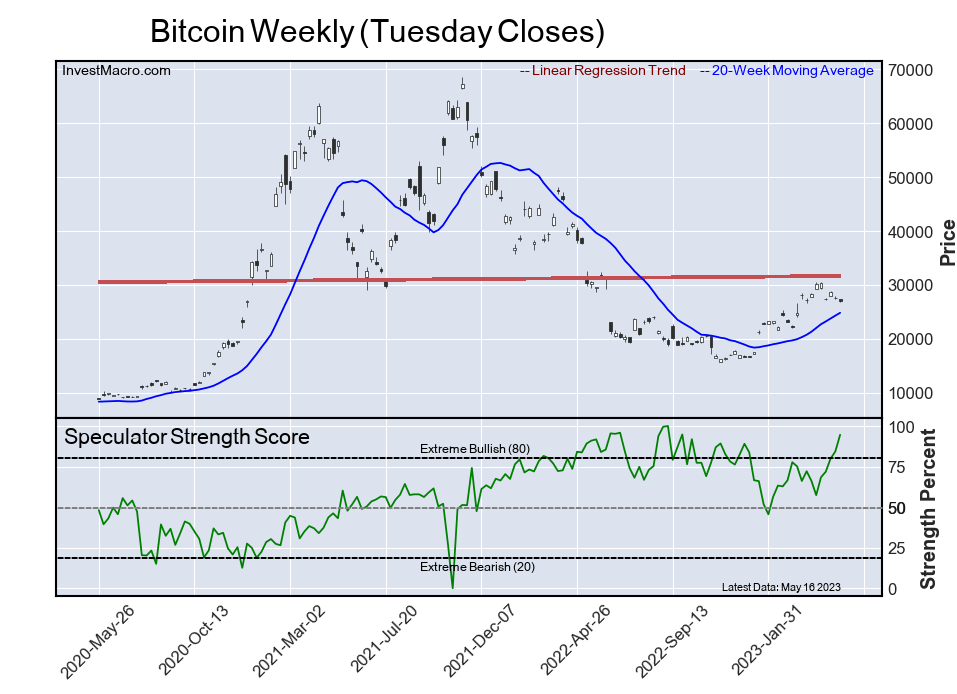
The Bitcoin speculator position comes up number four in the extreme standings this week. The Bitcoin speculator level is at a 94.6 percent score of its 3-year range.
The six-week trend for the speculator strength score totaled a change of 28.4 this week. The overall speculator position was 1,011 net contracts this week with an increase of 588 contracts in the speculator bets.
Live Cattle
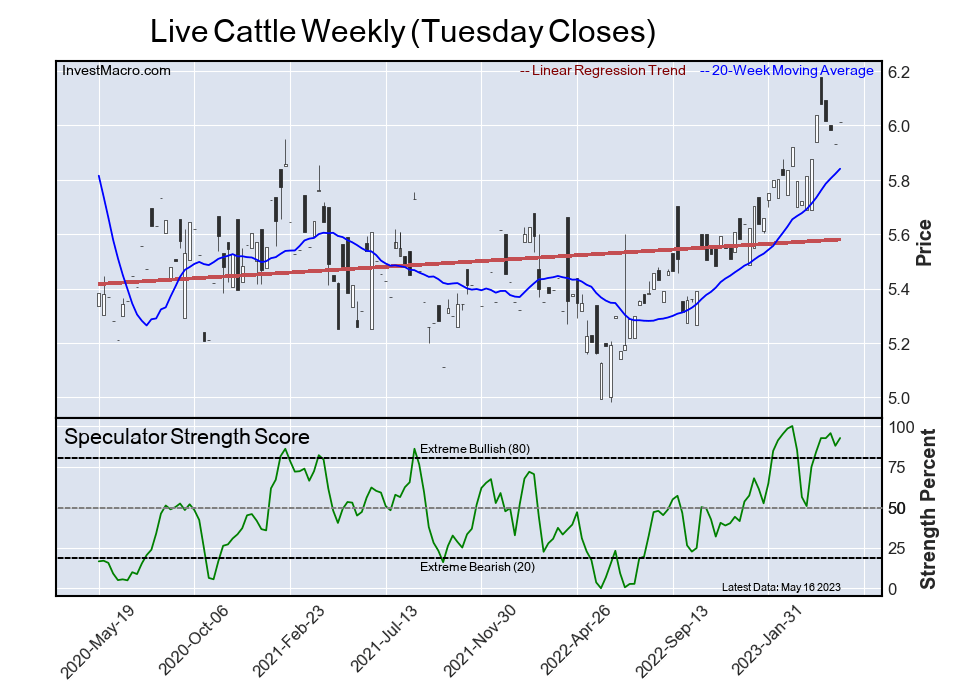
The Live Cattle speculator position rounds out the top five in this week’s bullish extreme standings. The Live Cattle speculator level sits at a 92.6 percent score of its 3-year range. The six-week trend for the speculator strength score was 17.9 this week.
The speculator position was 102,116 net contracts this week with a rise of 4,279 contracts in the weekly speculator bets.
This Week’s Most Bearish Speculator Positions:
Lean Hogs
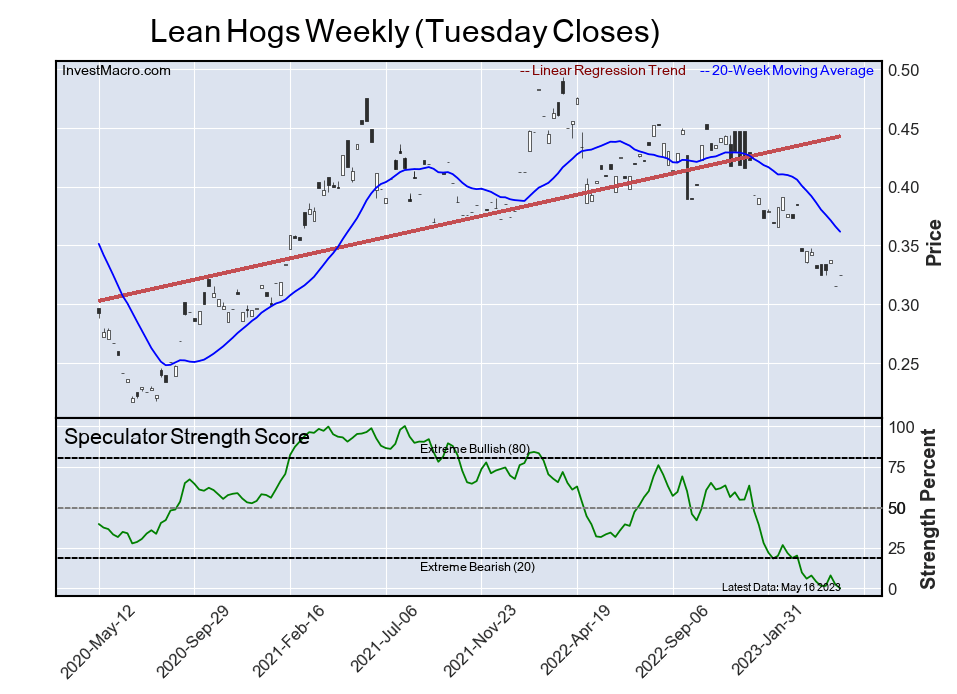
The Lean Hogs speculator position comes in as the most bearish extreme standing this week. The Lean Hogs speculator level is at a 0.0 percent score of its 3-year range.
The six-week trend for the speculator strength score was -7.8 this week. The overall speculator position was -28,734 net contracts this week with a decline of -2,659 contracts in the speculator bets.
Soybean Oil
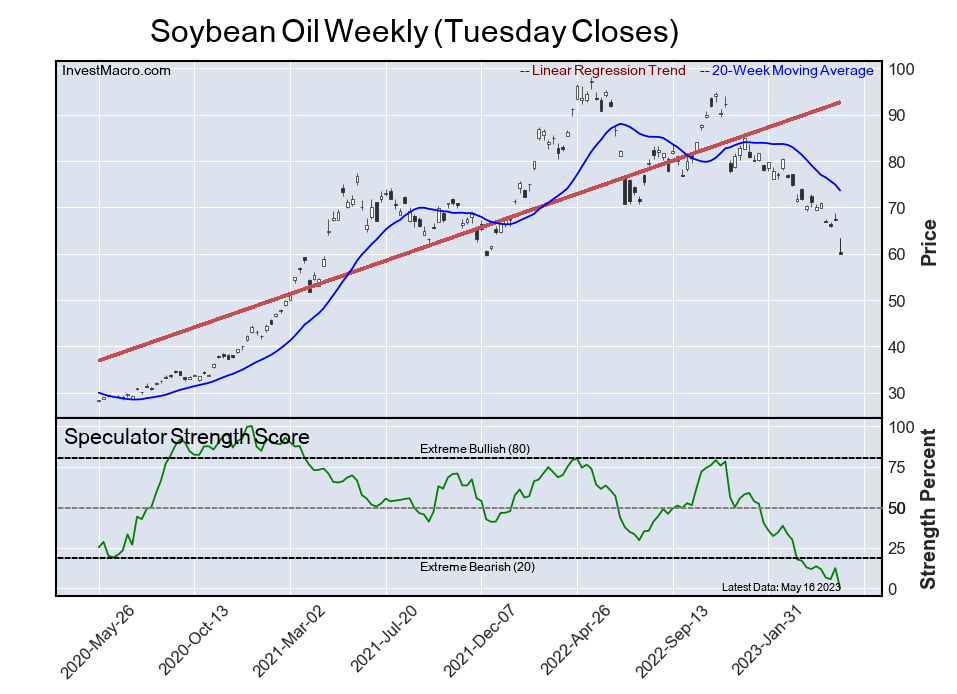
The Soybean Oil speculator position comes in next for the most bearish extreme standing on the week. The Soybean Oil speculator level is at a 0.0 percent score of its 3-year range.
The six-week trend for the speculator strength score was -11.8 this week. The speculator position was -29,483 net contracts this week with a drop of -21,208 contracts in the weekly speculator bets.
2-Year Bond
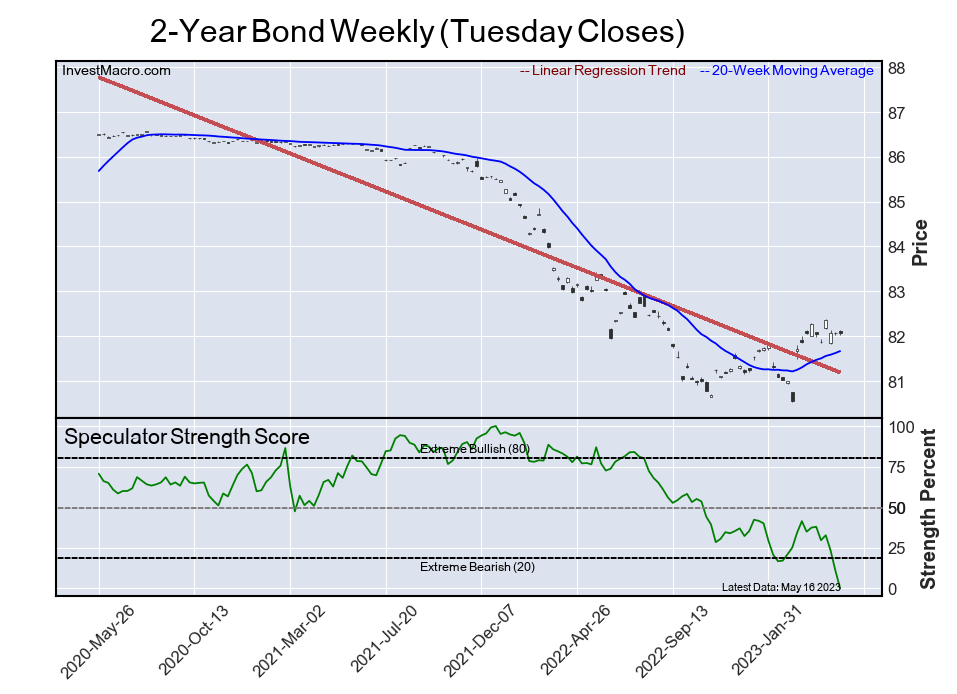
The 2-Year Bond speculator position comes in as third most bearish extreme standing of the week. The 2-Year Bond speculator level resides at a 0.0 percent score of its 3-year range.
The six-week trend for the speculator strength score was -37.3 this week. The overall speculator position was -853,575 net contracts this week with a decrease of -103,690 contracts in the speculator bets.
S&P500 Mini
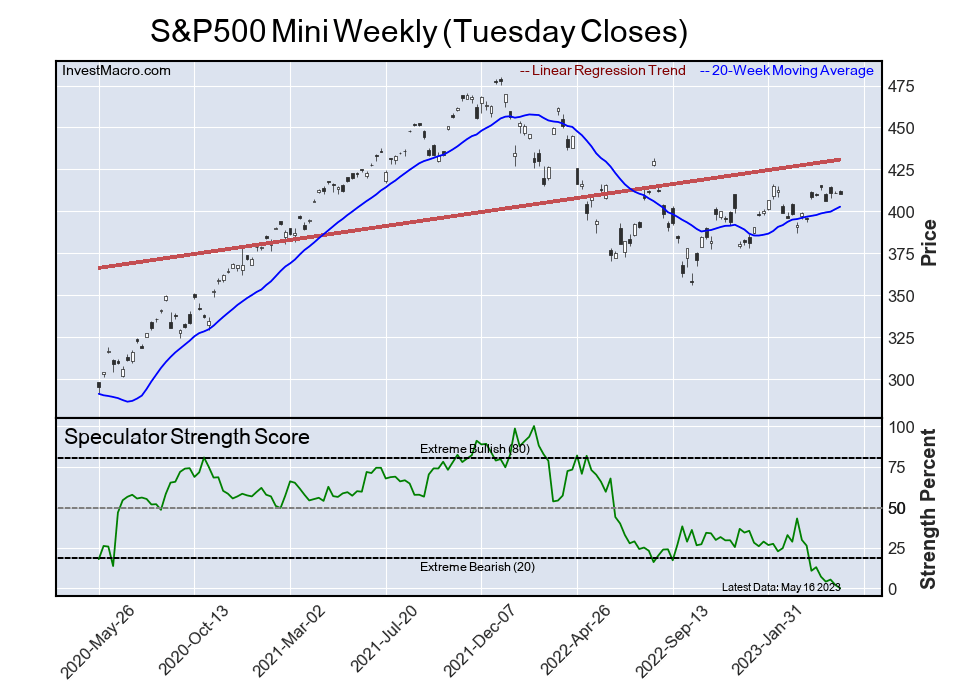
The S&P500 Mini speculator position comes in as this week’s fourth most bearish extreme standing. The S&P500 Mini speculator level is at a 0.0 percent score of its 3-year range.
The six-week trend for the speculator strength score was -10.8 this week. The speculator position was -388,721 net contracts this week with a shortfall of -12,698 contracts in the weekly speculator bets.
5-Year Bond
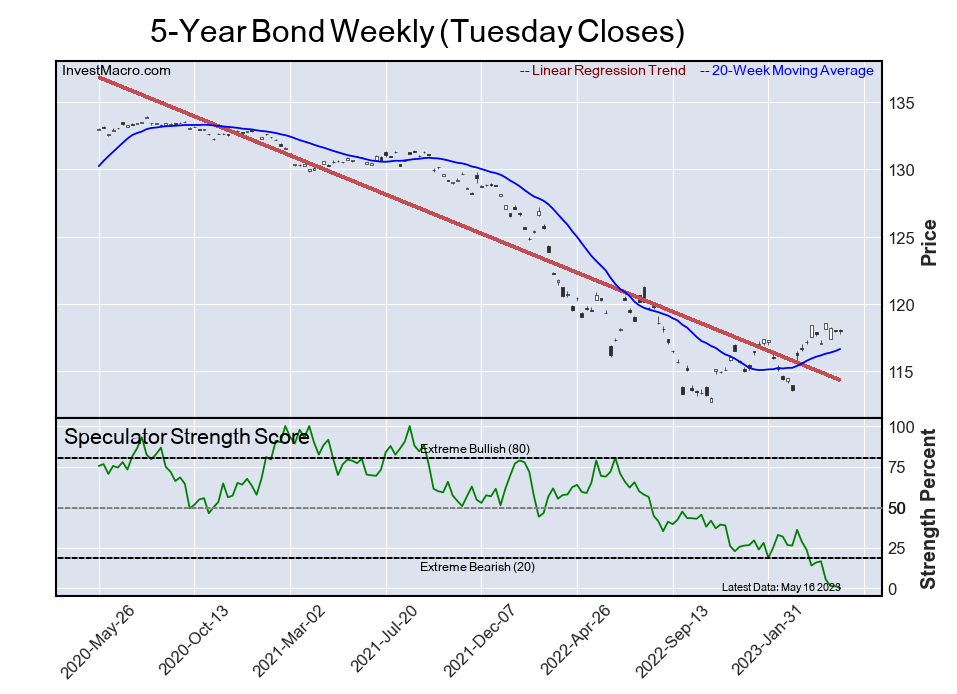
Finally, the 5-Year Bond speculator position comes in as the fifth most bearish extreme standing for this week. The 5-Year Bond speculator level is at a 0.0 percent score of its 3-year range.
The six-week trend for the speculator strength score was -14.0 this week. The speculator position was -923,913 net contracts this week with a drop of -13,271 contracts in the weekly speculator bets.
Article By InvestMacro – Receive our weekly COT Newsletter
Speculators or Non-Commercials Notes:
Speculators, classified as non-commercial traders by the CFTC, are made up of large commodity funds, hedge funds and other significant for-profit participants. The Specs are generally regarded as trend-followers in their behavior towards price action – net speculator bets and prices tend to go in the same directions. These traders often look to buy when prices are rising and sell when prices are falling. To illustrate this point, many times speculator contracts can be found at their most extremes (bullish or bearish) when prices are also close to their highest or lowest levels.
These extreme levels can be dangerous for the large speculators as the trade is most crowded, there is less trading ammunition still sitting on the sidelines to push the trend further and prices have moved a significant distance. When the trend becomes exhausted, some speculators take profits while others look to also exit positions when prices fail to continue in the same direction. This process usually plays out over many months to years and can ultimately create a reverse effect where prices start to fall and speculators start a process of selling when prices are falling.
*COT Report: The COT data, released weekly to the public each Friday, is updated through the most recent Tuesday (data is 3 days old) and shows a quick view of how large speculators or non-commercials (for-profit traders) were positioned in the futures markets.
The CFTC categorizes trader positions according to commercial hedgers (traders who use futures contracts for hedging as part of the business), non-commercials (large traders who speculate to realize trading profits) and nonreportable traders (usually small traders/speculators) as well as their open interest (contracts open in the market at time of reporting). See CFTC criteria here.

- Geopolitical and macroeconomic conditions continue to pressure market sentiment Jul 20, 2026
- USD/JPY Poised to Continue Gains as Expensive Oil and Lack of Support Weigh on Yen Jul 20, 2026
- COT Metals Charts: Weekly Speculator Bets led by Copper & Steel Jul 18, 2026
- COT Bonds Charts: Weekly Speculator Bets led by 2-Year, SOFR 3M & 5-Year Bonds Jul 18, 2026
- COT Energy Charts: Weekly Speculator Bets led by Brent Oil & Heating Oil Jul 18, 2026
- COT Soft Commodities Charts: Weekly Speculator Bets led by Wheat, Corn & Soybean Meal Jul 18, 2026
- The Bank of Canada kept its interest rate unchanged. Platinum prices reached a three‑week high Jul 16, 2026
- Stock indices rose after the release of US inflation data. China’s GDP slowed sharply Jul 15, 2026
- GBP/USD Awaits Political News: What Will Happen Next Jul 15, 2026
- USD/JPY Holds at Highs: Pressure Lingers on Yen Jul 14, 2026