
By InvestMacro
Here are the latest charts and statistics for the Commitment of Traders (COT) reports data published by the Commodities Futures Trading Commission (CFTC).
The latest COT data is updated through Tuesday May 23rd and shows a quick view of how large traders (for-profit speculators and commercial entities) were positioned in the futures markets.
Weekly Speculator Changes led by Cotton & Sugar
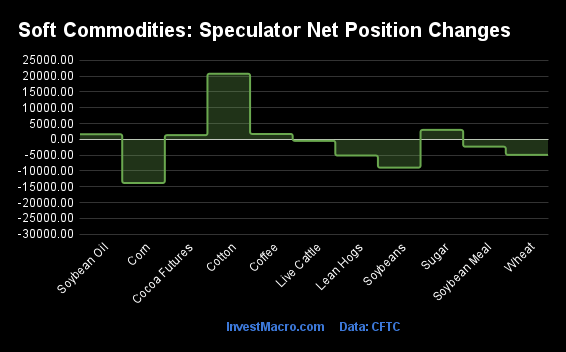
The COT soft commodities markets speculator bets were lower this week as five out of the eleven softs markets we cover had higher positioning while the other six markets had lower speculator contracts.
Free Reports:
 Download Our Metatrader 4 Indicators – Put Our Free MetaTrader 4 Custom Indicators on your charts when you join our Weekly Newsletter
 Get our Weekly Commitment of Traders Reports - See where the biggest traders (Hedge Funds and Commercial Hedgers) are positioned in the futures markets on a weekly basis.
Leading the gains for the softs markets was Cotton (20,764 contracts) with Sugar (2,981 contracts), Coffee (1,713 contracts), Soybean Oil (1,620 contracts) and Cocoa (1,319 contracts) also showing positive weeks.
The markets with the declines in speculator bets this week were Corn (-13,808 contracts) with Soybeans (-8,949 contracts), Soybean Meal (-2,319 contracts), Wheat (-4,907 contracts), Live Cattle (-469 contracts) and Lean Hogs (-5,118 contracts) also registering lower bets on the week.
Highlights of Weekly positions:
Cotton speculative bets this week (+20,764 contracts) jumped by the highest weekly amount in over a year. This has brought the current speculator standing to the most bullish level (+22,319 contracts) since October of 2021. Cotton prices have had a big downfall since their highs in May of 2022 with a peak-to-trough drop of over 50 percent but looked to have bottomed for the time being.
Soybeans bets have dropped sharply over the past two months with speculator positions falling for seven straight weeks. The current net position for Soybeans is at the lowest level since November of 2021 due to an expectation of a record crop in the United States.
Wheat speculator bets dipped again this week and have declined in ten out of the past fourteen weeks. Wheat prices have cooled off markedly since screaming higher at the onset of the Russian invasion of Ukraine. The futures price has fallen over 50 percent from the highest levels of 2022 and has recently crossed below the 200-week moving average.
Corn speculator positions declined this week and have now fallen by a total of -167,903 contracts over the past 5-week period. This recent bearishness has brought the speculator positioning into an overall bearish level for the first time since August of 2020. Like many of the other agriculture soft commodities, Corn prices are down from their 2022 highs with the current Corn level lower by about 25 percent from May 2022.
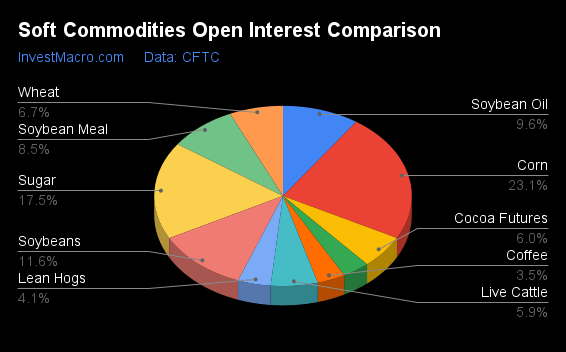
| May-23-2023 | OI | OI-Index | Spec-Net | Spec-Index | Com-Net | COM-Index | Smalls-Net | Smalls-Index |
|---|---|---|---|---|---|---|---|---|
| WTI Crude | 1,847,901 | 40 | 193,119 | 9 | -217,386 | 91 | 24,267 | 28 |
| Gold | 479,080 | 26 | 160,732 | 48 | -187,023 | 52 | 26,291 | 46 |
| Silver | 135,740 | 21 | 21,958 | 50 | -34,972 | 52 | 13,014 | 39 |
| Copper | 215,394 | 55 | -29,808 | 2 | 27,496 | 97 | 2,312 | 33 |
| Palladium | 11,138 | 71 | -5,289 | 17 | 5,669 | 85 | -380 | 19 |
| Platinum | 73,079 | 82 | 27,479 | 79 | -32,157 | 27 | 4,678 | 31 |
| Natural Gas | 1,338,868 | 76 | -112,278 | 27 | 80,837 | 72 | 31,441 | 55 |
| Brent | 146,776 | 19 | -47,806 | 10 | 45,210 | 92 | 2,596 | 44 |
| Heating Oil | 306,360 | 39 | 9,097 | 43 | -16,705 | 80 | 7,608 | 25 |
| Soybeans | 651,248 | 17 | 29,205 | 1 | -2,404 | 96 | -26,801 | 28 |
| Corn | 1,299,841 | 14 | -62,267 | 22 | 115,832 | 88 | -53,565 | 23 |
| Coffee | 198,683 | 11 | 32,748 | 61 | -33,373 | 43 | 625 | 20 |
| Sugar | 983,887 | 67 | 273,810 | 88 | -323,323 | 11 | 49,513 | 67 |
| Wheat | 379,453 | 54 | -86,319 | 3 | 80,586 | 98 | 5,733 | 93 |
Strength Scores led by Cocoa & Live Cattle
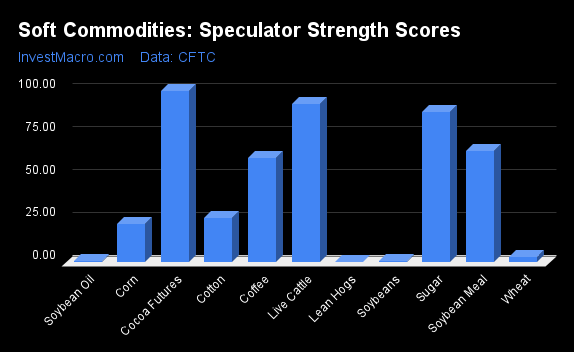
COT Strength Scores (a normalized measure of Speculator positions over a 3-Year range, from 0 to 100 where above 80 is Extreme-Bullish and below 20 is Extreme-Bearish) showed that Cocoa (100 percent) and Live Cattle (92 percent) lead the softs markets this week. Sugar (88 percent), Soybean Meal (65 percent) and Coffee (61 percent) come in as the next highest in the weekly strength scores.
On the downside, Lean Hogs (0 percent), Soybean Oil (1 percent), Soybeans (1 percent) and the Wheat (3 percent) come in at the lowest strength levels currently and are in Extreme-Bearish territory (below 20 percent).
Strength Statistics:
Corn (22.1 percent) vs Corn previous week (23.8 percent)
Sugar (87.7 percent) vs Sugar previous week (86.7 percent)
Coffee (61.0 percent) vs Coffee previous week (59.3 percent)
Soybeans (0.6 percent) vs Soybeans previous week (4.2 percent)
Soybean Oil (0.9 percent) vs Soybean Oil previous week (0.0 percent)
Soybean Meal (65.1 percent) vs Soybean Meal previous week (66.3 percent)
Live Cattle (92.1 percent) vs Live Cattle previous week (92.6 percent)
Lean Hogs (0.0 percent) vs Lean Hogs previous week (4.3 percent)
Cotton (25.5 percent) vs Cotton previous week (9.9 percent)
Cocoa (100.0 percent) vs Cocoa previous week (98.4 percent)
Wheat (2.8 percent) vs Wheat previous week (6.4 percent)
Cotton & Coffee top the 6-Week Strength Trends
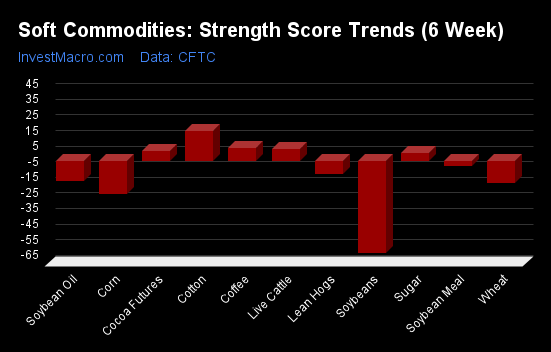
COT Strength Score Trends (or move index, calculates the 6-week changes in strength scores) showed that Cotton (19 percent) and Coffee (8 percent) lead the past six weeks trends for soft commodities. Live Cattle (8 percent), Cocoa (7 percent) and Sugar (5 percent) are the next highest positive movers in the latest trends data.
Soybeans (-59 percent) leads the downside trend scores currently with Corn (-21 percent), Wheat (-14 percent) and Soybean Oil (-13 percent) following next with lower trend scores.
Strength Trend Statistics:
Corn (-21.2 percent) vs Corn previous week (-17.1 percent)
Sugar (5.0 percent) vs Sugar previous week (8.6 percent)
Coffee (8.1 percent) vs Coffee previous week (18.9 percent)
Soybeans (-59.0 percent) vs Soybeans previous week (-57.4 percent)
Soybean Oil (-12.6 percent) vs Soybean Oil previous week (-11.8 percent)
Soybean Meal (-3.1 percent) vs Soybean Meal previous week (-0.4 percent)
Live Cattle (7.9 percent) vs Live Cattle previous week (17.9 percent)
Lean Hogs (-8.2 percent) vs Lean Hogs previous week (-7.5 percent)
Cotton (19.3 percent) vs Cotton previous week (6.2 percent)
Cocoa (6.6 percent) vs Cocoa previous week (4.6 percent)
Wheat (-14.3 percent) vs Wheat previous week (-15.0 percent)
Individual Soft Commodities Markets:
CORN Futures:
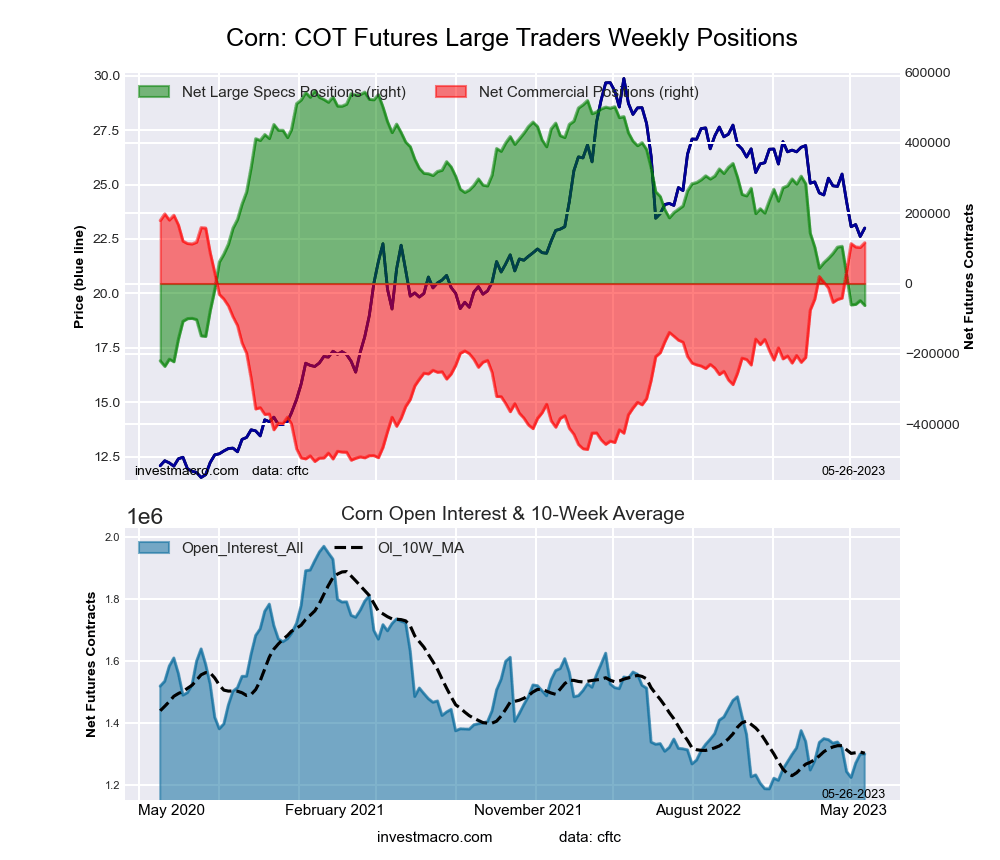 The CORN large speculator standing this week equaled a net position of -62,267 contracts in the data reported through Tuesday. This was a weekly lowering of -13,808 contracts from the previous week which had a total of -48,459 net contracts.
This week’s current strength score (the trader positioning range over the past three years, measured from 0 to 100) shows the speculators are currently Bearish with a score of 22.1 percent. The commercials are Bullish-Extreme with a score of 88.4 percent and the small traders (not shown in chart) are Bearish with a score of 22.6 percent.
| CORN Futures Statistics | SPECULATORS | COMMERCIALS | SMALL TRADERS |
| – Percent of Open Interest Longs: | 21.8 | 52.5 | 9.0 |
| – Percent of Open Interest Shorts: | 26.6 | 43.6 | 13.1 |
| – Net Position: | -62,267 | 115,832 | -53,565 |
| – Gross Longs: | 282,880 | 682,886 | 116,884 |
| – Gross Shorts: | 345,147 | 567,054 | 170,449 |
| – Long to Short Ratio: | 0.8 to 1 | 1.2 to 1 | 0.7 to 1 |
| NET POSITION TREND: | |||
| – Strength Index Score (3 Year Range Pct): | 22.1 | 88.4 | 22.6 |
| – Strength Index Reading (3 Year Range): | Bearish | Bullish-Extreme | Bearish |
| NET POSITION MOVEMENT INDEX: | |||
| – 6-Week Change in Strength Index: | -21.2 | 22.9 | 3.7 |
SUGAR Futures:
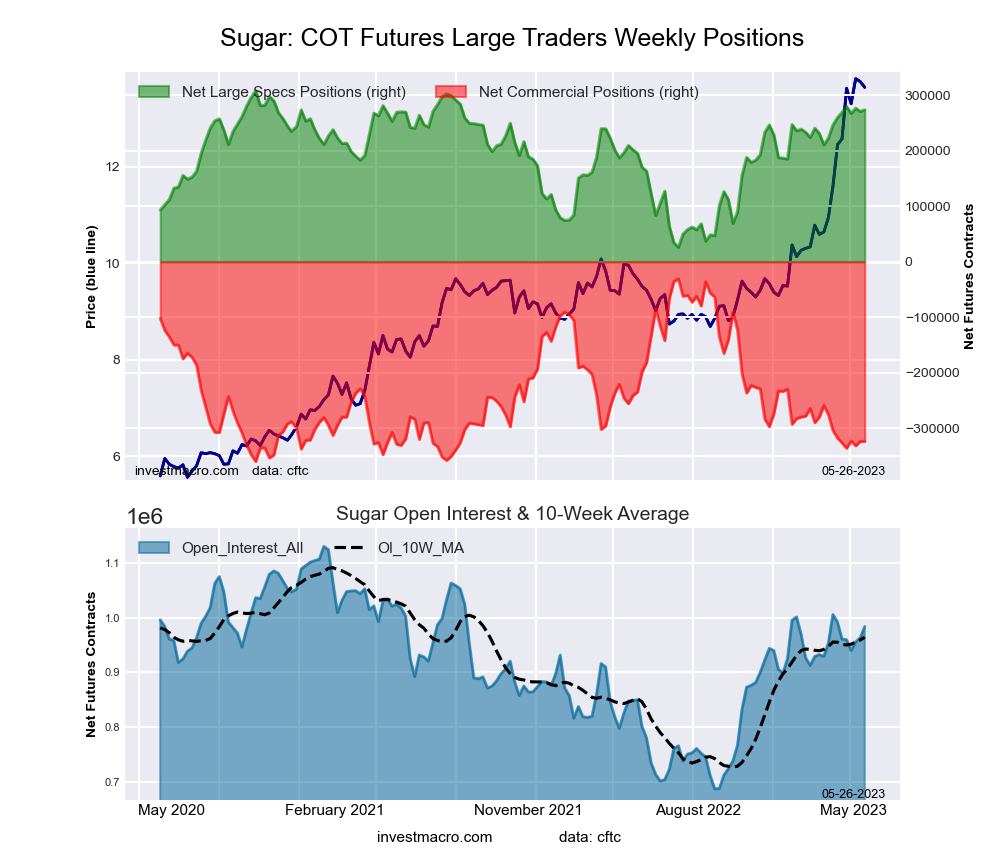 The SUGAR large speculator standing this week equaled a net position of 273,810 contracts in the data reported through Tuesday. This was a weekly increase of 2,981 contracts from the previous week which had a total of 270,829 net contracts.
This week’s current strength score (the trader positioning range over the past three years, measured from 0 to 100) shows the speculators are currently Bullish-Extreme with a score of 87.7 percent. The commercials are Bearish-Extreme with a score of 11.0 percent and the small traders (not shown in chart) are Bullish with a score of 67.1 percent.
| SUGAR Futures Statistics | SPECULATORS | COMMERCIALS | SMALL TRADERS |
| – Percent of Open Interest Longs: | 35.6 | 39.2 | 9.4 |
| – Percent of Open Interest Shorts: | 7.8 | 72.1 | 4.3 |
| – Net Position: | 273,810 | -323,323 | 49,513 |
| – Gross Longs: | 350,244 | 386,150 | 92,284 |
| – Gross Shorts: | 76,434 | 709,473 | 42,771 |
| – Long to Short Ratio: | 4.6 to 1 | 0.5 to 1 | 2.2 to 1 |
| NET POSITION TREND: | |||
| – Strength Index Score (3 Year Range Pct): | 87.7 | 11.0 | 67.1 |
| – Strength Index Reading (3 Year Range): | Bullish-Extreme | Bearish-Extreme | Bullish |
| NET POSITION MOVEMENT INDEX: | |||
| – 6-Week Change in Strength Index: | 5.0 | -1.8 | -10.5 |
COFFEE Futures:
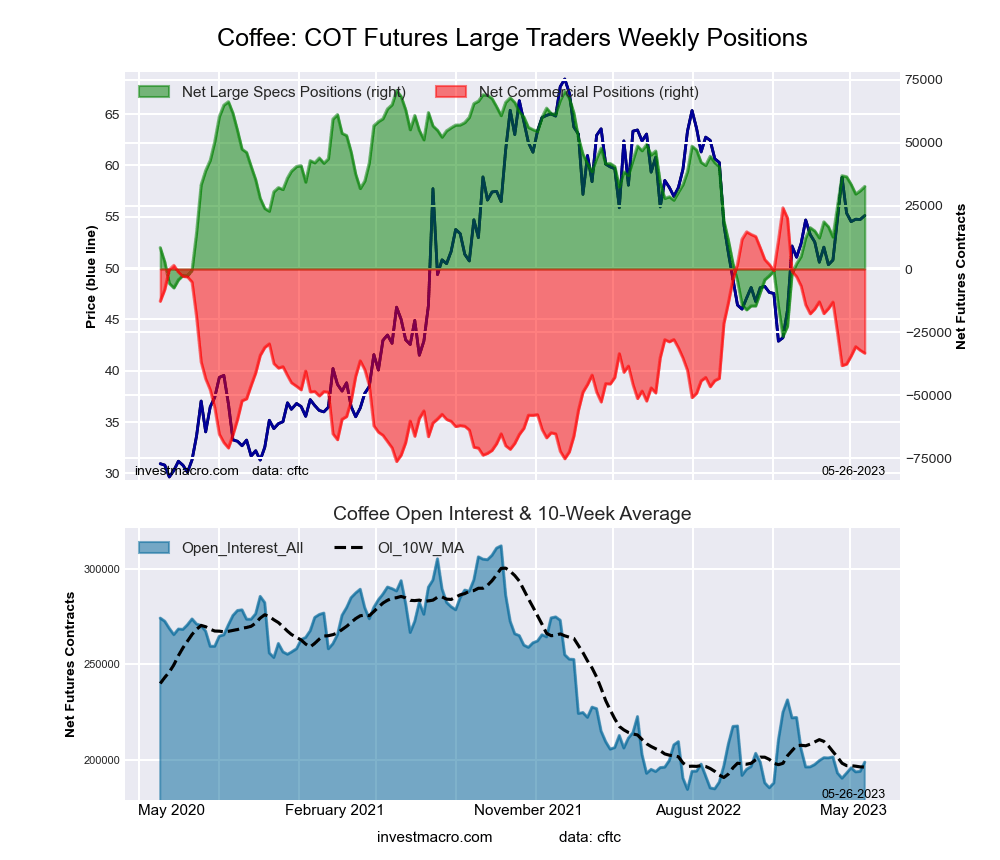 The COFFEE large speculator standing this week equaled a net position of 32,748 contracts in the data reported through Tuesday. This was a weekly gain of 1,713 contracts from the previous week which had a total of 31,035 net contracts.
This week’s current strength score (the trader positioning range over the past three years, measured from 0 to 100) shows the speculators are currently Bullish with a score of 61.0 percent. The commercials are Bearish with a score of 42.7 percent and the small traders (not shown in chart) are Bearish with a score of 20.2 percent.
| COFFEE Futures Statistics | SPECULATORS | COMMERCIALS | SMALL TRADERS |
| – Percent of Open Interest Longs: | 27.0 | 44.6 | 3.7 |
| – Percent of Open Interest Shorts: | 10.5 | 61.4 | 3.3 |
| – Net Position: | 32,748 | -33,373 | 625 |
| – Gross Longs: | 53,687 | 88,628 | 7,267 |
| – Gross Shorts: | 20,939 | 122,001 | 6,642 |
| – Long to Short Ratio: | 2.6 to 1 | 0.7 to 1 | 1.1 to 1 |
| NET POSITION TREND: | |||
| – Strength Index Score (3 Year Range Pct): | 61.0 | 42.7 | 20.2 |
| – Strength Index Reading (3 Year Range): | Bullish | Bearish | Bearish |
| NET POSITION MOVEMENT INDEX: | |||
| – 6-Week Change in Strength Index: | 8.1 | -8.1 | 3.2 |
SOYBEANS Futures:
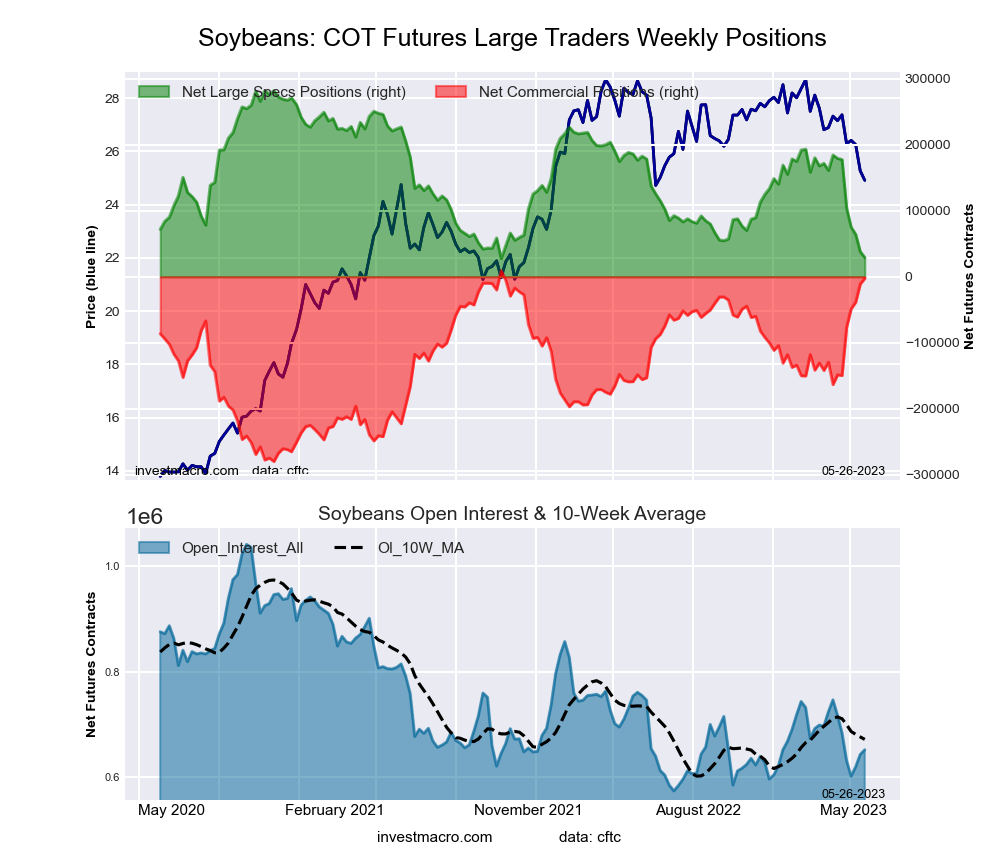 The SOYBEANS large speculator standing this week equaled a net position of 29,205 contracts in the data reported through Tuesday. This was a weekly lowering of -8,949 contracts from the previous week which had a total of 38,154 net contracts.
This week’s current strength score (the trader positioning range over the past three years, measured from 0 to 100) shows the speculators are currently Bearish-Extreme with a score of 0.6 percent. The commercials are Bullish-Extreme with a score of 96.0 percent and the small traders (not shown in chart) are Bearish with a score of 28.4 percent.
| SOYBEANS Futures Statistics | SPECULATORS | COMMERCIALS | SMALL TRADERS |
| – Percent of Open Interest Longs: | 21.3 | 53.9 | 6.8 |
| – Percent of Open Interest Shorts: | 16.8 | 54.3 | 11.0 |
| – Net Position: | 29,205 | -2,404 | -26,801 |
| – Gross Longs: | 138,687 | 351,024 | 44,581 |
| – Gross Shorts: | 109,482 | 353,428 | 71,382 |
| – Long to Short Ratio: | 1.3 to 1 | 1.0 to 1 | 0.6 to 1 |
| NET POSITION TREND: | |||
| – Strength Index Score (3 Year Range Pct): | 0.6 | 96.0 | 28.4 |
| – Strength Index Reading (3 Year Range): | Bearish-Extreme | Bullish-Extreme | Bearish |
| NET POSITION MOVEMENT INDEX: | |||
| – 6-Week Change in Strength Index: | -59.0 | 50.6 | 7.0 |
SOYBEAN OIL Futures:
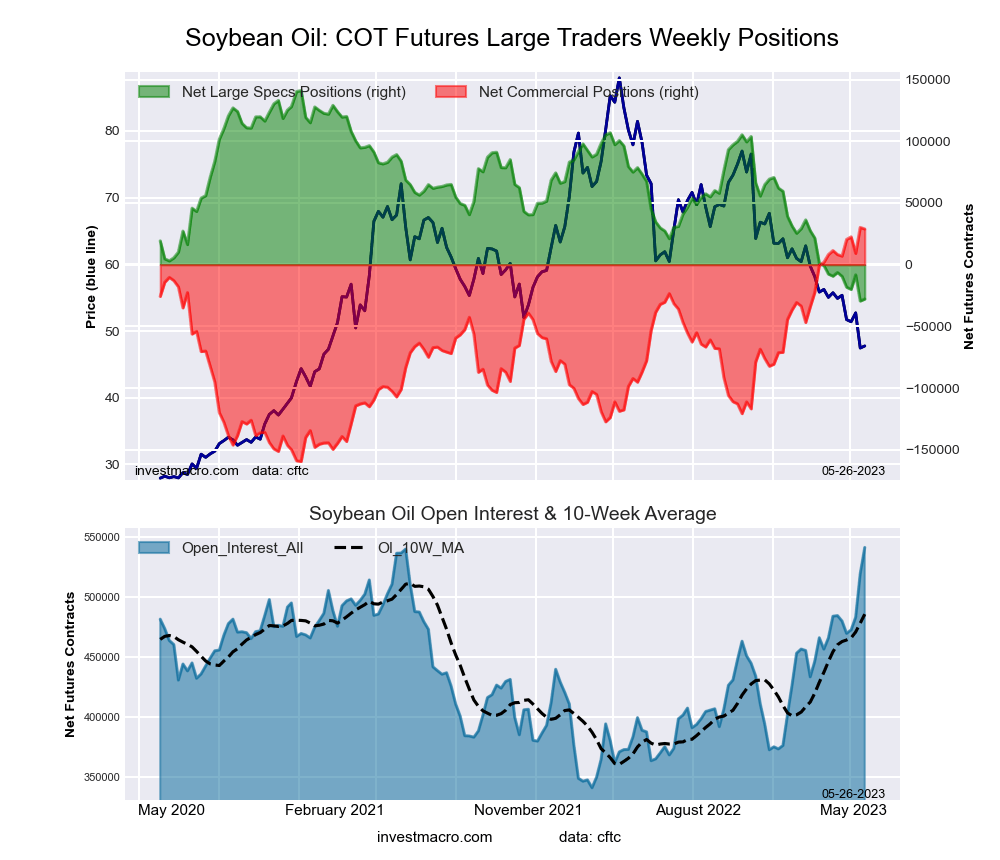 The SOYBEAN OIL large speculator standing this week equaled a net position of -27,863 contracts in the data reported through Tuesday. This was a weekly lift of 1,620 contracts from the previous week which had a total of -29,483 net contracts.
This week’s current strength score (the trader positioning range over the past three years, measured from 0 to 100) shows the speculators are currently Bearish-Extreme with a score of 0.9 percent. The commercials are Bullish-Extreme with a score of 99.3 percent and the small traders (not shown in chart) are Bearish-Extreme with a score of 5.6 percent.
| SOYBEAN OIL Futures Statistics | SPECULATORS | COMMERCIALS | SMALL TRADERS |
| – Percent of Open Interest Longs: | 16.0 | 55.8 | 5.6 |
| – Percent of Open Interest Shorts: | 21.2 | 50.5 | 5.8 |
| – Net Position: | -27,863 | 28,911 | -1,048 |
| – Gross Longs: | 86,842 | 302,248 | 30,161 |
| – Gross Shorts: | 114,705 | 273,337 | 31,209 |
| – Long to Short Ratio: | 0.8 to 1 | 1.1 to 1 | 1.0 to 1 |
| NET POSITION TREND: | |||
| – Strength Index Score (3 Year Range Pct): | 0.9 | 99.3 | 5.6 |
| – Strength Index Reading (3 Year Range): | Bearish-Extreme | Bullish-Extreme | Bearish-Extreme |
| NET POSITION MOVEMENT INDEX: | |||
| – 6-Week Change in Strength Index: | -12.6 | 10.9 | 3.0 |
SOYBEAN MEAL Futures:
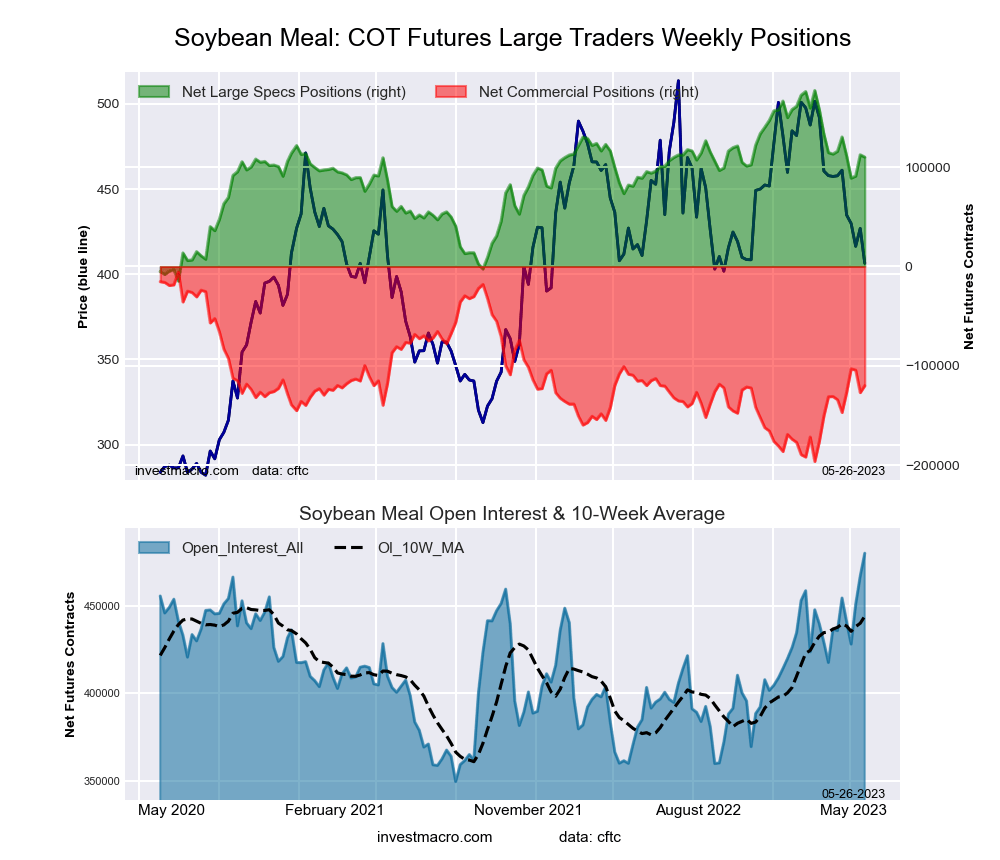 The SOYBEAN MEAL large speculator standing this week equaled a net position of 110,022 contracts in the data reported through Tuesday. This was a weekly decline of -2,319 contracts from the previous week which had a total of 112,341 net contracts.
This week’s current strength score (the trader positioning range over the past three years, measured from 0 to 100) shows the speculators are currently Bullish with a score of 65.1 percent. The commercials are Bearish with a score of 40.0 percent and the small traders (not shown in chart) are Bearish-Extreme with a score of 0.0 percent.
| SOYBEAN MEAL Futures Statistics | SPECULATORS | COMMERCIALS | SMALL TRADERS |
| – Percent of Open Interest Longs: | 28.5 | 38.4 | 9.1 |
| – Percent of Open Interest Shorts: | 5.5 | 63.4 | 7.0 |
| – Net Position: | 110,022 | -119,902 | 9,880 |
| – Gross Longs: | 136,546 | 184,271 | 43,425 |
| – Gross Shorts: | 26,524 | 304,173 | 33,545 |
| – Long to Short Ratio: | 5.1 to 1 | 0.6 to 1 | 1.3 to 1 |
| NET POSITION TREND: | |||
| – Strength Index Score (3 Year Range Pct): | 65.1 | 40.0 | 0.0 |
| – Strength Index Reading (3 Year Range): | Bullish | Bearish | Bearish-Extreme |
| NET POSITION MOVEMENT INDEX: | |||
| – 6-Week Change in Strength Index: | -3.1 | 7.4 | -36.9 |
LIVE CATTLE Futures:
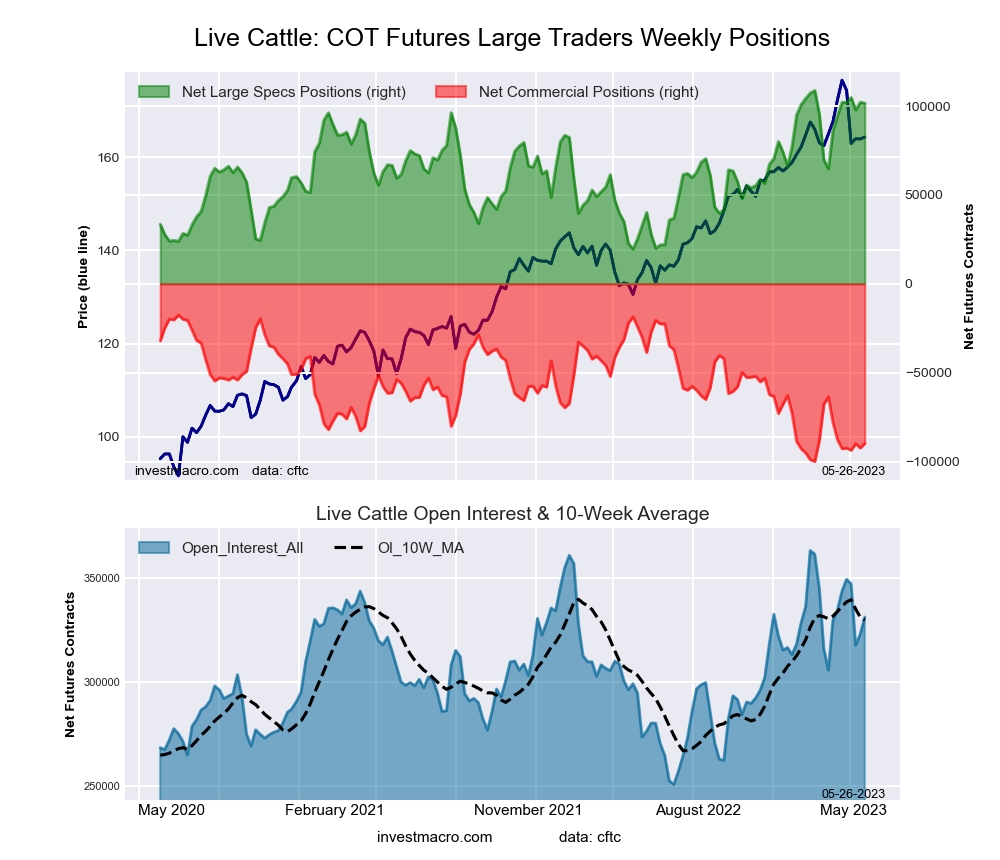 The LIVE CATTLE large speculator standing this week equaled a net position of 101,647 contracts in the data reported through Tuesday. This was a weekly fall of -469 contracts from the previous week which had a total of 102,116 net contracts.
This week’s current strength score (the trader positioning range over the past three years, measured from 0 to 100) shows the speculators are currently Bullish-Extreme with a score of 92.1 percent. The commercials are Bearish-Extreme with a score of 12.2 percent and the small traders (not shown in chart) are Bearish with a score of 24.0 percent.
| LIVE CATTLE Futures Statistics | SPECULATORS | COMMERCIALS | SMALL TRADERS |
| – Percent of Open Interest Longs: | 45.6 | 27.0 | 9.7 |
| – Percent of Open Interest Shorts: | 15.0 | 54.1 | 13.3 |
| – Net Position: | 101,647 | -89,891 | -11,756 |
| – Gross Longs: | 151,178 | 89,344 | 32,235 |
| – Gross Shorts: | 49,531 | 179,235 | 43,991 |
| – Long to Short Ratio: | 3.1 to 1 | 0.5 to 1 | 0.7 to 1 |
| NET POSITION TREND: | |||
| – Strength Index Score (3 Year Range Pct): | 92.1 | 12.2 | 24.0 |
| – Strength Index Reading (3 Year Range): | Bullish-Extreme | Bearish-Extreme | Bearish |
| NET POSITION MOVEMENT INDEX: | |||
| – 6-Week Change in Strength Index: | 7.9 | -2.6 | -27.2 |
LEAN HOGS Futures:
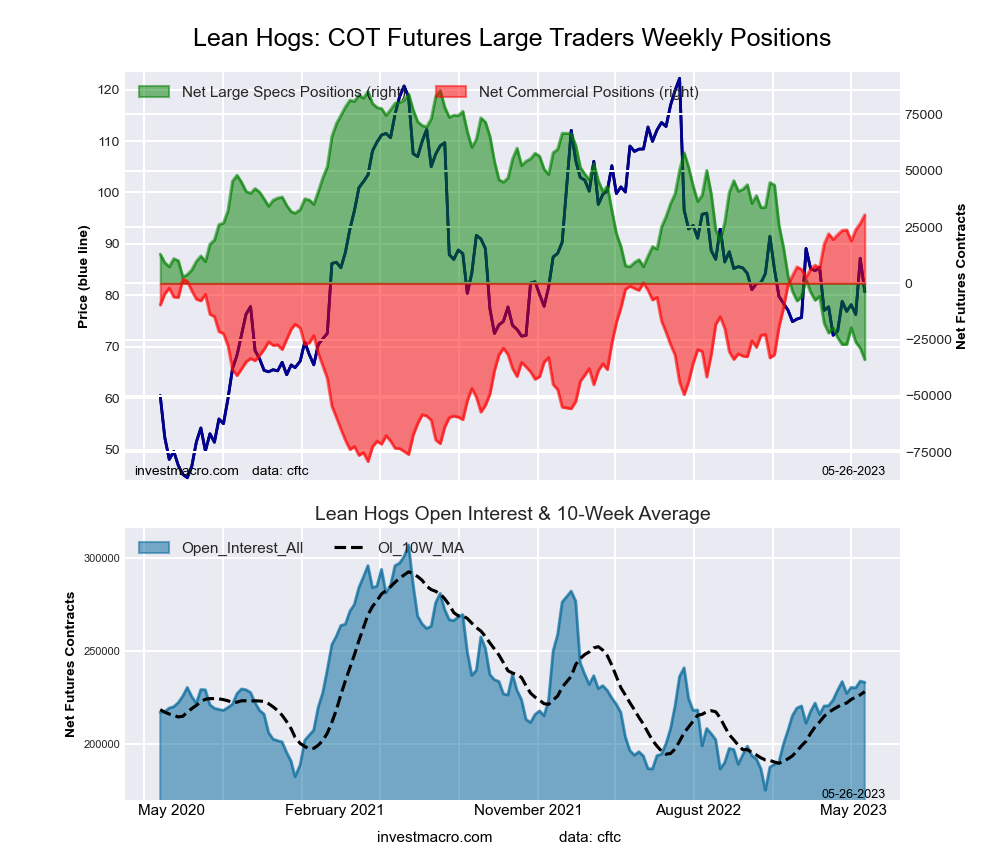 The LEAN HOGS large speculator standing this week equaled a net position of -33,852 contracts in the data reported through Tuesday. This was a weekly fall of -5,118 contracts from the previous week which had a total of -28,734 net contracts.
This week’s current strength score (the trader positioning range over the past three years, measured from 0 to 100) shows the speculators are currently Bearish-Extreme with a score of 0.0 percent. The commercials are Bullish-Extreme with a score of 100.0 percent and the small traders (not shown in chart) are Bullish-Extreme with a score of 98.8 percent.
| LEAN HOGS Futures Statistics | SPECULATORS | COMMERCIALS | SMALL TRADERS |
| – Percent of Open Interest Longs: | 25.8 | 37.8 | 10.6 |
| – Percent of Open Interest Shorts: | 40.3 | 24.7 | 9.1 |
| – Net Position: | -33,852 | 30,405 | 3,447 |
| – Gross Longs: | 60,033 | 88,003 | 24,705 |
| – Gross Shorts: | 93,885 | 57,598 | 21,258 |
| – Long to Short Ratio: | 0.6 to 1 | 1.5 to 1 | 1.2 to 1 |
| NET POSITION TREND: | |||
| – Strength Index Score (3 Year Range Pct): | 0.0 | 100.0 | 98.8 |
| – Strength Index Reading (3 Year Range): | Bearish-Extreme | Bullish-Extreme | Bullish-Extreme |
| NET POSITION MOVEMENT INDEX: | |||
| – 6-Week Change in Strength Index: | -8.2 | 8.0 | 4.4 |
COTTON Futures:
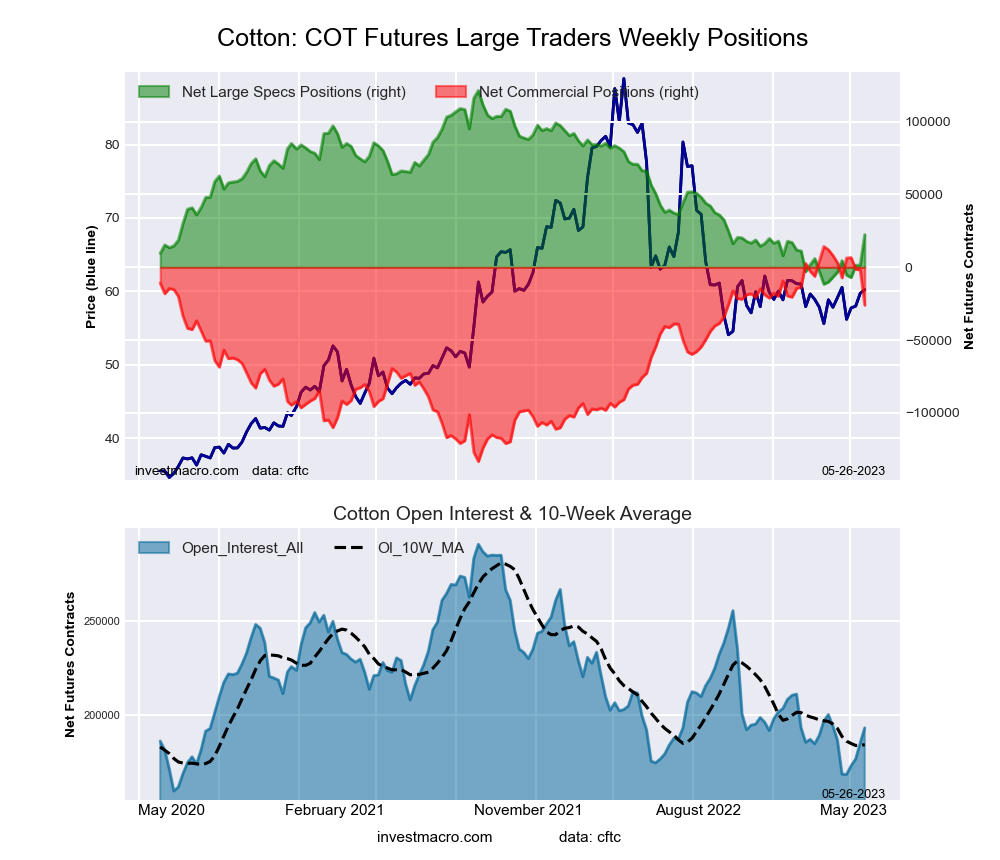 The COTTON large speculator standing this week equaled a net position of 22,319 contracts in the data reported through Tuesday. This was a weekly rise of 20,764 contracts from the previous week which had a total of 1,555 net contracts.
This week’s current strength score (the trader positioning range over the past three years, measured from 0 to 100) shows the speculators are currently Bearish with a score of 25.5 percent. The commercials are Bullish with a score of 72.7 percent and the small traders (not shown in chart) are Bearish with a score of 38.5 percent.
| COTTON Futures Statistics | SPECULATORS | COMMERCIALS | SMALL TRADERS |
| – Percent of Open Interest Longs: | 32.9 | 46.0 | 6.7 |
| – Percent of Open Interest Shorts: | 21.4 | 59.5 | 4.8 |
| – Net Position: | 22,319 | -26,017 | 3,698 |
| – Gross Longs: | 63,540 | 88,722 | 13,024 |
| – Gross Shorts: | 41,221 | 114,739 | 9,326 |
| – Long to Short Ratio: | 1.5 to 1 | 0.8 to 1 | 1.4 to 1 |
| NET POSITION TREND: | |||
| – Strength Index Score (3 Year Range Pct): | 25.5 | 72.7 | 38.5 |
| – Strength Index Reading (3 Year Range): | Bearish | Bullish | Bearish |
| NET POSITION MOVEMENT INDEX: | |||
| – 6-Week Change in Strength Index: | 19.3 | -19.7 | 21.1 |
COCOA Futures:
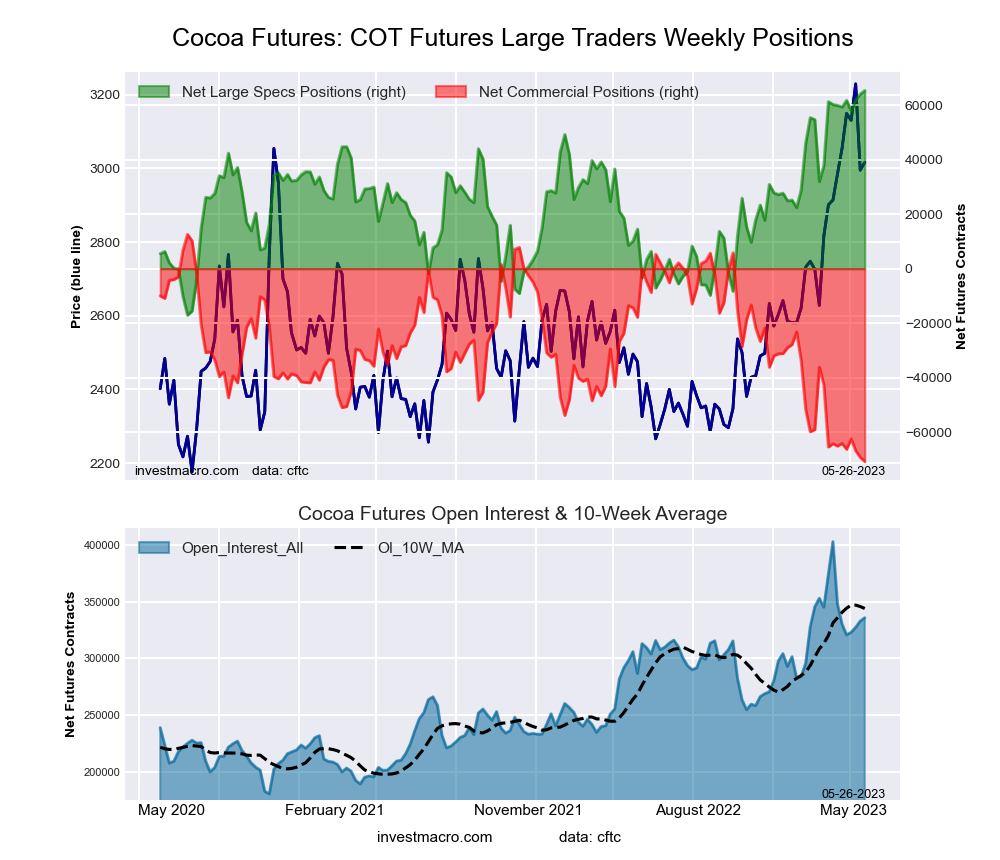 The COCOA large speculator standing this week equaled a net position of 65,374 contracts in the data reported through Tuesday. This was a weekly increase of 1,319 contracts from the previous week which had a total of 64,055 net contracts.
This week’s current strength score (the trader positioning range over the past three years, measured from 0 to 100) shows the speculators are currently Bullish-Extreme with a score of 100.0 percent. The commercials are Bearish-Extreme with a score of 0.0 percent and the small traders (not shown in chart) are Bullish with a score of 50.3 percent.
| COCOA Futures Statistics | SPECULATORS | COMMERCIALS | SMALL TRADERS |
| – Percent of Open Interest Longs: | 42.4 | 29.0 | 4.7 |
| – Percent of Open Interest Shorts: | 23.0 | 50.1 | 3.1 |
| – Net Position: | 65,374 | -70,745 | 5,371 |
| – Gross Longs: | 142,438 | 97,452 | 15,901 |
| – Gross Shorts: | 77,064 | 168,197 | 10,530 |
| – Long to Short Ratio: | 1.8 to 1 | 0.6 to 1 | 1.5 to 1 |
| NET POSITION TREND: | |||
| – Strength Index Score (3 Year Range Pct): | 100.0 | 0.0 | 50.3 |
| – Strength Index Reading (3 Year Range): | Bullish-Extreme | Bearish-Extreme | Bullish |
| NET POSITION MOVEMENT INDEX: | |||
| – 6-Week Change in Strength Index: | 6.6 | -6.8 | 2.1 |
WHEAT Futures:
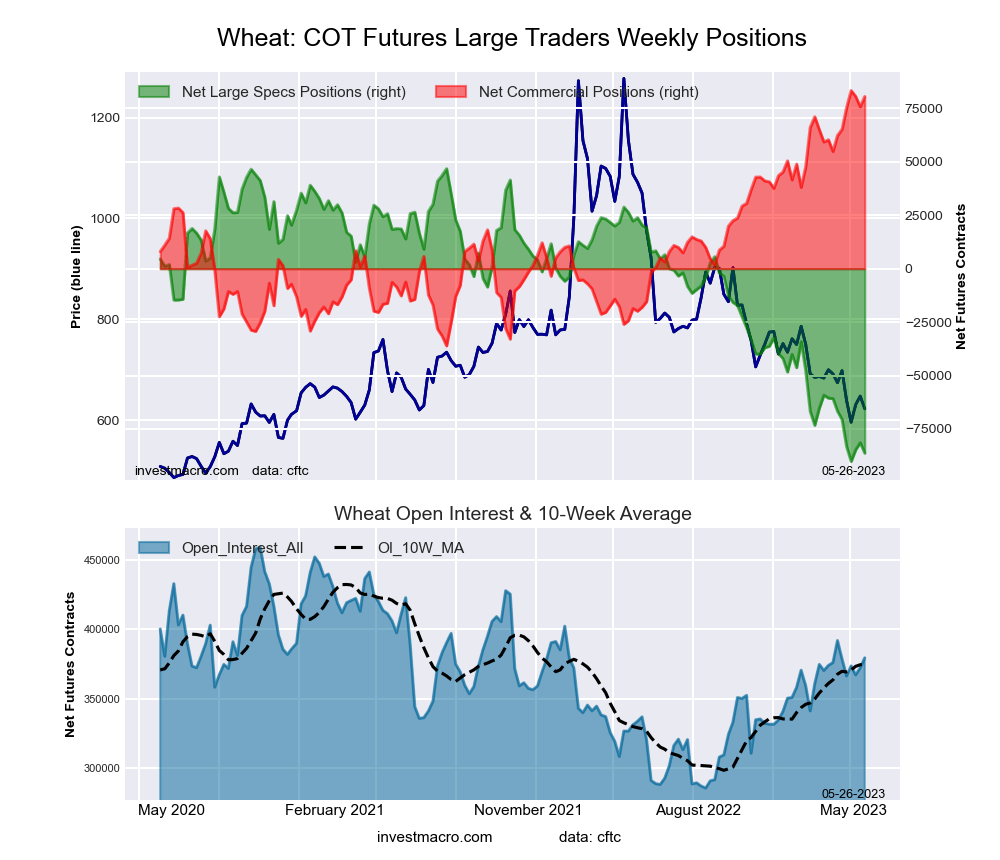 The WHEAT large speculator standing this week equaled a net position of -86,319 contracts in the data reported through Tuesday. This was a weekly reduction of -4,907 contracts from the previous week which had a total of -81,412 net contracts.
This week’s current strength score (the trader positioning range over the past three years, measured from 0 to 100) shows the speculators are currently Bearish-Extreme with a score of 2.8 percent. The commercials are Bullish-Extreme with a score of 97.7 percent and the small traders (not shown in chart) are Bullish-Extreme with a score of 92.8 percent.
| WHEAT Futures Statistics | SPECULATORS | COMMERCIALS | SMALL TRADERS |
| – Percent of Open Interest Longs: | 29.6 | 37.2 | 9.8 |
| – Percent of Open Interest Shorts: | 52.4 | 16.0 | 8.3 |
| – Net Position: | -86,319 | 80,586 | 5,733 |
| – Gross Longs: | 112,390 | 141,282 | 37,340 |
| – Gross Shorts: | 198,709 | 60,696 | 31,607 |
| – Long to Short Ratio: | 0.6 to 1 | 2.3 to 1 | 1.2 to 1 |
| NET POSITION TREND: | |||
| – Strength Index Score (3 Year Range Pct): | 2.8 | 97.7 | 92.8 |
| – Strength Index Reading (3 Year Range): | Bearish-Extreme | Bullish-Extreme | Bullish-Extreme |
| NET POSITION MOVEMENT INDEX: | |||
| – 6-Week Change in Strength Index: | -14.3 | 15.3 | 4.7 |
Article By InvestMacro – Receive our weekly COT Newsletter
*COT Report: The COT data, released weekly to the public each Friday, is updated through the most recent Tuesday (data is 3 days old) and shows a quick view of how large speculators or non-commercials (for-profit traders) were positioned in the futures markets.
The CFTC categorizes trader positions according to commercial hedgers (traders who use futures contracts for hedging as part of the business), non-commercials (large traders who speculate to realize trading profits) and nonreportable traders (usually small traders/speculators) as well as their open interest (contracts open in the market at time of reporting). See CFTC criteria here.

- COT Metals Charts: Weekly Speculator Bets led by Copper & Steel Jul 18, 2026
- COT Bonds Charts: Weekly Speculator Bets led by 2-Year, SOFR 3M & 5-Year Bonds Jul 18, 2026
- COT Energy Charts: Weekly Speculator Bets led by Brent Oil & Heating Oil Jul 18, 2026
- COT Soft Commodities Charts: Weekly Speculator Bets led by Wheat, Corn & Soybean Meal Jul 18, 2026
- The Bank of Canada kept its interest rate unchanged. Platinum prices reached a three‑week high Jul 16, 2026
- Stock indices rose after the release of US inflation data. China’s GDP slowed sharply Jul 15, 2026
- GBP/USD Awaits Political News: What Will Happen Next Jul 15, 2026
- USD/JPY Holds at Highs: Pressure Lingers on Yen Jul 14, 2026
- Oil prices jumped 4% amid a new wave of escalation between the US and Iran Jul 13, 2026
- EUR/USD: US Inflation Will Determine Everything Jul 13, 2026