
By InvestMacro
Here are the latest charts and statistics for the Commitment of Traders (COT) reports data published by the Commodities Futures Trading Commission (CFTC).
The latest COT data is updated through Tuesday May 16th and shows a quick view of how large traders (for-profit speculators and commercial hedgers) were positioned in the futures markets.
Weekly Speculator Changes led by Fed Funds & 10-Year Bonds
The COT bond market speculator bets were higher this week as seven out of the nine bond markets we cover had higher positioning while the other two markets had lower speculator contracts.
Free Reports:
 Sign Up for Our Stock Market Newsletter – Get updated on News, Charts & Rankings of Public Companies when you join our Stocks Newsletter
 Get our Weekly Commitment of Traders Reports - See where the biggest traders (Hedge Funds and Commercial Hedgers) are positioned in the futures markets on a weekly basis.
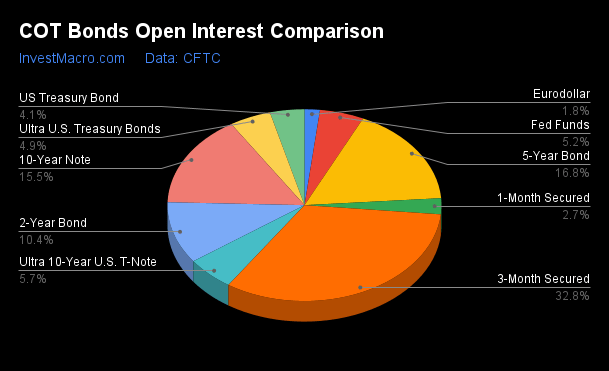
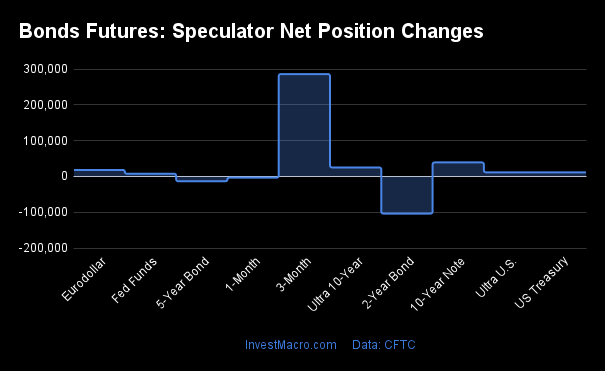
Leading the gains for the bond markets was the SOFR 3-Months (286,007 contracts) with the 10-Year Bonds (39,256 contracts), the Ultra 10-Year Bonds (25,171 contracts), the Eurodollar (18,226 contracts), the Ultra Treasury Bonds (11,539 contracts), the US Treasury Bonds (11,548 contracts), and the Fed Funds (7,746 contracts) also showing positive weeks.
The bond markets with declines in speculator bets for the week were the 2-Year Bonds (-103,690 contracts) and the 5-Year Bonds (-13,271 contracts) also registering lower bets on the week.
Bonds Speculators continue to raise record bearish bets in 2-Year and the 5-Year bonds
Highlighting the COT bonds data once again this week was an increase in the record bearish speculator positions for both the 2-Year and the 5-Year bonds.
The large speculators in the 2-Year bonds sharply added to their bearish bets for a second straight week this week and for the fourth time in the past five weeks. Speculators have now added more than -100,000 contracts to the bearish position in each of the past two weeks. There has been a total of -356,734 contracts added to the overall bearish standing in the past five weeks which has taken the position from -496,841 on April 11th to a total new historical record bearish level of -853,575 contracts this week.
Meanwhile, the 5-Year Bond speculator positions only edged slightly lower this week but have now been more bearish for four straight weeks. The last four weeks have added a total of -169,411 contracts to the net speculator level and has brought the current bearish position to a record total of -923,913 contracts.
The 2-Year and 5-Years front-month futures prices were on retreat this week as were most of the bonds across the US Treasury yield curve. The 5-Year price closed at the 108.22 level but remains approximately 3 percent higher from the most recent low hit in October. The 2-Year futures price closed the week at 102.19 and only approximately 1.25 percent higher than the recent low reached in March.
| May-16-2023 | OI | OI-Index | Spec-Net | Spec-Index | Com-Net | COM-Index | Smalls-Net | Smalls-Index |
|---|---|---|---|---|---|---|---|---|
| Eurodollar | 550,147 | 0 | -36,884 | 73 | 39,568 | 23 | -2,684 | 99 |
| FedFunds | 1,585,578 | 54 | -67,571 | 31 | 88,368 | 71 | -20,797 | 50 |
| 2-Year | 3,164,301 | 100 | -853,575 | 0 | 772,391 | 100 | 81,184 | 95 |
| Long T-Bond | 1,236,267 | 67 | -61,581 | 65 | -315 | 10 | 61,896 | 94 |
| 10-Year | 4,718,099 | 100 | -692,442 | 6 | 570,703 | 83 | 121,739 | 100 |
| 5-Year | 5,100,803 | 100 | -923,913 | 0 | 872,715 | 99 | 51,198 | 95 |
Strength Scores led by SOFR 3-Months & Eurodollar
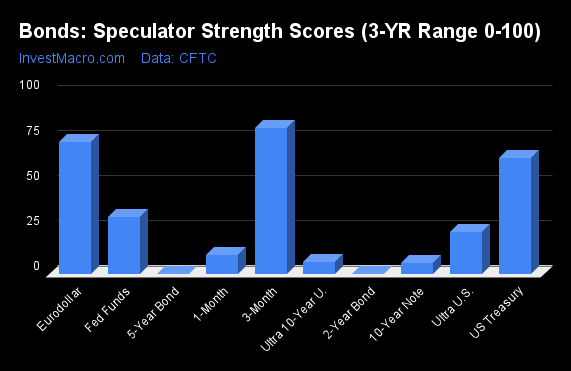
COT Strength Scores (a normalized measure of Speculator positions over a 3-Year range, from 0 to 100 where above 80 is Extreme-Bullish and below 20 is Extreme-Bearish) showed that the SOFR 3-Months (81 percent) and the Eurodollar (73 percent) lead the bond markets this week. The US Treasury Bonds (65 percent) comes in as the next highest in the weekly strength scores.
On the downside, the 5-Year Bonds (0 percent), the 2-Year Bonds (0 percent), the Ultra 10-Year Bonds (6 percent) and the 10-Year Bonds (6 percent) come in at the lowest strength level currently and are in Extreme-Bearish territory (below 20 percent).
Strength Statistics:
Fed Funds (31.3 percent) vs Fed Funds previous week (30.3 percent)
2-Year Bond (0.0 percent) vs 2-Year Bond previous week (11.0 percent)
5-Year Bond (0.0 percent) vs 5-Year Bond previous week (1.3 percent)
10-Year Bond (6.1 percent) vs 10-Year Bond previous week (1.9 percent)
Ultra 10-Year Bond (6.5 percent) vs Ultra 10-Year Bond previous week (1.4 percent)
US Treasury Bond (64.5 percent) vs US Treasury Bond previous week (60.8 percent)
Ultra US Treasury Bond (23.4 percent) vs Ultra US Treasury Bond previous week (18.5 percent)
Eurodollar (73.1 percent) vs Eurodollar previous week (72.6 percent)
SOFR 3-Months (81.0 percent) vs SOFR 3-Months previous week (57.8 percent)
US Treasury Bonds & Eurodollar top the 6-Week Strength Trends
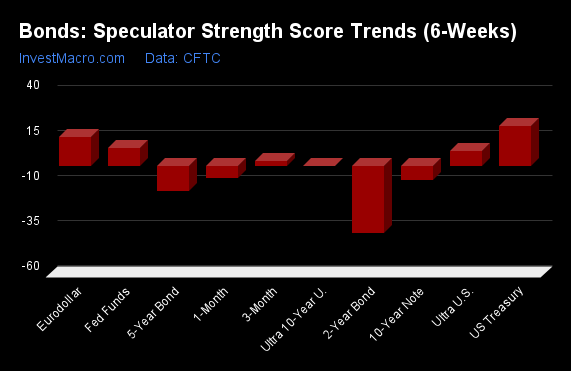
COT Strength Score Trends (or move index, calculates the 6-week changes in strength scores) showed that the US Treasury Bonds (22 percent) and the Eurodollar (16 percent) lead the past six weeks trends for bonds. The Fed Funds (10 percent) and the are the next highest positive movers in the latest trends data.
The 2-Year Bonds (-37 percent) and the 5-Year Bonds (-14 percent) leads the downside trend scores currently with the 10-Year Bonds (-8 percent) following next with lower trend scores.
Strength Trend Statistics:
Fed Funds (9.8 percent) vs Fed Funds previous week (11.5 percent)
2-Year Bond (-37.3 percent) vs 2-Year Bond previous week (-23.8 percent)
5-Year Bond (-14.0 percent) vs 5-Year Bond previous week (-22.4 percent)
10-Year Bond (-7.7 percent) vs 10-Year Bond previous week (-28.0 percent)
Ultra 10-Year Bond (0.0 percent) vs Ultra 10-Year Bond previous week (-12.2 percent)
US Treasury Bond (22.1 percent) vs US Treasury Bond previous week (5.9 percent)
Ultra US Treasury Bond (8.0 percent) vs Ultra US Treasury Bond previous week (9.0 percent)
Eurodollar (15.7 percent) vs Eurodollar previous week (14.7 percent)
SOFR 3-Months (2.8 percent) vs SOFR 3-Months previous week (-32.9 percent)
Individual Bond Markets:
3-Month Eurodollars Futures:
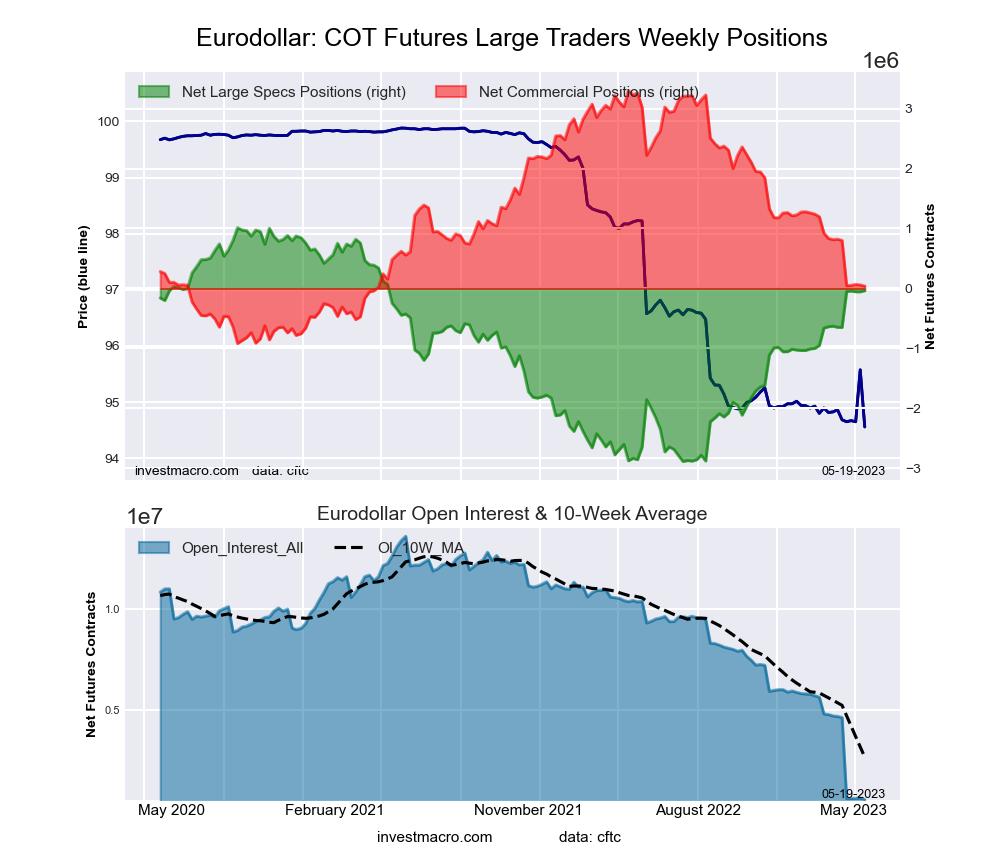 The 3-Month Eurodollars large speculator standing this week was a net position of -36,884 contracts in the data reported through Tuesday. This was a weekly boost of 18,226 contracts from the previous week which had a total of -55,110 net contracts.
This week’s current strength score (the trader positioning range over the past three years, measured from 0 to 100) shows the speculators are currently Bullish with a score of 73.1 percent. The commercials are Bearish with a score of 22.7 percent and the small traders (not shown in chart) are Bullish-Extreme with a score of 98.7 percent.
| 3-Month Eurodollars Statistics | SPECULATORS | COMMERCIALS | SMALL TRADERS |
| – Percent of Open Interest Longs: | 28.2 | 60.7 | 11.0 |
| – Percent of Open Interest Shorts: | 34.9 | 53.5 | 11.5 |
| – Net Position: | -36,884 | 39,568 | -2,684 |
| – Gross Longs: | 155,249 | 333,675 | 60,427 |
| – Gross Shorts: | 192,133 | 294,107 | 63,111 |
| – Long to Short Ratio: | 0.8 to 1 | 1.1 to 1 | 1.0 to 1 |
| NET POSITION TREND: | |||
| – Strength Index Score (3 Year Range Pct): | 73.1 | 22.7 | 98.7 |
| – Strength Index Reading (3 Year Range): | Bullish | Bearish | Bullish-Extreme |
| NET POSITION MOVEMENT INDEX: | |||
| – 6-Week Change in Strength Index: | 15.7 | -18.5 | 35.7 |
Secured Overnight Financing Rate (3-Month) Futures:
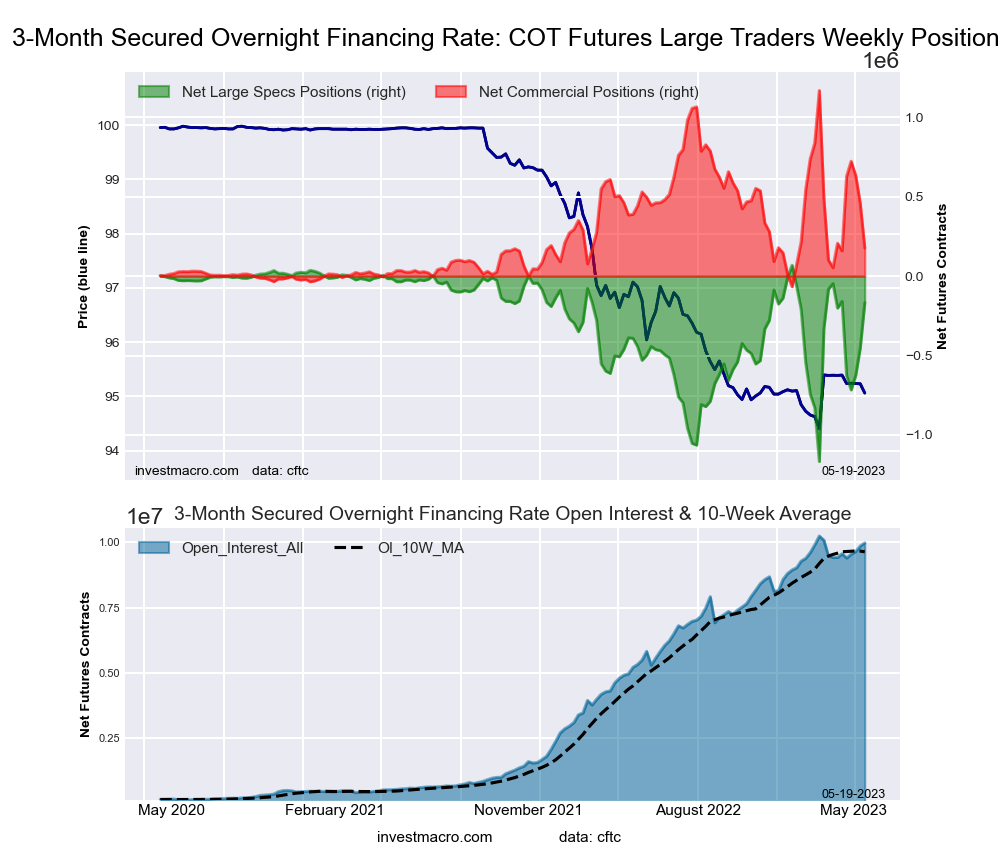 The Secured Overnight Financing Rate (3-Month) large speculator standing this week was a net position of -166,821 contracts in the data reported through Tuesday. This was a weekly gain of 286,007 contracts from the previous week which had a total of -452,828 net contracts.
This week’s current strength score (the trader positioning range over the past three years, measured from 0 to 100) shows the speculators are currently Bullish-Extreme with a score of 81.0 percent. The commercials are Bearish-Extreme with a score of 19.7 percent and the small traders (not shown in chart) are Bullish-Extreme with a score of 82.4 percent.
| SOFR 3-Months Statistics | SPECULATORS | COMMERCIALS | SMALL TRADERS |
| – Percent of Open Interest Longs: | 15.1 | 61.5 | 0.4 |
| – Percent of Open Interest Shorts: | 16.8 | 59.8 | 0.5 |
| – Net Position: | -166,821 | 176,705 | -9,884 |
| – Gross Longs: | 1,503,562 | 6,133,861 | 41,542 |
| – Gross Shorts: | 1,670,383 | 5,957,156 | 51,426 |
| – Long to Short Ratio: | 0.9 to 1 | 1.0 to 1 | 0.8 to 1 |
| NET POSITION TREND: | |||
| – Strength Index Score (3 Year Range Pct): | 81.0 | 19.7 | 82.4 |
| – Strength Index Reading (3 Year Range): | Bullish-Extreme | Bearish-Extreme | Bullish-Extreme |
| NET POSITION MOVEMENT INDEX: | |||
| – 6-Week Change in Strength Index: | 2.8 | -2.4 | -2.7 |
30-Day Federal Funds Futures:
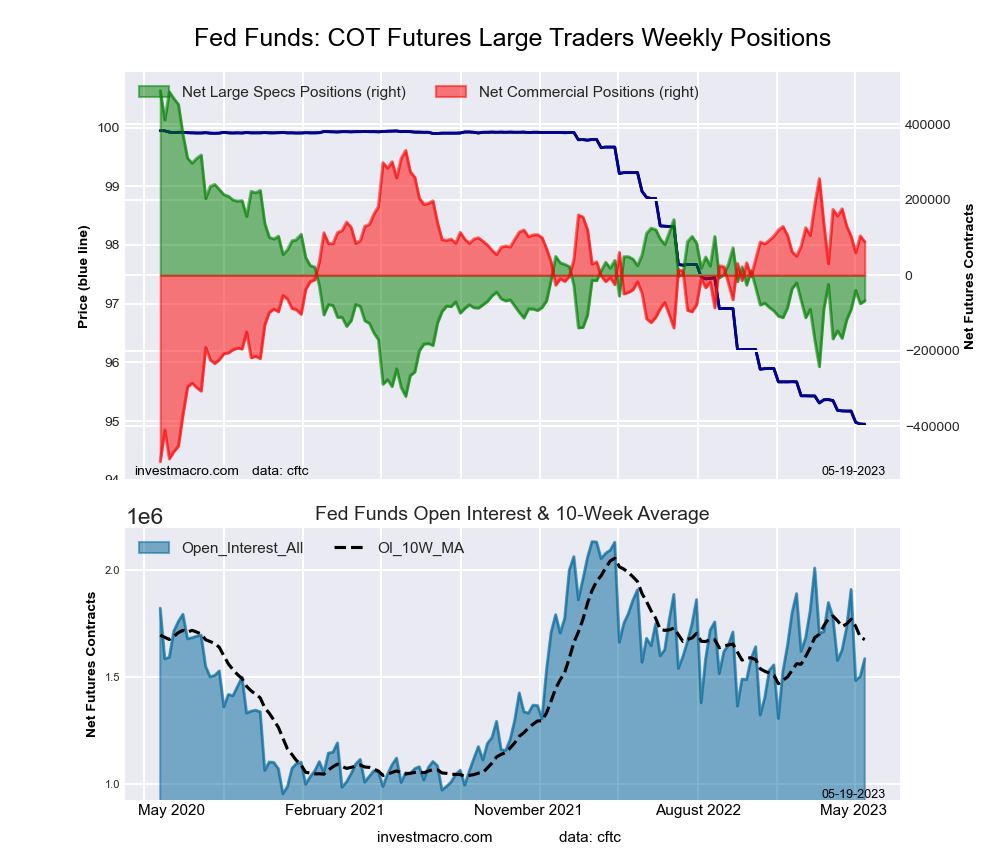 The 30-Day Federal Funds large speculator standing this week was a net position of -67,571 contracts in the data reported through Tuesday. This was a weekly lift of 7,746 contracts from the previous week which had a total of -75,317 net contracts.
This week’s current strength score (the trader positioning range over the past three years, measured from 0 to 100) shows the speculators are currently Bearish with a score of 31.3 percent. The commercials are Bullish with a score of 70.6 percent and the small traders (not shown in chart) are Bullish with a score of 50.2 percent.
| 30-Day Federal Funds Statistics | SPECULATORS | COMMERCIALS | SMALL TRADERS |
| – Percent of Open Interest Longs: | 4.4 | 76.7 | 2.0 |
| – Percent of Open Interest Shorts: | 8.7 | 71.1 | 3.3 |
| – Net Position: | -67,571 | 88,368 | -20,797 |
| – Gross Longs: | 69,674 | 1,216,347 | 31,381 |
| – Gross Shorts: | 137,245 | 1,127,979 | 52,178 |
| – Long to Short Ratio: | 0.5 to 1 | 1.1 to 1 | 0.6 to 1 |
| NET POSITION TREND: | |||
| – Strength Index Score (3 Year Range Pct): | 31.3 | 70.6 | 50.2 |
| – Strength Index Reading (3 Year Range): | Bearish | Bullish | Bullish |
| NET POSITION MOVEMENT INDEX: | |||
| – 6-Week Change in Strength Index: | 9.8 | -8.3 | -21.8 |
2-Year Treasury Note Futures:
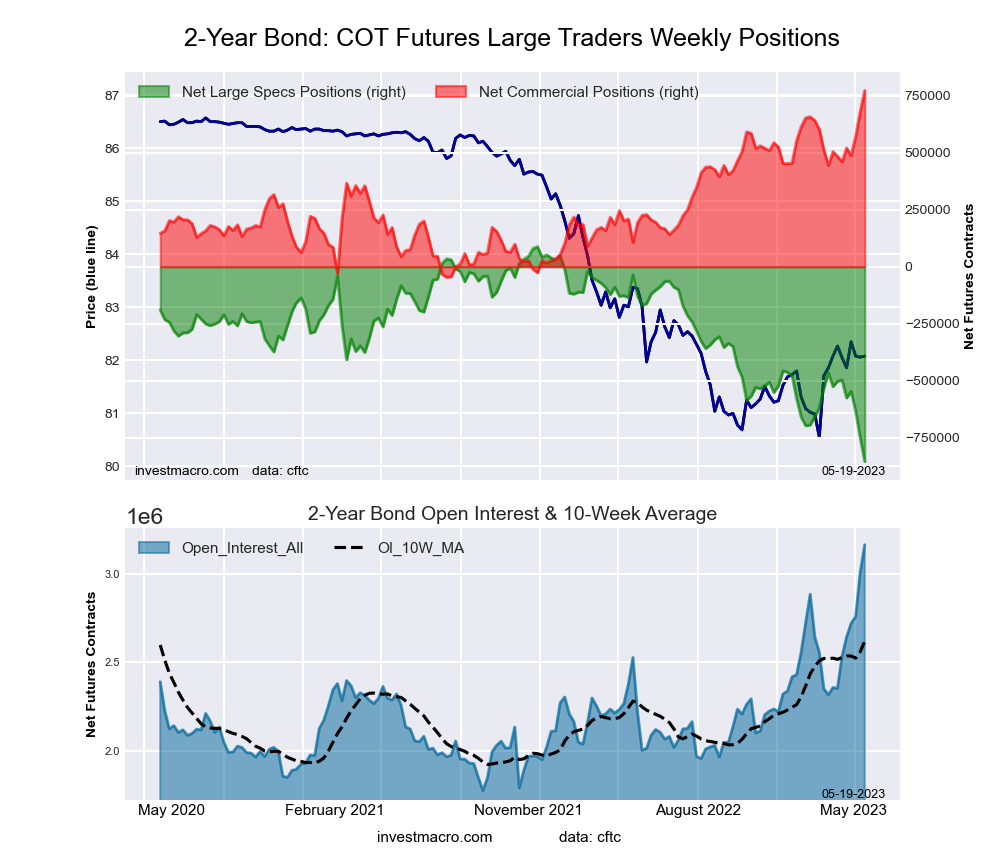 The 2-Year Treasury Note large speculator standing this week was a net position of -853,575 contracts in the data reported through Tuesday. This was a weekly lowering of -103,690 contracts from the previous week which had a total of -749,885 net contracts.
This week’s current strength score (the trader positioning range over the past three years, measured from 0 to 100) shows the speculators are currently Bearish-Extreme with a score of 0.0 percent. The commercials are Bullish-Extreme with a score of 100.0 percent and the small traders (not shown in chart) are Bullish-Extreme with a score of 94.7 percent.
| 2-Year Treasury Note Statistics | SPECULATORS | COMMERCIALS | SMALL TRADERS |
| – Percent of Open Interest Longs: | 9.2 | 82.6 | 7.2 |
| – Percent of Open Interest Shorts: | 36.2 | 58.1 | 4.6 |
| – Net Position: | -853,575 | 772,391 | 81,184 |
| – Gross Longs: | 290,539 | 2,612,188 | 227,803 |
| – Gross Shorts: | 1,144,114 | 1,839,797 | 146,619 |
| – Long to Short Ratio: | 0.3 to 1 | 1.4 to 1 | 1.6 to 1 |
| NET POSITION TREND: | |||
| – Strength Index Score (3 Year Range Pct): | 0.0 | 100.0 | 94.7 |
| – Strength Index Reading (3 Year Range): | Bearish-Extreme | Bullish-Extreme | Bullish-Extreme |
| NET POSITION MOVEMENT INDEX: | |||
| – 6-Week Change in Strength Index: | -37.3 | 35.3 | 29.8 |
5-Year Treasury Note Futures:
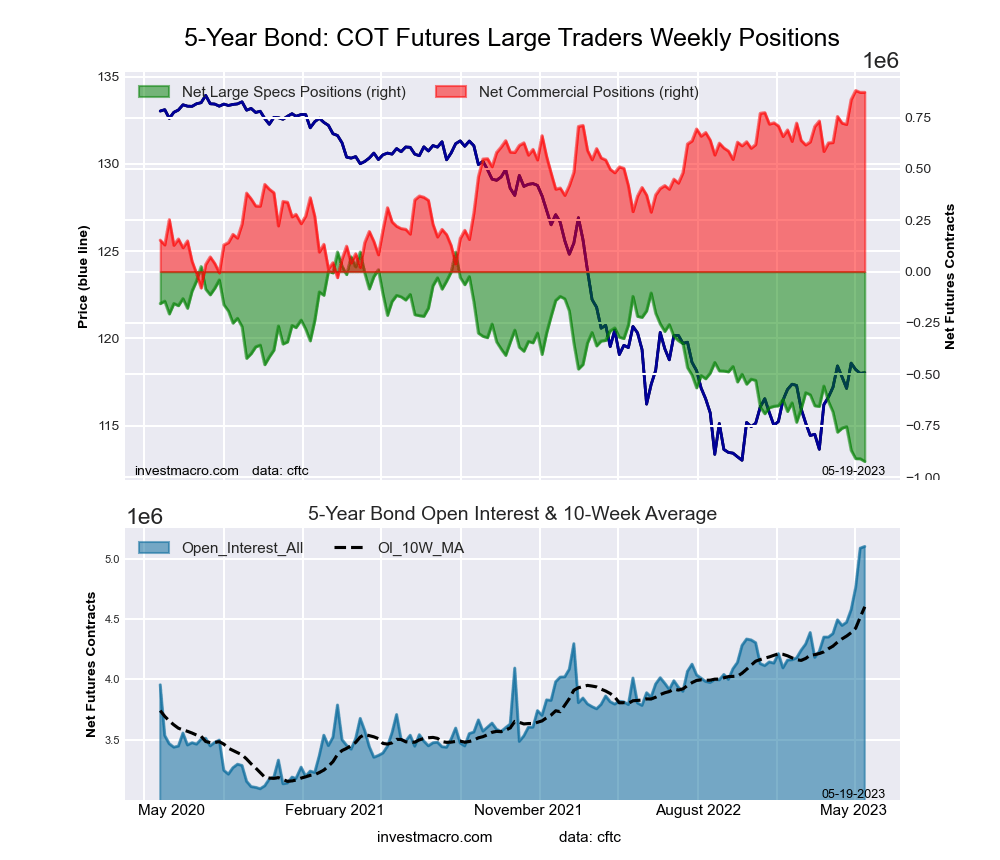 The 5-Year Treasury Note large speculator standing this week was a net position of -923,913 contracts in the data reported through Tuesday. This was a weekly lowering of -13,271 contracts from the previous week which had a total of -910,642 net contracts.
This week’s current strength score (the trader positioning range over the past three years, measured from 0 to 100) shows the speculators are currently Bearish-Extreme with a score of 0.0 percent. The commercials are Bullish-Extreme with a score of 99.1 percent and the small traders (not shown in chart) are Bullish-Extreme with a score of 95.1 percent.
| 5-Year Treasury Note Statistics | SPECULATORS | COMMERCIALS | SMALL TRADERS |
| – Percent of Open Interest Longs: | 8.5 | 81.9 | 7.2 |
| – Percent of Open Interest Shorts: | 26.7 | 64.8 | 6.2 |
| – Net Position: | -923,913 | 872,715 | 51,198 |
| – Gross Longs: | 435,965 | 4,177,142 | 368,639 |
| – Gross Shorts: | 1,359,878 | 3,304,427 | 317,441 |
| – Long to Short Ratio: | 0.3 to 1 | 1.3 to 1 | 1.2 to 1 |
| NET POSITION TREND: | |||
| – Strength Index Score (3 Year Range Pct): | 0.0 | 99.1 | 95.1 |
| – Strength Index Reading (3 Year Range): | Bearish-Extreme | Bullish-Extreme | Bullish-Extreme |
| NET POSITION MOVEMENT INDEX: | |||
| – 6-Week Change in Strength Index: | -14.0 | 12.3 | 6.8 |
10-Year Treasury Note Futures:
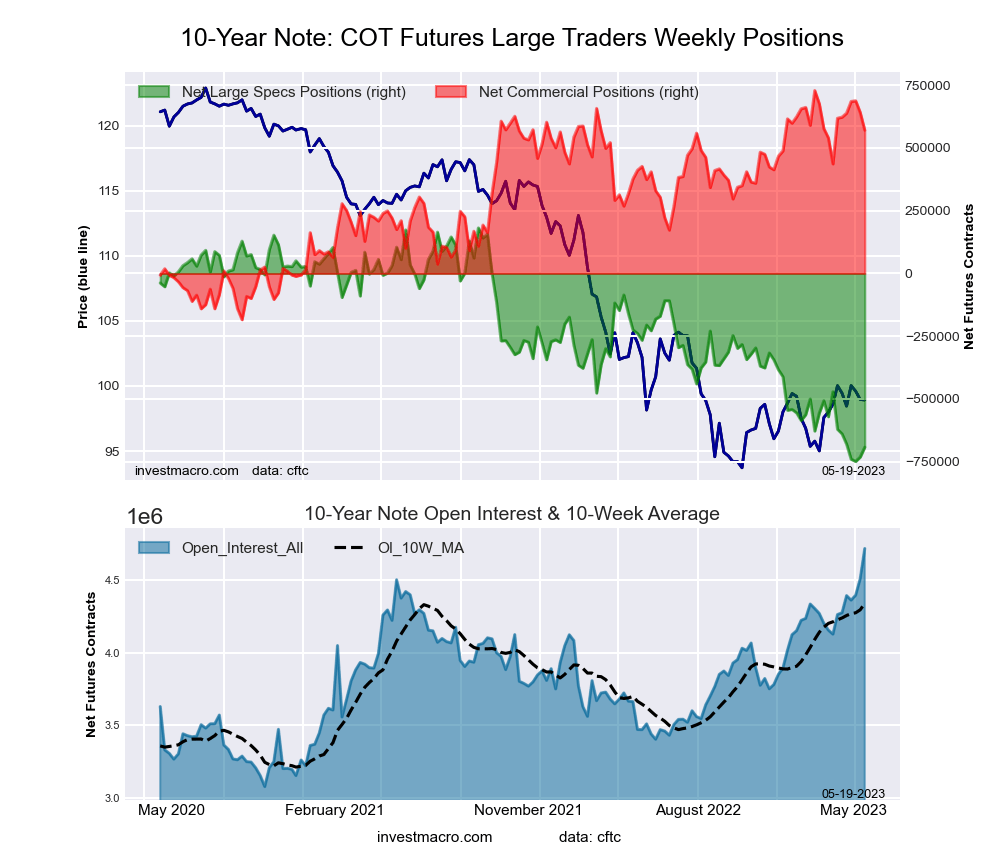 The 10-Year Treasury Note large speculator standing this week was a net position of -692,442 contracts in the data reported through Tuesday. This was a weekly rise of 39,256 contracts from the previous week which had a total of -731,698 net contracts.
This week’s current strength score (the trader positioning range over the past three years, measured from 0 to 100) shows the speculators are currently Bearish-Extreme with a score of 6.1 percent. The commercials are Bullish-Extreme with a score of 82.7 percent and the small traders (not shown in chart) are Bullish-Extreme with a score of 100.0 percent.
| 10-Year Treasury Note Statistics | SPECULATORS | COMMERCIALS | SMALL TRADERS |
| – Percent of Open Interest Longs: | 11.2 | 76.0 | 9.6 |
| – Percent of Open Interest Shorts: | 25.9 | 64.0 | 7.1 |
| – Net Position: | -692,442 | 570,703 | 121,739 |
| – Gross Longs: | 527,490 | 3,588,001 | 454,956 |
| – Gross Shorts: | 1,219,932 | 3,017,298 | 333,217 |
| – Long to Short Ratio: | 0.4 to 1 | 1.2 to 1 | 1.4 to 1 |
| NET POSITION TREND: | |||
| – Strength Index Score (3 Year Range Pct): | 6.1 | 82.7 | 100.0 |
| – Strength Index Reading (3 Year Range): | Bearish-Extreme | Bullish-Extreme | Bullish-Extreme |
| NET POSITION MOVEMENT INDEX: | |||
| – 6-Week Change in Strength Index: | -7.7 | -5.2 | 25.9 |
Ultra 10-Year Notes Futures:
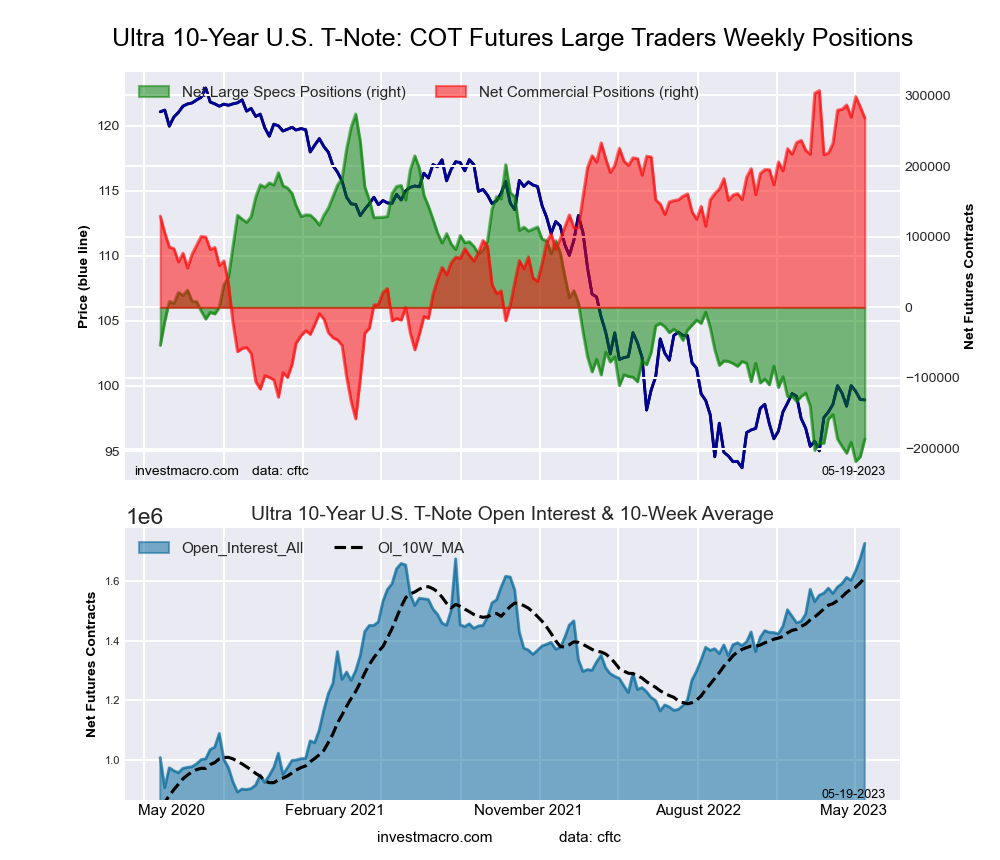 The Ultra 10-Year Notes large speculator standing this week was a net position of -186,427 contracts in the data reported through Tuesday. This was a weekly lift of 25,171 contracts from the previous week which had a total of -211,598 net contracts.
This week’s current strength score (the trader positioning range over the past three years, measured from 0 to 100) shows the speculators are currently Bearish-Extreme with a score of 6.5 percent. The commercials are Bullish-Extreme with a score of 91.6 percent and the small traders (not shown in chart) are Bullish with a score of 65.6 percent.
| Ultra 10-Year Notes Statistics | SPECULATORS | COMMERCIALS | SMALL TRADERS |
| – Percent of Open Interest Longs: | 10.1 | 77.6 | 9.5 |
| – Percent of Open Interest Shorts: | 20.9 | 62.1 | 14.3 |
| – Net Position: | -186,427 | 267,999 | -81,572 |
| – Gross Longs: | 173,884 | 1,340,651 | 164,624 |
| – Gross Shorts: | 360,311 | 1,072,652 | 246,196 |
| – Long to Short Ratio: | 0.5 to 1 | 1.2 to 1 | 0.7 to 1 |
| NET POSITION TREND: | |||
| – Strength Index Score (3 Year Range Pct): | 6.5 | 91.6 | 65.6 |
| – Strength Index Reading (3 Year Range): | Bearish-Extreme | Bullish-Extreme | Bullish |
| NET POSITION MOVEMENT INDEX: | |||
| – 6-Week Change in Strength Index: | 0.0 | -2.4 | 6.7 |
US Treasury Bonds Futures:
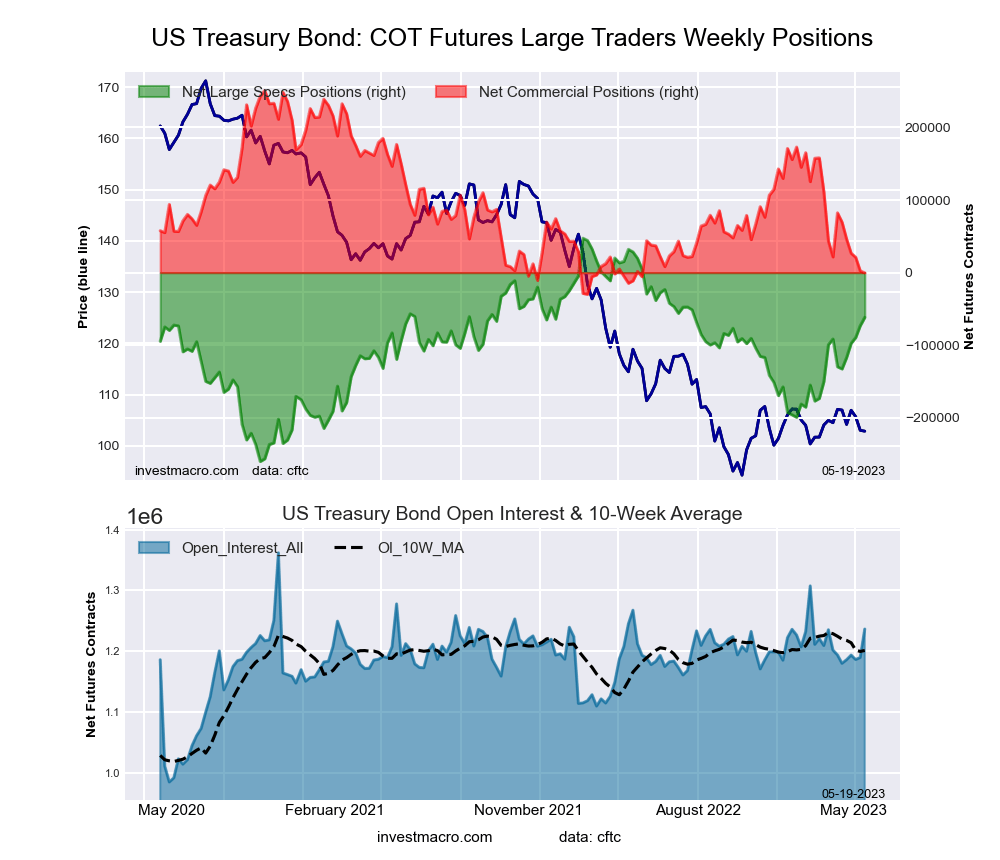 The US Treasury Bonds large speculator standing this week was a net position of -61,581 contracts in the data reported through Tuesday. This was a weekly rise of 11,548 contracts from the previous week which had a total of -73,129 net contracts.
This week’s current strength score (the trader positioning range over the past three years, measured from 0 to 100) shows the speculators are currently Bullish with a score of 64.5 percent. The commercials are Bearish-Extreme with a score of 10.5 percent and the small traders (not shown in chart) are Bullish-Extreme with a score of 93.5 percent.
| US Treasury Bonds Statistics | SPECULATORS | COMMERCIALS | SMALL TRADERS |
| – Percent of Open Interest Longs: | 7.4 | 76.1 | 14.9 |
| – Percent of Open Interest Shorts: | 12.4 | 76.2 | 9.9 |
| – Net Position: | -61,581 | -315 | 61,896 |
| – Gross Longs: | 91,193 | 941,115 | 183,809 |
| – Gross Shorts: | 152,774 | 941,430 | 121,913 |
| – Long to Short Ratio: | 0.6 to 1 | 1.0 to 1 | 1.5 to 1 |
| NET POSITION TREND: | |||
| – Strength Index Score (3 Year Range Pct): | 64.5 | 10.5 | 93.5 |
| – Strength Index Reading (3 Year Range): | Bullish | Bearish-Extreme | Bullish-Extreme |
| NET POSITION MOVEMENT INDEX: | |||
| – 6-Week Change in Strength Index: | 22.1 | -29.5 | 10.6 |
Ultra US Treasury Bonds Futures:
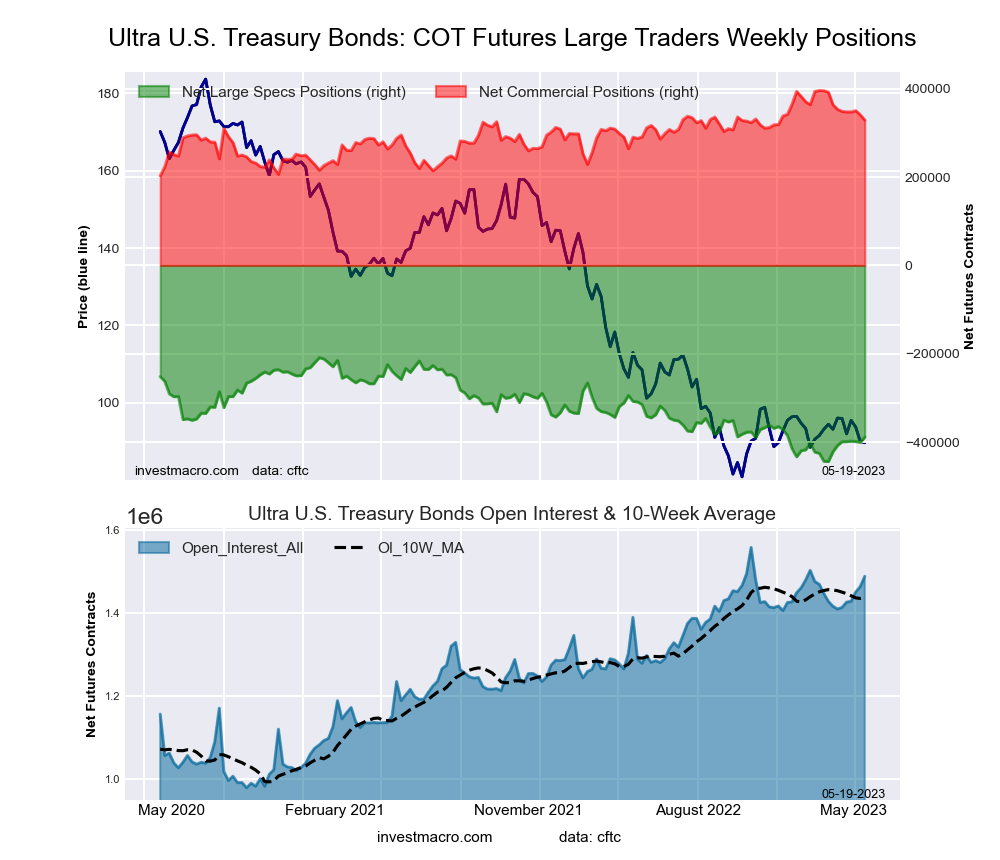 The Ultra US Treasury Bonds large speculator standing this week was a net position of -388,980 contracts in the data reported through Tuesday. This was a weekly boost of 11,539 contracts from the previous week which had a total of -400,519 net contracts.
This week’s current strength score (the trader positioning range over the past three years, measured from 0 to 100) shows the speculators are currently Bearish with a score of 23.4 percent. The commercials are Bullish with a score of 65.3 percent and the small traders (not shown in chart) are Bullish-Extreme with a score of 99.8 percent.
| Ultra US Treasury Bonds Statistics | SPECULATORS | COMMERCIALS | SMALL TRADERS |
| – Percent of Open Interest Longs: | 6.6 | 80.1 | 12.3 |
| – Percent of Open Interest Shorts: | 32.7 | 58.0 | 8.3 |
| – Net Position: | -388,980 | 328,975 | 60,005 |
| – Gross Longs: | 97,884 | 1,192,422 | 183,052 |
| – Gross Shorts: | 486,864 | 863,447 | 123,047 |
| – Long to Short Ratio: | 0.2 to 1 | 1.4 to 1 | 1.5 to 1 |
| NET POSITION TREND: | |||
| – Strength Index Score (3 Year Range Pct): | 23.4 | 65.3 | 99.8 |
| – Strength Index Reading (3 Year Range): | Bearish | Bullish | Bullish-Extreme |
| NET POSITION MOVEMENT INDEX: | |||
| – 6-Week Change in Strength Index: | 8.0 | -12.6 | 5.6 |
Article By InvestMacro – Receive our weekly COT Newsletter
*COT Report: The COT data, released weekly to the public each Friday, is updated through the most recent Tuesday (data is 3 days old) and shows a quick view of how large speculators or non-commercials (for-profit traders) were positioned in the futures markets.
The CFTC categorizes trader positions according to commercial hedgers (traders who use futures contracts for hedging as part of the business), non-commercials (large traders who speculate to realize trading profits) and nonreportable traders (usually small traders/speculators) as well as their open interest (contracts open in the market at time of reporting). See CFTC criteria here.

- Geopolitical and macroeconomic conditions continue to pressure market sentiment Jul 20, 2026
- USD/JPY Poised to Continue Gains as Expensive Oil and Lack of Support Weigh on Yen Jul 20, 2026
- COT Metals Charts: Weekly Speculator Bets led by Copper & Steel Jul 18, 2026
- COT Bonds Charts: Weekly Speculator Bets led by 2-Year, SOFR 3M & 5-Year Bonds Jul 18, 2026
- COT Energy Charts: Weekly Speculator Bets led by Brent Oil & Heating Oil Jul 18, 2026
- COT Soft Commodities Charts: Weekly Speculator Bets led by Wheat, Corn & Soybean Meal Jul 18, 2026
- The Bank of Canada kept its interest rate unchanged. Platinum prices reached a three‑week high Jul 16, 2026
- Stock indices rose after the release of US inflation data. China’s GDP slowed sharply Jul 15, 2026
- GBP/USD Awaits Political News: What Will Happen Next Jul 15, 2026
- USD/JPY Holds at Highs: Pressure Lingers on Yen Jul 14, 2026