
By InvestMacro

Here are the latest charts and statistics for the Commitment of Traders (COT) data published by the Commodities Futures Trading Commission (CFTC).
The latest COT data is updated through Tuesday June 6th and shows a quick view of how large market participants (for-profit speculators and commercial traders) were positioned in the futures markets. All currency positions are in direct relation to the US dollar where, for example, a bet for the euro is a bet that the euro will rise versus the dollar while a bet against the euro will be a bet that the euro will decline versus the dollar.
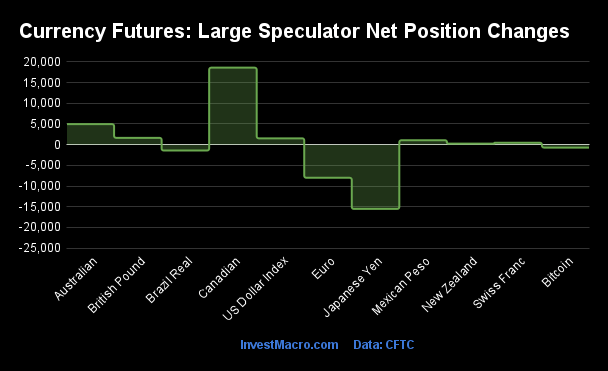
Weekly Speculator Changes led by Mexican Peso & Bitcoin
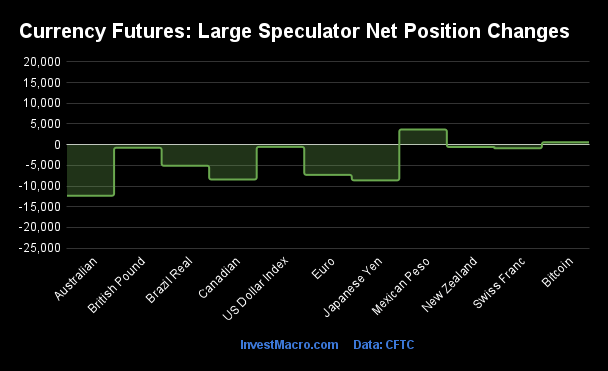
The COT currency market speculator bets were lower this week as two out of the eleven currency markets we cover had higher positioning while the other nine markets had lower speculator contracts.
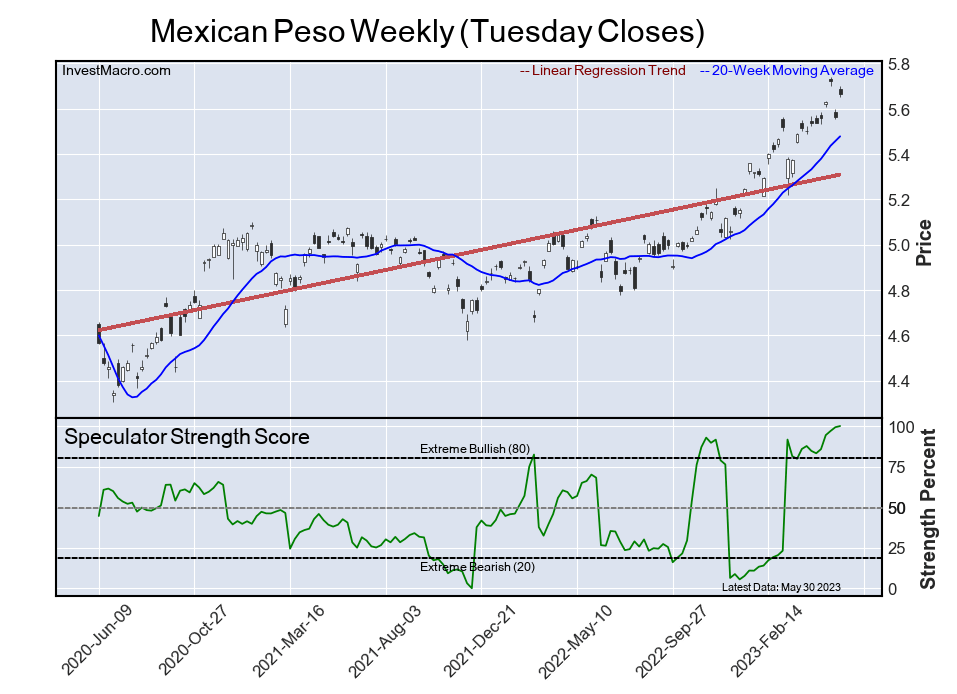
Leading the gains for the currency markets was the Mexican Peso (3,665 contracts) with Bitcoin (582 contracts) also showing a positive week.
The currencies seeing declines in speculator bets on the week were the Australian Dollar (-12,342 contracts), Japanese Yen (-8,624 contracts), Canadian Dollar (-8,415 contracts), EuroFX (-7,304 contracts), Brazilian Real (-5,094 contracts), Swiss Franc (-879 contracts), British Pound (-751 contracts), New Zealand Dollar (-573 contracts) and the US Dollar Index (-549 contracts) also registering lower bets on the week.
Euro Speculators cut their bullish bets for 3rd straight week
Highlighting the COT currency’s data this week is the declining sentiment of the speculator’s positioning in the Euro Currency.
Large speculative Euro positions dropped by over -7,000 contracts this week and fell for a third consecutive week. Euro weekly positions have now decreased by a total of -28,668 contracts over these past three weeks to bring the bullish position to a total of +158,421 contracts, a nine week low. Previously, speculator bets had risen for six straight weeks from April 11th to May 16th and pushed the overall bullish speculative level to the highest standing in the past 137-weeks, dating back to late-September of 2020.
The Euro exchange rate against the US Dollar (EUR/USD) hit over a 12-month high in May above the 1.1000 level and speculators were sharply positioning themselves for it to go higher. This was helped out this year by the interest rate hiking schedule of European Central Bank (ECB) which was raising their rates while the US Federal Reserve was being seen as nearing the end of its own rate hiking campaign.
However, this one-way dynamic has become more cloudy with some recent data-points.
The Eurozone has fallen into a technical recession (2 quarters of negative growth), inflation has started to trend downwards (although still above 6 percent) and there is an expectation there will be possibly only 2 more ECB rate hikes before a pause. Meanwhile, rates traders are expecting (at this moment) the Fed to raise the US interest rate by 25 basis points once again at the July 26th meeting.
The Euro’s market strength recently hit a roadblock at the May high and the psychological level of 1.1000. The Euro has now tumbled in four out of the past five weeks and dropped all the way down to the 1.0635 exchange by the end of May. This week, the Euro rebounded modestly and the weekly closing price was near 1.0750. If speculators continue to further shed Euro positions, it is possible we could see a short-squeeze bring the currency lower still and challenge the 1.0500 level.
| Jun-06-2023 | OI | OI-Index | Spec-Net | Spec-Index | Com-Net | COM-Index | Smalls-Net | Smalls-Index |
|---|---|---|---|---|---|---|---|---|
| USD Index | 33,930 | 32 | 12,219 | 45 | -15,163 | 52 | 2,944 | 49 |
| EUR | 781,967 | 84 | 158,421 | 79 | -203,916 | 22 | 45,495 | 52 |
| GBP | 242,117 | 63 | 12,484 | 80 | -14,124 | 24 | 1,640 | 61 |
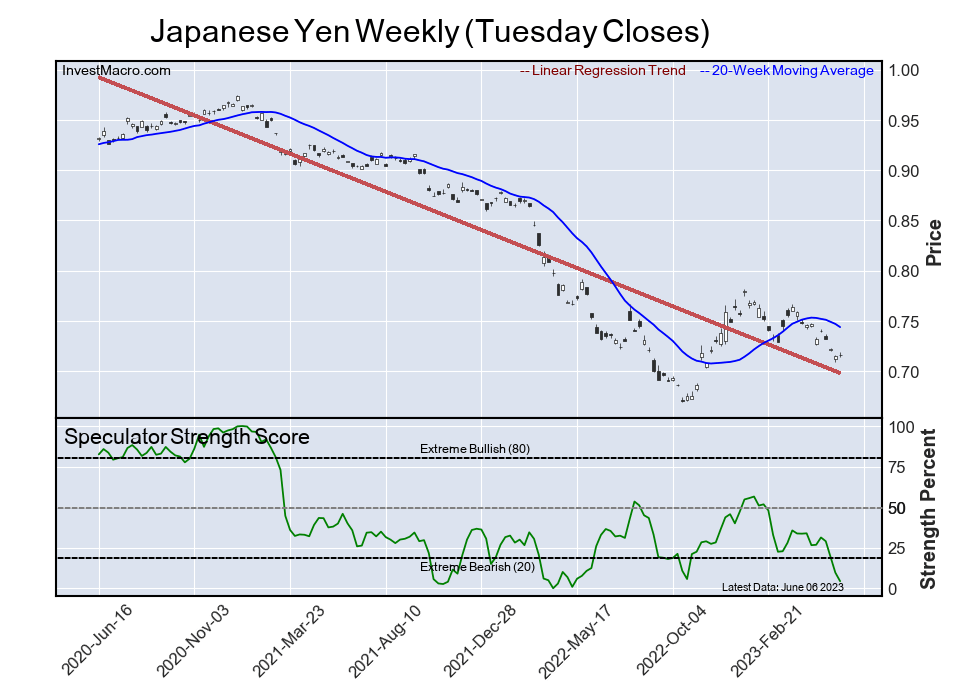
| JPY | 245,332 | 76 | -104,817 | 4 | 113,736 | 91 | -8,919 | 35 |
| CHF | 44,087 | 50 | -1,314 | 51 | 7,048 | 57 | -5,734 | 38 |
| CAD | 168,025 | 42 | -38,329 | 19 | 38,456 | 82 | -127 | 23 |
| AUD | 209,680 | 98 | -56,468 | 32 | 67,496 | 69 | -11,028 | 26 |
| NZD | 41,665 | 39 | -703 | 52 | 2,856 | 53 | -2,153 | 24 |
| MXN | 235,994 | 50 | 81,670 | 100 | -87,777 | 0 | 6,107 | 87 |
| RUB | 20,930 | 4 | 7,543 | 31 | -7,150 | 69 | -393 | 24 |
| BRL | 46,686 | 35 | 26,181 | 69 | -25,721 | 33 | -460 | 40 |
| Bitcoin | 13,026 | 56 | 769 | 90 | -1,196 | 0 | 427 | 23 |
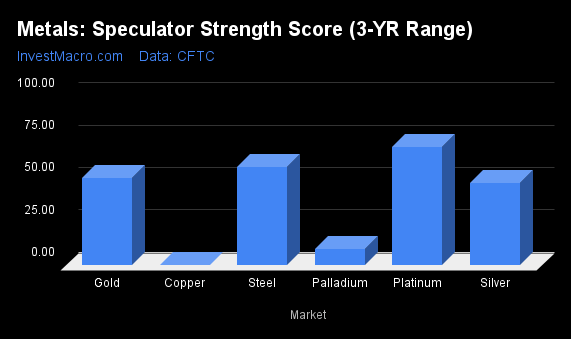
Strength Scores led by Mexican Peso & Bitcoin
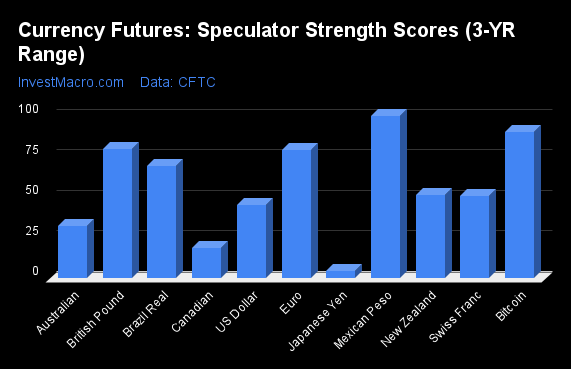
COT Strength Scores (a normalized measure of Speculator positions over a 3-Year range, from 0 to 100 where above 80 is Extreme-Bullish and below 20 is Extreme-Bearish) showed that the Mexican Peso (100 percent), Bitcoin (90 percent) and the British Pound (80 percent) led the currency markets this week. The EuroFX (79 percent) and the Brazilian Real (69 percent) come in as the next highest in the weekly strength scores.
On the downside, the Japanese Yen (4 percent) and the Canadian Dollar (19 percent) come in at the lowest strength levels currently and are in Extreme-Bearish territory (below 20 percent). The next lowest strength scores are the Australian Dollar (32 percent) and the US Dollar Index (45 percent).
Strength Statistics:
US Dollar Index (45.3 percent) vs US Dollar Index previous week (46.2 percent)
EuroFX (79.4 percent) vs EuroFX previous week (82.3 percent)
British Pound Sterling (79.7 percent) vs British Pound Sterling previous week (80.4 percent)
Japanese Yen (4.3 percent) vs Japanese Yen previous week (9.6 percent)
Swiss Franc (51.1 percent) vs Swiss Franc previous week (53.5 percent)
Canadian Dollar (18.8 percent) vs Canadian Dollar previous week (26.7 percent)
Australian Dollar (32.5 percent) vs Australian Dollar previous week (43.9 percent)
New Zealand Dollar (51.7 percent) vs New Zealand Dollar previous week (53.2 percent)
Mexican Peso (100.0 percent) vs Mexican Peso previous week (97.5 percent)
Brazilian Real (69.1 percent) vs Brazilian Real previous week (75.6 percent)
Bitcoin (90.4 percent) vs Bitcoin previous week (80.2 percent)
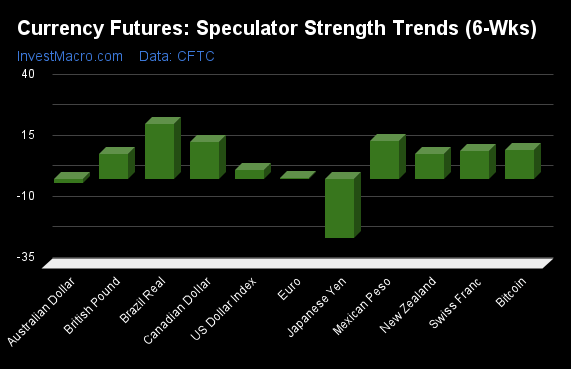
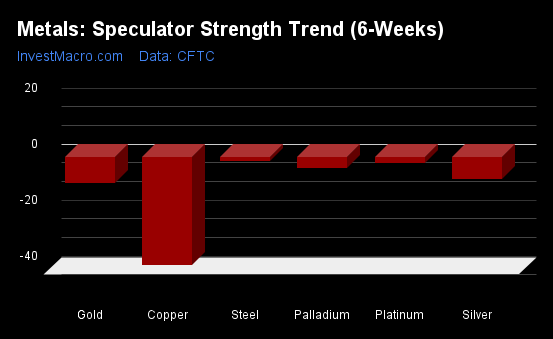
Mexican Peso & Bitcoin top the 6-Week Strength Trends

COT Strength Score Trends (or move index, calculates the 6-week changes in strength scores) showed that the Mexican Peso (19 percent) and the Bitcoin (19 percent) lead the past six weeks trends for the currencies. The Brazilian Real (12 percent), the New Zealand Dollar (7 percent) and the British Pound (6 percent) are the next highest positive movers in the latest trends data.
The Japanese Yen (-22 percent) leads the downside trend scores currently with the Australian Dollar (-16 percent) and the EuroFX (-4 percent) following next with lower trend scores.
Strength Trend Statistics:
US Dollar Index (2.5 percent) vs US Dollar Index previous week (3.8 percent)
EuroFX (-4.2 percent) vs EuroFX previous week (0.5 percent)
British Pound Sterling (5.7 percent) vs British Pound Sterling previous week (10.2 percent)
Japanese Yen (-22.2 percent) vs Japanese Yen previous week (-24.2 percent)
Swiss Franc (6.2 percent) vs Swiss Franc previous week (11.3 percent)
Canadian Dollar (5.1 percent) vs Canadian Dollar previous week (15.2 percent)
Australian Dollar (-15.8 percent) vs Australian Dollar previous week (-1.6 percent)
New Zealand Dollar (6.9 percent) vs New Zealand Dollar previous week (10.2 percent)
Mexican Peso (18.9 percent) vs Mexican Peso previous week (15.0 percent)
Brazilian Real (11.9 percent) vs Brazilian Real previous week (22.5 percent)
Bitcoin (18.5 percent) vs Bitcoin previous week (11.8 percent)
Individual COT Forex Markets:
US Dollar Index Futures:
 The US Dollar Index large speculator standing this week reached a net position of 12,219 contracts in the data reported through Tuesday. This was a weekly fall of -549 contracts from the previous week which had a total of 12,768 net contracts.
This week’s current strength score (the trader positioning range over the past three years, measured from 0 to 100) shows the speculators are currently Bearish with a score of 45.3 percent. The commercials are Bullish with a score of 51.7 percent and the small traders (not shown in chart) are Bearish with a score of 48.7 percent.
| US DOLLAR INDEX Statistics | SPECULATORS | COMMERCIALS | SMALL TRADERS |
| – Percent of Open Interest Longs: | 73.1 | 3.8 | 16.8 |
| – Percent of Open Interest Shorts: | 37.1 | 48.5 | 8.1 |
| – Net Position: | 12,219 | -15,163 | 2,944 |
| – Gross Longs: | 24,791 | 1,280 | 5,698 |
| – Gross Shorts: | 12,572 | 16,443 | 2,754 |
| – Long to Short Ratio: | 2.0 to 1 | 0.1 to 1 | 2.1 to 1 |
| NET POSITION TREND: | |||
| – Strength Index Score (3 Year Range Pct): | 45.3 | 51.7 | 48.7 |
| – Strength Index Reading (3 Year Range): | Bearish | Bullish | Bearish |
| NET POSITION MOVEMENT INDEX: | |||
| – 6-Week Change in Strength Index: | 2.5 | -3.9 | 10.6 |
Euro Currency Futures:
 The Euro Currency large speculator standing this week reached a net position of 158,421 contracts in the data reported through Tuesday. This was a weekly lowering of -7,304 contracts from the previous week which had a total of 165,725 net contracts.
This week’s current strength score (the trader positioning range over the past three years, measured from 0 to 100) shows the speculators are currently Bullish with a score of 79.4 percent. The commercials are Bearish with a score of 21.6 percent and the small traders (not shown in chart) are Bullish with a score of 51.6 percent.
| EURO Currency Statistics | SPECULATORS | COMMERCIALS | SMALL TRADERS |
| – Percent of Open Interest Longs: | 30.2 | 53.7 | 12.2 |
| – Percent of Open Interest Shorts: | 9.9 | 79.7 | 6.4 |
| – Net Position: | 158,421 | -203,916 | 45,495 |
| – Gross Longs: | 236,060 | 419,532 | 95,766 |
| – Gross Shorts: | 77,639 | 623,448 | 50,271 |
| – Long to Short Ratio: | 3.0 to 1 | 0.7 to 1 | 1.9 to 1 |
| NET POSITION TREND: | |||
| – Strength Index Score (3 Year Range Pct): | 79.4 | 21.6 | 51.6 |
| – Strength Index Reading (3 Year Range): | Bullish | Bearish | Bullish |
| NET POSITION MOVEMENT INDEX: | |||
| – 6-Week Change in Strength Index: | -4.2 | 6.9 | -15.2 |
British Pound Sterling Futures:
 The British Pound Sterling large speculator standing this week reached a net position of 12,484 contracts in the data reported through Tuesday. This was a weekly reduction of -751 contracts from the previous week which had a total of 13,235 net contracts.
This week’s current strength score (the trader positioning range over the past three years, measured from 0 to 100) shows the speculators are currently Bullish with a score of 79.7 percent. The commercials are Bearish with a score of 24.5 percent and the small traders (not shown in chart) are Bullish with a score of 61.2 percent.
| BRITISH POUND Statistics | SPECULATORS | COMMERCIALS | SMALL TRADERS |
| – Percent of Open Interest Longs: | 26.9 | 53.0 | 12.1 |
| – Percent of Open Interest Shorts: | 21.7 | 58.9 | 11.4 |
| – Net Position: | 12,484 | -14,124 | 1,640 |
| – Gross Longs: | 65,063 | 128,441 | 29,200 |
| – Gross Shorts: | 52,579 | 142,565 | 27,560 |
| – Long to Short Ratio: | 1.2 to 1 | 0.9 to 1 | 1.1 to 1 |
| NET POSITION TREND: | |||
| – Strength Index Score (3 Year Range Pct): | 79.7 | 24.5 | 61.2 |
| – Strength Index Reading (3 Year Range): | Bullish | Bearish | Bullish |
| NET POSITION MOVEMENT INDEX: | |||
| – 6-Week Change in Strength Index: | 5.7 | -2.4 | -6.0 |
Japanese Yen Futures:
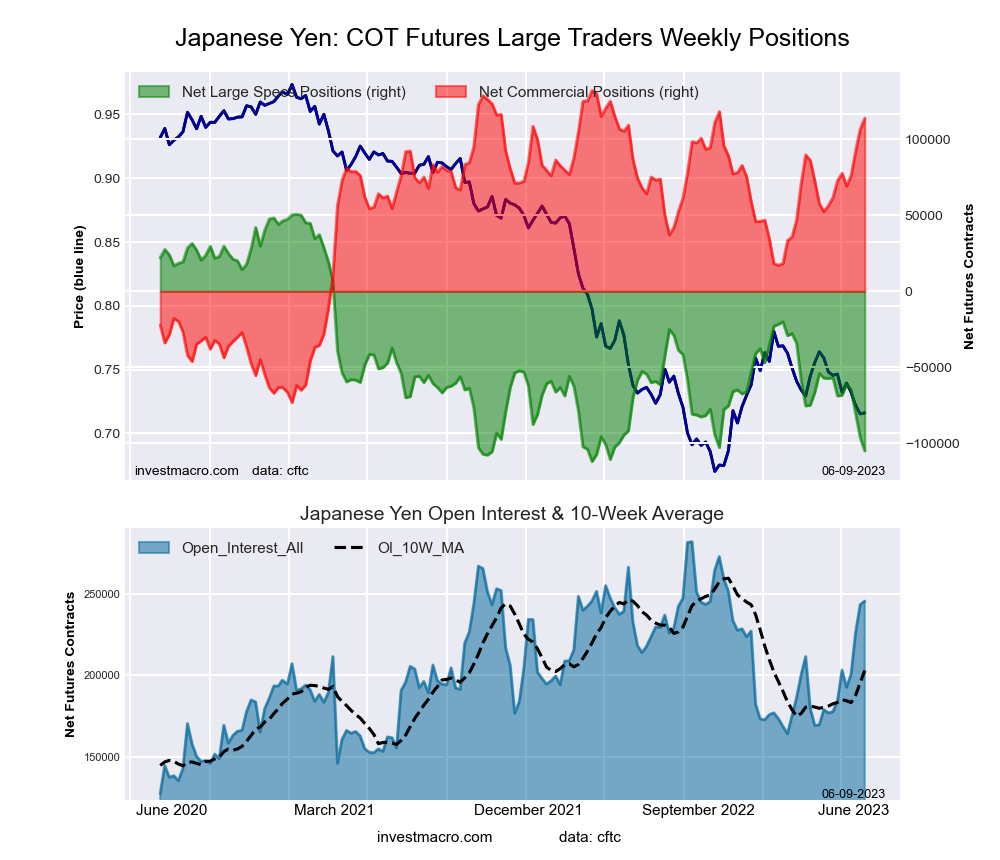 The Japanese Yen large speculator standing this week reached a net position of -104,817 contracts in the data reported through Tuesday. This was a weekly decline of -8,624 contracts from the previous week which had a total of -96,193 net contracts.
This week’s current strength score (the trader positioning range over the past three years, measured from 0 to 100) shows the speculators are currently Bearish-Extreme with a score of 4.3 percent. The commercials are Bullish-Extreme with a score of 91.1 percent and the small traders (not shown in chart) are Bearish with a score of 35.3 percent.
| JAPANESE YEN Statistics | SPECULATORS | COMMERCIALS | SMALL TRADERS |
| – Percent of Open Interest Longs: | 13.9 | 71.1 | 12.5 |
| – Percent of Open Interest Shorts: | 56.6 | 24.8 | 16.2 |
| – Net Position: | -104,817 | 113,736 | -8,919 |
| – Gross Longs: | 34,151 | 174,461 | 30,731 |
| – Gross Shorts: | 138,968 | 60,725 | 39,650 |
| – Long to Short Ratio: | 0.2 to 1 | 2.9 to 1 | 0.8 to 1 |
| NET POSITION TREND: | |||
| – Strength Index Score (3 Year Range Pct): | 4.3 | 91.1 | 35.3 |
| – Strength Index Reading (3 Year Range): | Bearish-Extreme | Bullish-Extreme | Bearish |
| NET POSITION MOVEMENT INDEX: | |||
| – 6-Week Change in Strength Index: | -22.2 | 20.1 | -10.2 |
Swiss Franc Futures:
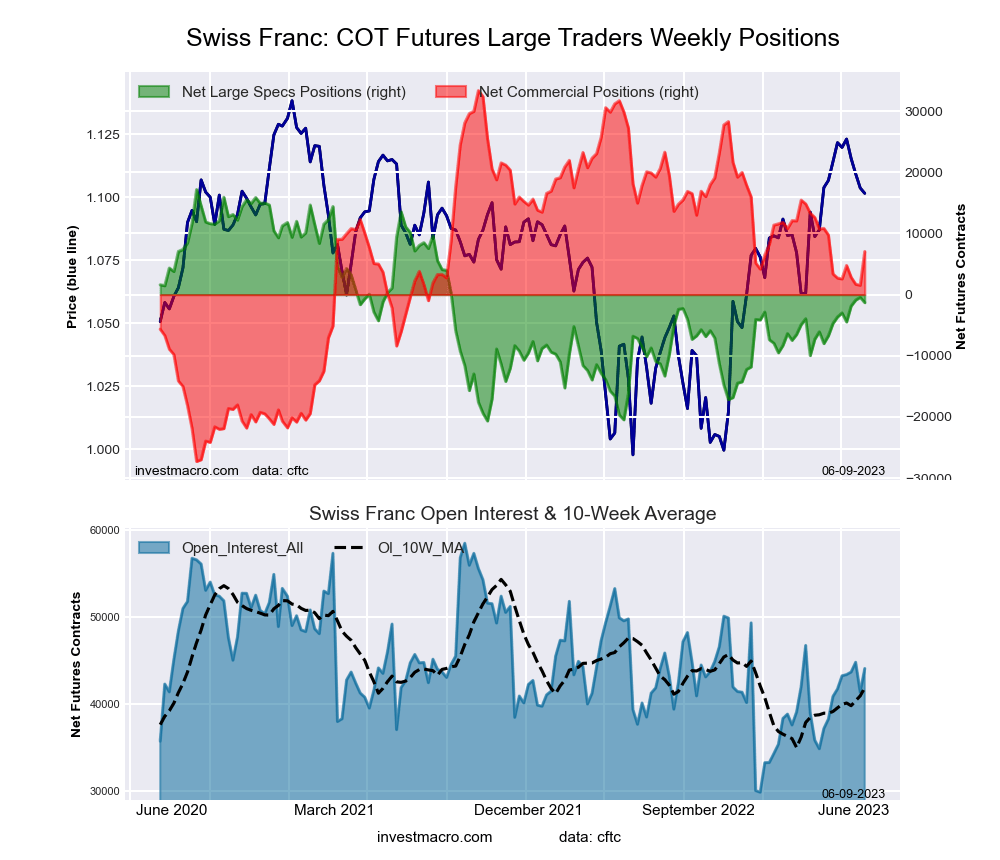 The Swiss Franc large speculator standing this week reached a net position of -1,314 contracts in the data reported through Tuesday. This was a weekly decline of -879 contracts from the previous week which had a total of -435 net contracts.
This week’s current strength score (the trader positioning range over the past three years, measured from 0 to 100) shows the speculators are currently Bullish with a score of 51.1 percent. The commercials are Bullish with a score of 56.6 percent and the small traders (not shown in chart) are Bearish with a score of 38.1 percent.
| SWISS FRANC Statistics | SPECULATORS | COMMERCIALS | SMALL TRADERS |
| – Percent of Open Interest Longs: | 26.3 | 47.0 | 25.7 |
| – Percent of Open Interest Shorts: | 29.2 | 31.0 | 38.7 |
| – Net Position: | -1,314 | 7,048 | -5,734 |
| – Gross Longs: | 11,579 | 20,726 | 11,309 |
| – Gross Shorts: | 12,893 | 13,678 | 17,043 |
| – Long to Short Ratio: | 0.9 to 1 | 1.5 to 1 | 0.7 to 1 |
| NET POSITION TREND: | |||
| – Strength Index Score (3 Year Range Pct): | 51.1 | 56.6 | 38.1 |
| – Strength Index Reading (3 Year Range): | Bullish | Bullish | Bearish |
| NET POSITION MOVEMENT INDEX: | |||
| – 6-Week Change in Strength Index: | 6.2 | 7.2 | -22.6 |
Canadian Dollar Futures:
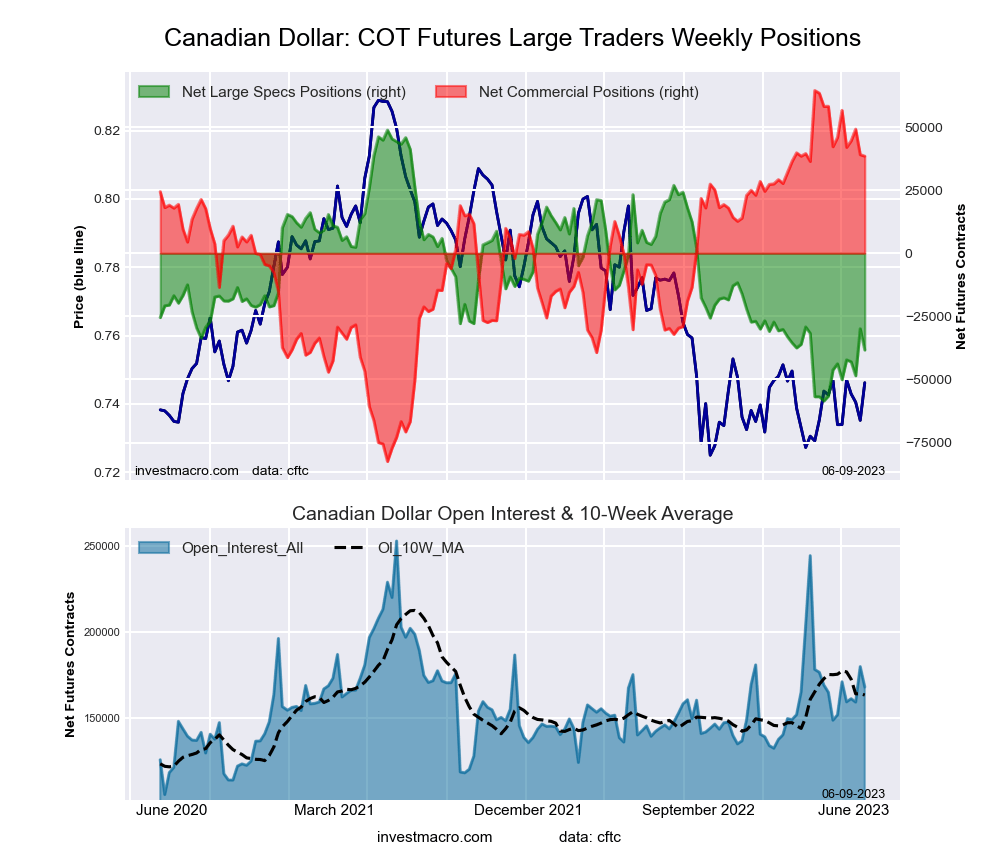 The Canadian Dollar large speculator standing this week reached a net position of -38,329 contracts in the data reported through Tuesday. This was a weekly decline of -8,415 contracts from the previous week which had a total of -29,914 net contracts.
This week’s current strength score (the trader positioning range over the past three years, measured from 0 to 100) shows the speculators are currently Bearish-Extreme with a score of 18.8 percent. The commercials are Bullish-Extreme with a score of 82.3 percent and the small traders (not shown in chart) are Bearish with a score of 22.5 percent.
| CANADIAN DOLLAR Statistics | SPECULATORS | COMMERCIALS | SMALL TRADERS |
| – Percent of Open Interest Longs: | 12.9 | 63.1 | 18.7 |
| – Percent of Open Interest Shorts: | 35.7 | 40.2 | 18.7 |
| – Net Position: | -38,329 | 38,456 | -127 |
| – Gross Longs: | 21,709 | 106,003 | 31,338 |
| – Gross Shorts: | 60,038 | 67,547 | 31,465 |
| – Long to Short Ratio: | 0.4 to 1 | 1.6 to 1 | 1.0 to 1 |
| NET POSITION TREND: | |||
| – Strength Index Score (3 Year Range Pct): | 18.8 | 82.3 | 22.5 |
| – Strength Index Reading (3 Year Range): | Bearish-Extreme | Bullish-Extreme | Bearish |
| NET POSITION MOVEMENT INDEX: | |||
| – 6-Week Change in Strength Index: | 5.1 | -5.1 | 4.4 |
Australian Dollar Futures:
 The Australian Dollar large speculator standing this week reached a net position of -56,468 contracts in the data reported through Tuesday. This was a weekly reduction of -12,342 contracts from the previous week which had a total of -44,126 net contracts.
This week’s current strength score (the trader positioning range over the past three years, measured from 0 to 100) shows the speculators are currently Bearish with a score of 32.5 percent. The commercials are Bullish with a score of 69.2 percent and the small traders (not shown in chart) are Bearish with a score of 25.5 percent.
| AUSTRALIAN DOLLAR Statistics | SPECULATORS | COMMERCIALS | SMALL TRADERS |
| – Percent of Open Interest Longs: | 26.0 | 57.1 | 9.2 |
| – Percent of Open Interest Shorts: | 52.9 | 24.9 | 14.5 |
| – Net Position: | -56,468 | 67,496 | -11,028 |
| – Gross Longs: | 54,501 | 119,775 | 19,365 |
| – Gross Shorts: | 110,969 | 52,279 | 30,393 |
| – Long to Short Ratio: | 0.5 to 1 | 2.3 to 1 | 0.6 to 1 |
| NET POSITION TREND: | |||
| – Strength Index Score (3 Year Range Pct): | 32.5 | 69.2 | 25.5 |
| – Strength Index Reading (3 Year Range): | Bearish | Bullish | Bearish |
| NET POSITION MOVEMENT INDEX: | |||
| – 6-Week Change in Strength Index: | -15.8 | 10.3 | 7.9 |
New Zealand Dollar Futures:
 The New Zealand Dollar large speculator standing this week reached a net position of -703 contracts in the data reported through Tuesday. This was a weekly reduction of -573 contracts from the previous week which had a total of -130 net contracts.
This week’s current strength score (the trader positioning range over the past three years, measured from 0 to 100) shows the speculators are currently Bullish with a score of 51.7 percent. The commercials are Bullish with a score of 53.2 percent and the small traders (not shown in chart) are Bearish with a score of 24.4 percent.
| NEW ZEALAND DOLLAR Statistics | SPECULATORS | COMMERCIALS | SMALL TRADERS |
| – Percent of Open Interest Longs: | 38.7 | 45.5 | 8.4 |
| – Percent of Open Interest Shorts: | 40.4 | 38.6 | 13.6 |
| – Net Position: | -703 | 2,856 | -2,153 |
| – Gross Longs: | 16,109 | 18,954 | 3,502 |
| – Gross Shorts: | 16,812 | 16,098 | 5,655 |
| – Long to Short Ratio: | 1.0 to 1 | 1.2 to 1 | 0.6 to 1 |
| NET POSITION TREND: | |||
| – Strength Index Score (3 Year Range Pct): | 51.7 | 53.2 | 24.4 |
| – Strength Index Reading (3 Year Range): | Bullish | Bullish | Bearish |
| NET POSITION MOVEMENT INDEX: | |||
| – 6-Week Change in Strength Index: | 6.9 | -2.5 | -17.6 |
Mexican Peso Futures:
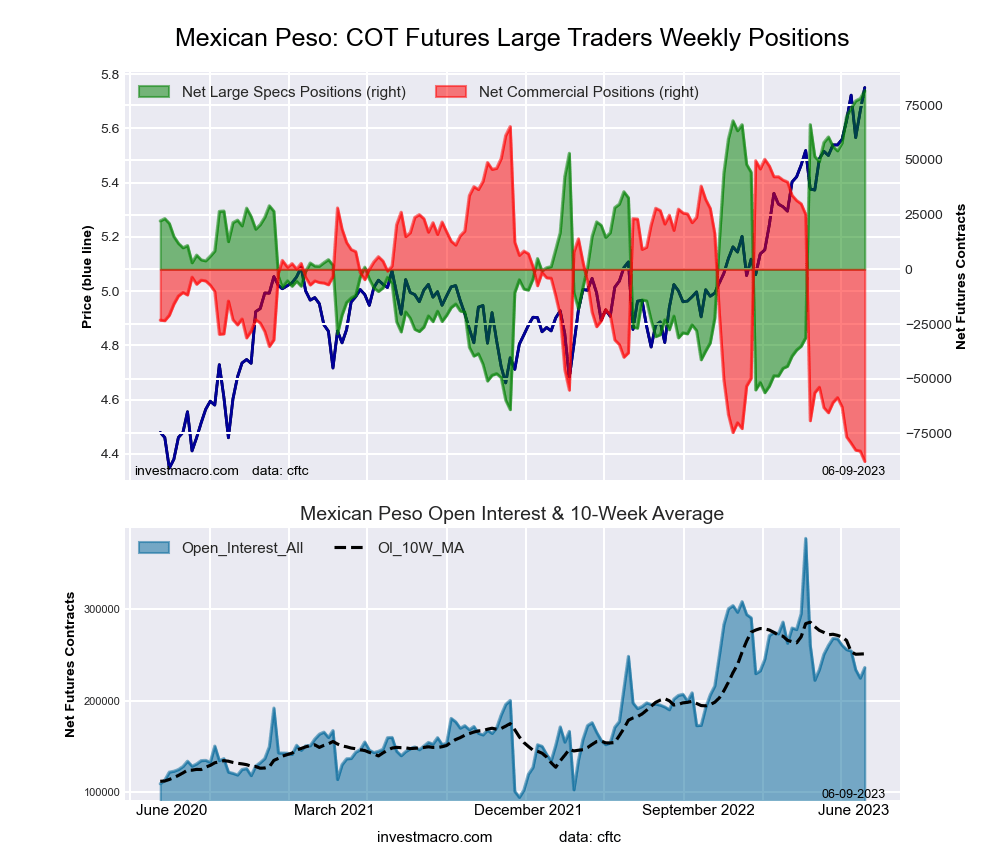 The Mexican Peso large speculator standing this week reached a net position of 81,670 contracts in the data reported through Tuesday. This was a weekly advance of 3,665 contracts from the previous week which had a total of 78,005 net contracts.
This week’s current strength score (the trader positioning range over the past three years, measured from 0 to 100) shows the speculators are currently Bullish-Extreme with a score of 100.0 percent. The commercials are Bearish-Extreme with a score of 0.0 percent and the small traders (not shown in chart) are Bullish-Extreme with a score of 87.4 percent.
| MEXICAN PESO Statistics | SPECULATORS | COMMERCIALS | SMALL TRADERS |
| – Percent of Open Interest Longs: | 52.3 | 41.6 | 3.9 |
| – Percent of Open Interest Shorts: | 17.7 | 78.8 | 1.3 |
| – Net Position: | 81,670 | -87,777 | 6,107 |
| – Gross Longs: | 123,447 | 98,261 | 9,230 |
| – Gross Shorts: | 41,777 | 186,038 | 3,123 |
| – Long to Short Ratio: | 3.0 to 1 | 0.5 to 1 | 3.0 to 1 |
| NET POSITION TREND: | |||
| – Strength Index Score (3 Year Range Pct): | 100.0 | 0.0 | 87.4 |
| – Strength Index Reading (3 Year Range): | Bullish-Extreme | Bearish-Extreme | Bullish-Extreme |
| NET POSITION MOVEMENT INDEX: | |||
| – 6-Week Change in Strength Index: | 18.9 | -19.1 | 18.1 |
Brazilian Real Futures:
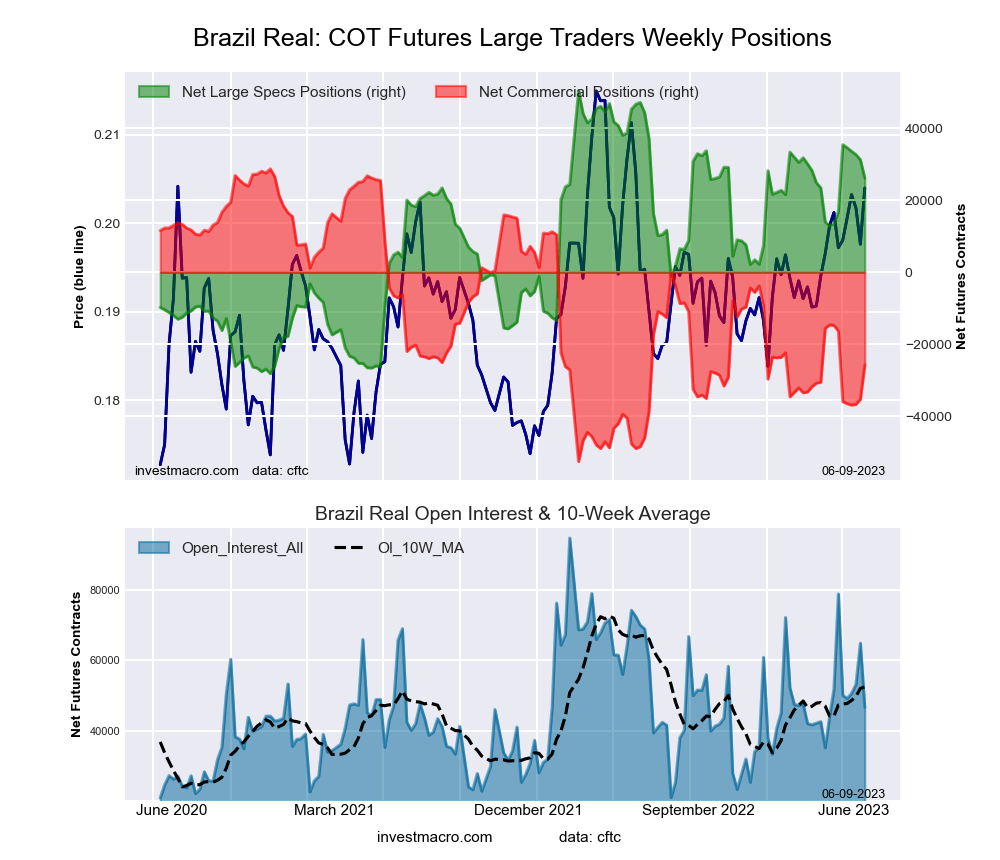 The Brazilian Real large speculator standing this week reached a net position of 26,181 contracts in the data reported through Tuesday. This was a weekly reduction of -5,094 contracts from the previous week which had a total of 31,275 net contracts.
This week’s current strength score (the trader positioning range over the past three years, measured from 0 to 100) shows the speculators are currently Bullish with a score of 69.1 percent. The commercials are Bearish with a score of 33.0 percent and the small traders (not shown in chart) are Bearish with a score of 40.3 percent.
| BRAZIL REAL Statistics | SPECULATORS | COMMERCIALS | SMALL TRADERS |
| – Percent of Open Interest Longs: | 68.4 | 21.3 | 10.3 |
| – Percent of Open Interest Shorts: | 12.3 | 76.4 | 11.2 |
| – Net Position: | 26,181 | -25,721 | -460 |
| – Gross Longs: | 31,930 | 9,947 | 4,791 |
| – Gross Shorts: | 5,749 | 35,668 | 5,251 |
| – Long to Short Ratio: | 5.6 to 1 | 0.3 to 1 | 0.9 to 1 |
| NET POSITION TREND: | |||
| – Strength Index Score (3 Year Range Pct): | 69.1 | 33.0 | 40.3 |
| – Strength Index Reading (3 Year Range): | Bullish | Bearish | Bearish |
| NET POSITION MOVEMENT INDEX: | |||
| – 6-Week Change in Strength Index: | 11.9 | -11.5 | 0.1 |
Bitcoin Futures:
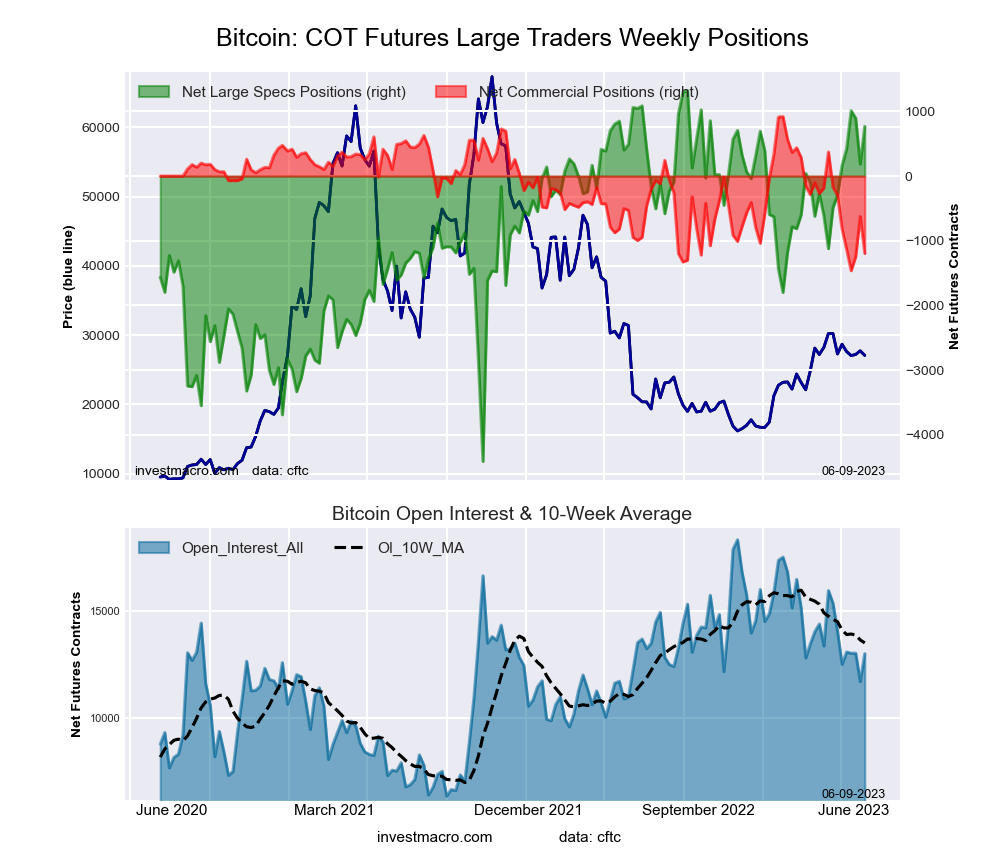 The Bitcoin large speculator standing this week reached a net position of 769 contracts in the data reported through Tuesday. This was a weekly gain of 582 contracts from the previous week which had a total of 187 net contracts.
This week’s current strength score (the trader positioning range over the past three years, measured from 0 to 100) shows the speculators are currently Bullish-Extreme with a score of 90.4 percent. The commercials are Bearish-Extreme with a score of 11.2 percent and the small traders (not shown in chart) are Bearish with a score of 22.6 percent.
| BITCOIN Statistics | SPECULATORS | COMMERCIALS | SMALL TRADERS |
| – Percent of Open Interest Longs: | 77.6 | 1.4 | 9.0 |
| – Percent of Open Interest Shorts: | 71.7 | 10.6 | 5.7 |
| – Net Position: | 769 | -1,196 | 427 |
| – Gross Longs: | 10,106 | 187 | 1,172 |
| – Gross Shorts: | 9,337 | 1,383 | 745 |
| – Long to Short Ratio: | 1.1 to 1 | 0.1 to 1 | 1.6 to 1 |
| NET POSITION TREND: | |||
| – Strength Index Score (3 Year Range Pct): | 90.4 | 11.2 | 22.6 |
| – Strength Index Reading (3 Year Range): | Bullish-Extreme | Bearish-Extreme | Bearish |
| NET POSITION MOVEMENT INDEX: | |||
| – 6-Week Change in Strength Index: | 18.5 | -37.8 | -3.7 |
Article By InvestMacro – Receive our weekly COT Newsletter
*COT Report: The COT data, released weekly to the public each Friday, is updated through the most recent Tuesday (data is 3 days old) and shows a quick view of how large speculators or non-commercials (for-profit traders) were positioned in the futures markets.
The CFTC categorizes trader positions according to commercial hedgers (traders who use futures contracts for hedging as part of the business), non-commercials (large traders who speculate to realize trading profits) and nonreportable traders (usually small traders/speculators) as well as their open interest (contracts open in the market at time of reporting). See CFTC criteria here.


