
By InvestMacro
Here are the latest charts and statistics for the Commitment of Traders (COT) data published by the Commodities Futures Trading Commission (CFTC).
The latest COT data is updated through Tuesday May 23rd and shows a quick view of how large traders (for-profit speculators and commercial entities) were positioned in the futures markets.
Weekly Speculator Changes led by Copper & Platinum
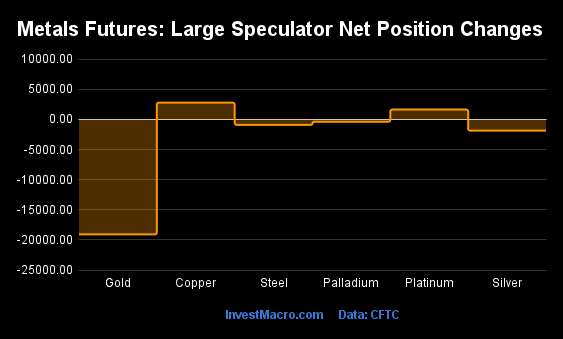
The COT metals markets speculator bets were lower this week as two out of the six metals markets we cover had higher positioning while the other four markets had lower speculator contracts.
Free Reports:
 Get our Weekly Commitment of Traders Reports - See where the biggest traders (Hedge Funds and Commercial Hedgers) are positioned in the futures markets on a weekly basis.
 Download Our Metatrader 4 Indicators – Put Our Free MetaTrader 4 Custom Indicators on your charts when you join our Weekly Newsletter
Leading the gains for the metals was Copper (2,799 contracts) with Platinum (1,656 contracts) also showing positive weeks.
The markets with declines in speculator bets for the week were Gold (-19,082 contracts), Silver (-1,857 contracts), Steel (-891 contracts) and Palladium (-373 contracts).
Highlights of this week’s positions:
The largest mover of the week this week was the Gold speculative position. The large speculative position of Gold futures fell by over -19,000 contracts this week following a decline by -16,000 contracts last week. These declines have not taken much off the overall net position that has been trending higher since late in 2022 and recently reaching an approximate 1-year high of +195,814 contracts on May 9th. Gold prices have been strong lately as well with Gold futures prices reaching their highest levels since 2020 at over $2,000 in early May.
Copper speculator bets rebounded a bit this week after dropping for four weeks in a row and for six out of the past seven weeks. Copper positions have been dented by less than expected economic activity out of China and last week the Copper speculator positions dropped to the most bearish level in the past 165-weeks. Copper prices have also been on the downtrend since last year and have fallen approximately 25 percent from the highs of March 2022.
The Platinum speculative position continues to increase higher and has risen in six out of the past nine weeks. Platinum fundamentals have been boosted with car manufacturers starting to use more Platinum in their products, especially in electric vehicles. The futures price fell this week but has been in an uptrend since bottoming in September and recently touched its highest level in over a year at $1148.90 in late-April.
| May-23-2023 | OI | OI-Index | Spec-Net | Spec-Index | Com-Net | COM-Index | Smalls-Net | Smalls-Index |
|---|---|---|---|---|---|---|---|---|
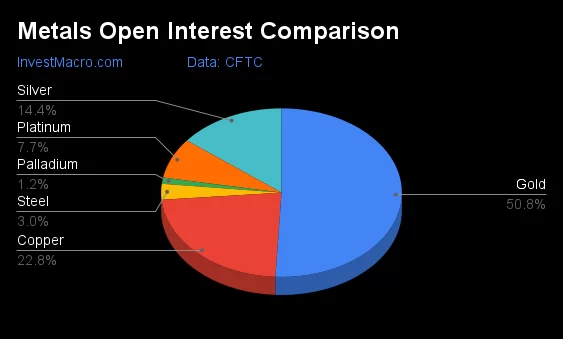
| Gold | 479,080 | 26 | 160,732 | 48 | -187,023 | 52 | 26,291 | 46 |
| Silver | 135,740 | 21 | 21,958 | 50 | -34,972 | 52 | 13,014 | 39 |
| Copper | 215,394 | 55 | -29,808 | 2 | 27,496 | 97 | 2,312 | 33 |
| Palladium | 11,138 | 71 | -5,289 | 17 | 5,669 | 85 | -380 | 19 |
| Platinum | 73,079 | 82 | 27,479 | 79 | -32,157 | 27 | 4,678 | 31 |
Strength Scores led by Platinum & Steel
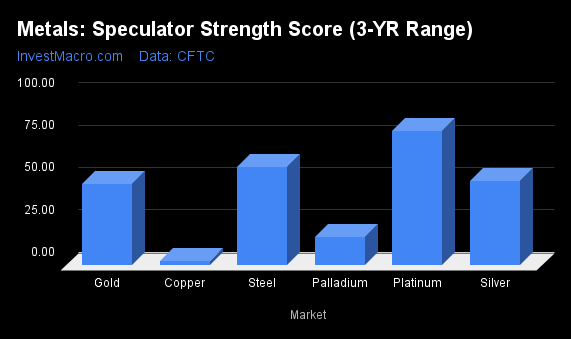
COT Strength Scores (a normalized measure of Speculator positions over a 3-Year range, from 0 to 100 where above 80 is Extreme-Bullish and below 20 is Extreme-Bearish) showed that Platinum (79 percent) and Steel (58 percent) lead the metals markets this week. Silver (50 percent) comes in as the next highest in the weekly strength scores.
On the downside, Copper (2 percent) and Palladium (17 percent) come in at the lowest strength levels currently and are in Extreme-Bearish territory (below 20 percent).
Strength Statistics:
Gold (47.8 percent) vs Gold previous week (56.2 percent)
Silver (49.6 percent) vs Silver previous week (52.2 percent)
Copper (2.5 percent) vs Copper previous week (0.0 percent)
Platinum (79.0 percent) vs Platinum previous week (75.2 percent)
Palladium (16.7 percent) vs Palladium previous week (20.1 percent)
Steel (57.8 percent) vs Palladium previous week (60.4 percent)
Platinum & Palladium top the 6-Week Strength Trends
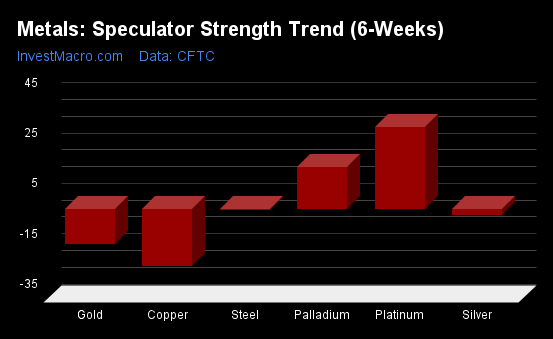
COT Strength Score Trends (or move index, calculates the 6-week changes in strength scores) showed that Platinum (33 percent) and Palladium (16 percent) lead the past six weeks trends for metals.
Copper (-23 percent) leads the downside trend scores currently with Gold (-14 percent) as the next market with lower trend scores.
Move Statistics:
Gold (-14.1 percent) vs Gold previous week (-6.8 percent)
Silver (-2.5 percent) vs Silver previous week (3.6 percent)
Copper (-22.6 percent) vs Copper previous week (-26.3 percent)
Platinum (32.6 percent) vs Platinum previous week (24.0 percent)
Palladium (16.5 percent) vs Palladium previous week (16.0 percent)
Steel (-0.6 percent) vs Steel previous week (-0.8 percent)
Individual Markets:
Gold Comex Futures:
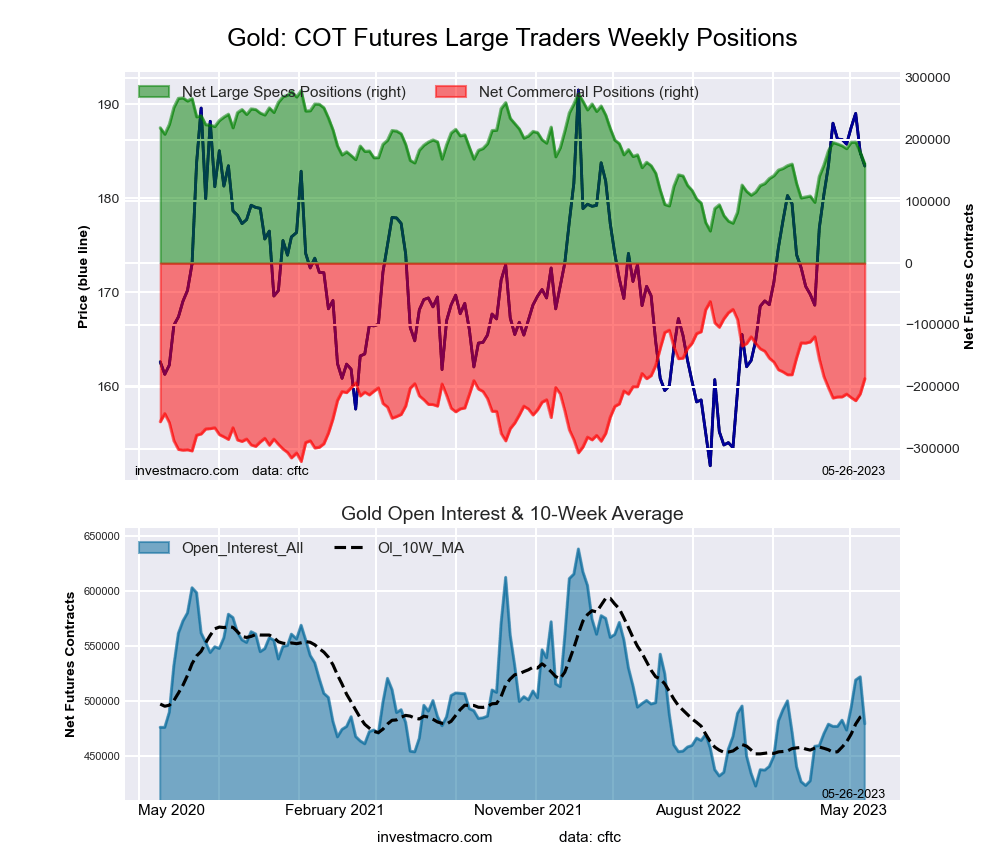 The Gold Comex Futures large speculator standing this week equaled a net position of 160,732 contracts in the data reported through Tuesday. This was a weekly decline of -19,082 contracts from the previous week which had a total of 179,814 net contracts.
This week’s current strength score (the trader positioning range over the past three years, measured from 0 to 100) shows the speculators are currently Bearish with a score of 47.8 percent. The commercials are Bullish with a score of 51.7 percent and the small traders (not shown in chart) are Bearish with a score of 45.9 percent.
| Gold Futures Statistics | SPECULATORS | COMMERCIALS | SMALL TRADERS |
| – Percent of Open Interest Longs: | 49.3 | 29.8 | 10.3 |
| – Percent of Open Interest Shorts: | 15.7 | 68.9 | 4.8 |
| – Net Position: | 160,732 | -187,023 | 26,291 |
| – Gross Longs: | 236,149 | 142,984 | 49,327 |
| – Gross Shorts: | 75,417 | 330,007 | 23,036 |
| – Long to Short Ratio: | 3.1 to 1 | 0.4 to 1 | 2.1 to 1 |
| NET POSITION TREND: | |||
| – Strength Index Score (3 Year Range Pct): | 47.8 | 51.7 | 45.9 |
| – Strength Index Reading (3 Year Range): | Bearish | Bullish | Bearish |
| NET POSITION MOVEMENT INDEX: | |||
| – 6-Week Change in Strength Index: | -14.1 | 11.4 | 6.3 |
Silver Comex Futures:
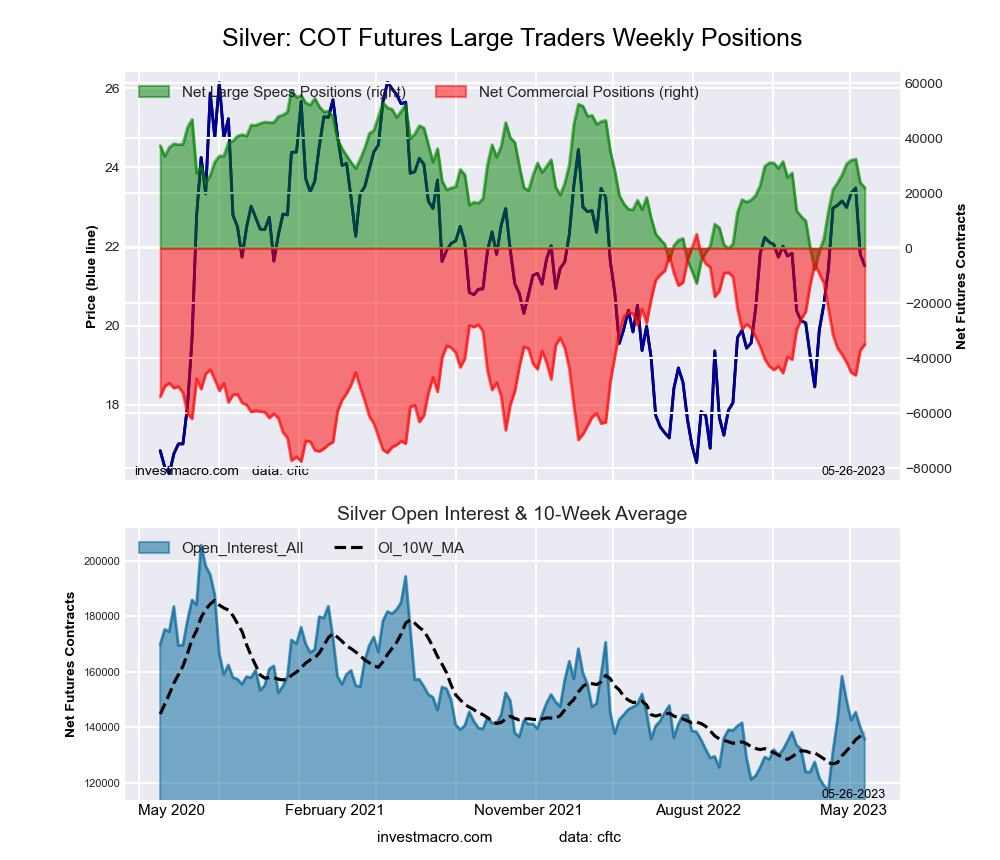 The Silver Comex Futures large speculator standing this week equaled a net position of 21,958 contracts in the data reported through Tuesday. This was a weekly lowering of -1,857 contracts from the previous week which had a total of 23,815 net contracts.
This week’s current strength score (the trader positioning range over the past three years, measured from 0 to 100) shows the speculators are currently Bearish with a score of 49.6 percent. The commercials are Bullish with a score of 51.5 percent and the small traders (not shown in chart) are Bearish with a score of 38.7 percent.
| Silver Futures Statistics | SPECULATORS | COMMERCIALS | SMALL TRADERS |
| – Percent of Open Interest Longs: | 41.8 | 31.1 | 18.9 |
| – Percent of Open Interest Shorts: | 25.6 | 56.8 | 9.3 |
| – Net Position: | 21,958 | -34,972 | 13,014 |
| – Gross Longs: | 56,686 | 42,194 | 25,655 |
| – Gross Shorts: | 34,728 | 77,166 | 12,641 |
| – Long to Short Ratio: | 1.6 to 1 | 0.5 to 1 | 2.0 to 1 |
| NET POSITION TREND: | |||
| – Strength Index Score (3 Year Range Pct): | 49.6 | 51.5 | 38.7 |
| – Strength Index Reading (3 Year Range): | Bearish | Bullish | Bearish |
| NET POSITION MOVEMENT INDEX: | |||
| – 6-Week Change in Strength Index: | -2.5 | 1.6 | 2.7 |
Copper Grade #1 Futures:
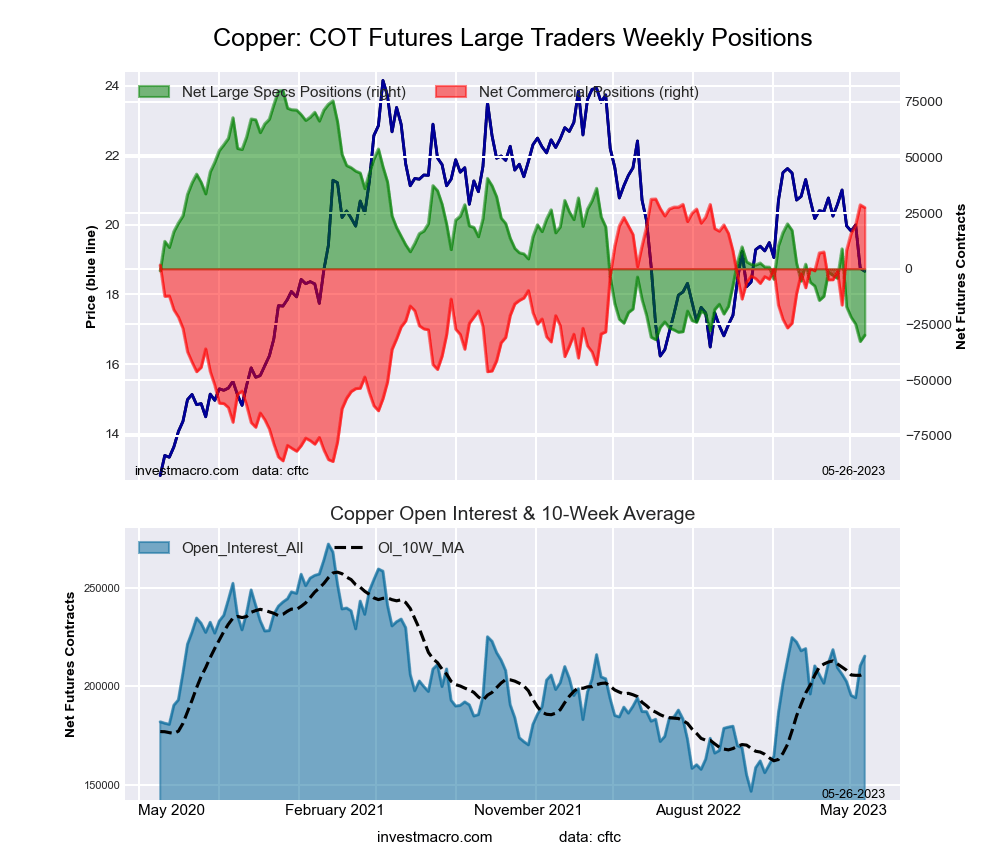 The Copper Grade #1 Futures large speculator standing this week equaled a net position of -29,808 contracts in the data reported through Tuesday. This was a weekly boost of 2,799 contracts from the previous week which had a total of -32,607 net contracts.
This week’s current strength score (the trader positioning range over the past three years, measured from 0 to 100) shows the speculators are currently Bearish-Extreme with a score of 2.5 percent. The commercials are Bullish-Extreme with a score of 96.7 percent and the small traders (not shown in chart) are Bearish with a score of 33.1 percent.
| Copper Futures Statistics | SPECULATORS | COMMERCIALS | SMALL TRADERS |
| – Percent of Open Interest Longs: | 28.5 | 47.0 | 8.3 |
| – Percent of Open Interest Shorts: | 42.4 | 34.2 | 7.3 |
| – Net Position: | -29,808 | 27,496 | 2,312 |
| – Gross Longs: | 61,463 | 101,169 | 17,941 |
| – Gross Shorts: | 91,271 | 73,673 | 15,629 |
| – Long to Short Ratio: | 0.7 to 1 | 1.4 to 1 | 1.1 to 1 |
| NET POSITION TREND: | |||
| – Strength Index Score (3 Year Range Pct): | 2.5 | 96.7 | 33.1 |
| – Strength Index Reading (3 Year Range): | Bearish-Extreme | Bullish-Extreme | Bearish |
| NET POSITION MOVEMENT INDEX: | |||
| – 6-Week Change in Strength Index: | -22.6 | 24.4 | -20.2 |
Platinum Futures:
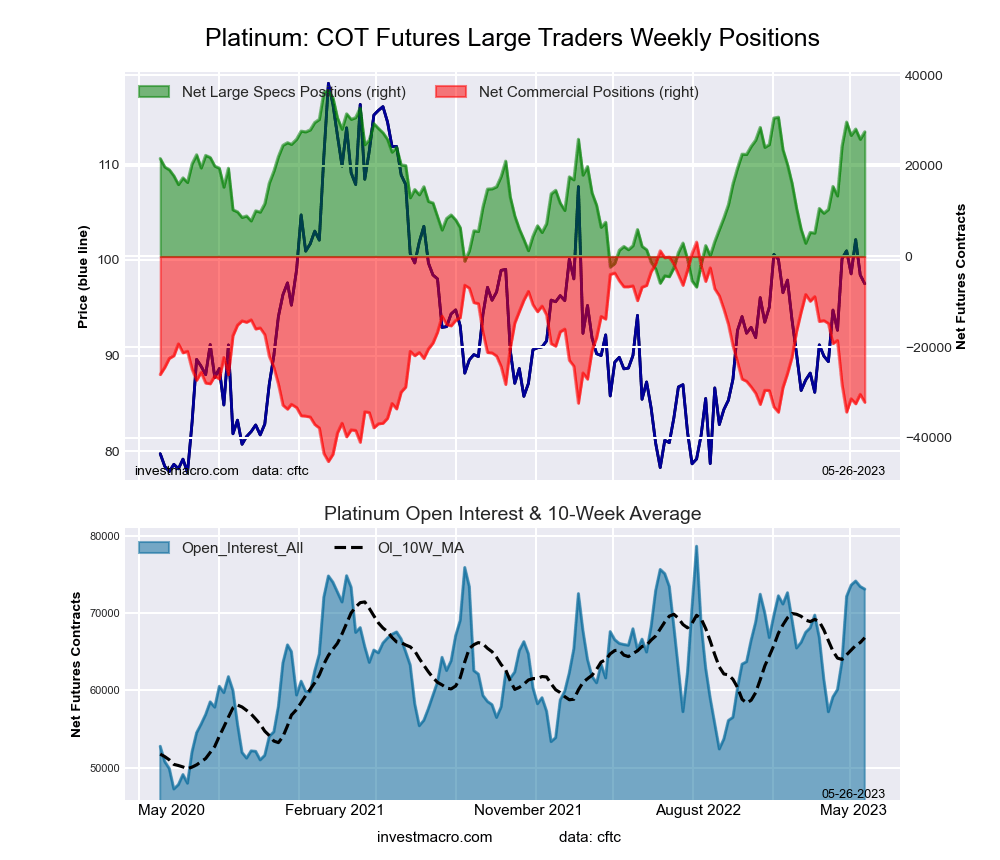 The Platinum Futures large speculator standing this week equaled a net position of 27,479 contracts in the data reported through Tuesday. This was a weekly increase of 1,656 contracts from the previous week which had a total of 25,823 net contracts.
This week’s current strength score (the trader positioning range over the past three years, measured from 0 to 100) shows the speculators are currently Bullish with a score of 79.0 percent. The commercials are Bearish with a score of 27.0 percent and the small traders (not shown in chart) are Bearish with a score of 30.8 percent.
| Platinum Futures Statistics | SPECULATORS | COMMERCIALS | SMALL TRADERS |
| – Percent of Open Interest Longs: | 56.4 | 27.0 | 10.0 |
| – Percent of Open Interest Shorts: | 18.8 | 71.0 | 3.6 |
| – Net Position: | 27,479 | -32,157 | 4,678 |
| – Gross Longs: | 41,246 | 19,698 | 7,306 |
| – Gross Shorts: | 13,767 | 51,855 | 2,628 |
| – Long to Short Ratio: | 3.0 to 1 | 0.4 to 1 | 2.8 to 1 |
| NET POSITION TREND: | |||
| – Strength Index Score (3 Year Range Pct): | 79.0 | 27.0 | 30.8 |
| – Strength Index Reading (3 Year Range): | Bullish | Bearish | Bearish |
| NET POSITION MOVEMENT INDEX: | |||
| – 6-Week Change in Strength Index: | 32.6 | -28.2 | -6.7 |
Palladium Futures:
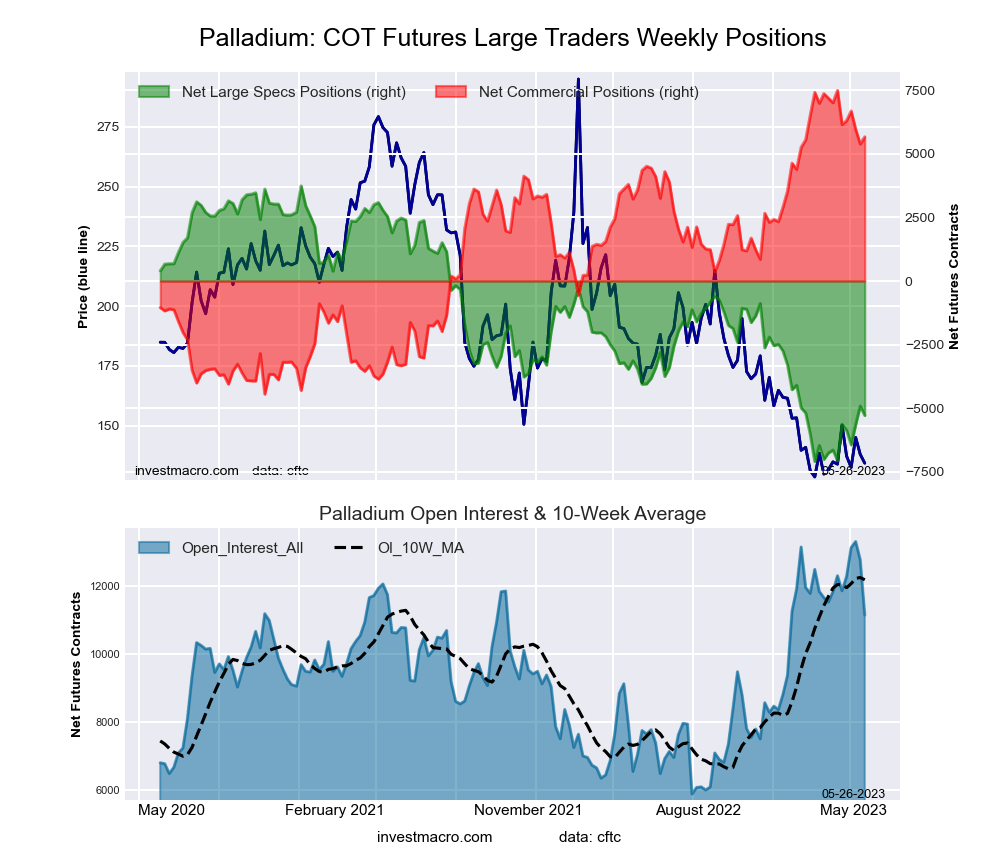 The Palladium Futures large speculator standing this week equaled a net position of -5,289 contracts in the data reported through Tuesday. This was a weekly decrease of -373 contracts from the previous week which had a total of -4,916 net contracts.
This week’s current strength score (the trader positioning range over the past three years, measured from 0 to 100) shows the speculators are currently Bearish-Extreme with a score of 16.7 percent. The commercials are Bullish-Extreme with a score of 84.7 percent and the small traders (not shown in chart) are Bearish-Extreme with a score of 18.9 percent.
| Palladium Futures Statistics | SPECULATORS | COMMERCIALS | SMALL TRADERS |
| – Percent of Open Interest Longs: | 15.4 | 66.4 | 12.4 |
| – Percent of Open Interest Shorts: | 62.9 | 15.5 | 15.8 |
| – Net Position: | -5,289 | 5,669 | -380 |
| – Gross Longs: | 1,720 | 7,400 | 1,379 |
| – Gross Shorts: | 7,009 | 1,731 | 1,759 |
| – Long to Short Ratio: | 0.2 to 1 | 4.3 to 1 | 0.8 to 1 |
| NET POSITION TREND: | |||
| – Strength Index Score (3 Year Range Pct): | 16.7 | 84.7 | 18.9 |
| – Strength Index Reading (3 Year Range): | Bearish-Extreme | Bullish-Extreme | Bearish-Extreme |
| NET POSITION MOVEMENT INDEX: | |||
| – 6-Week Change in Strength Index: | 16.5 | -15.3 | 2.3 |
Steel Futures Futures:
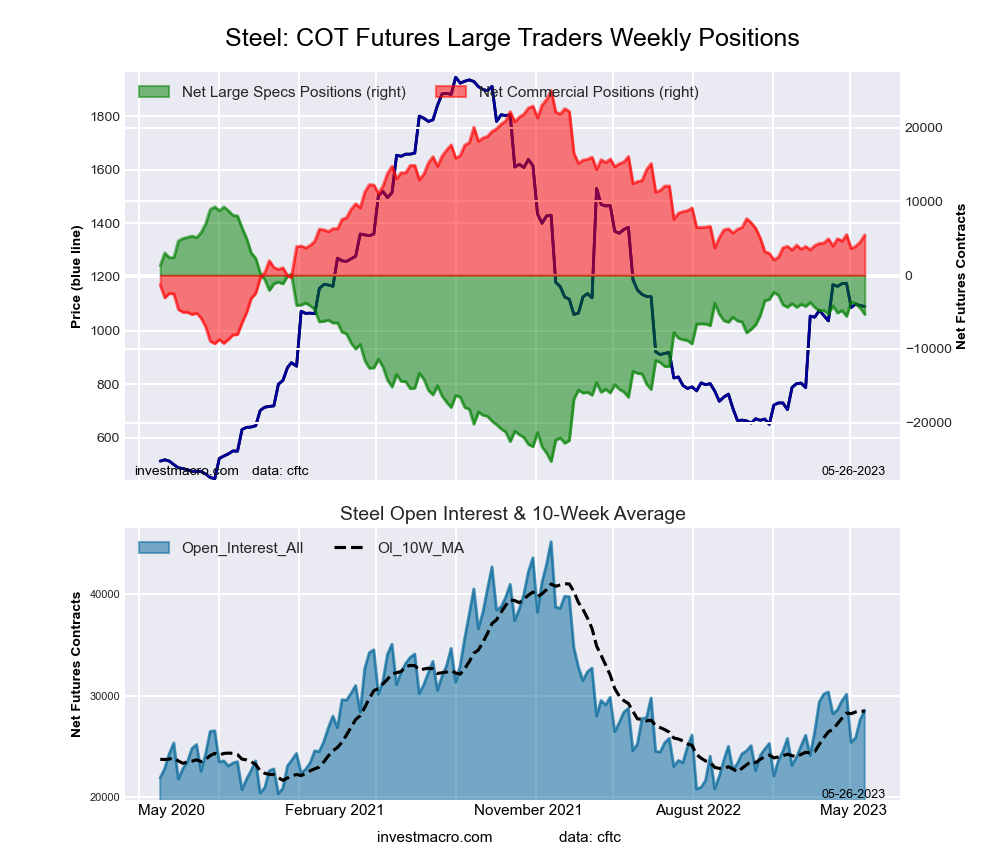 The Steel Futures large speculator standing this week equaled a net position of -5,311 contracts in the data reported through Tuesday. This was a weekly fall of -891 contracts from the previous week which had a total of -4,420 net contracts.
This week’s current strength score (the trader positioning range over the past three years, measured from 0 to 100) shows the speculators are currently Bullish with a score of 57.8 percent. The commercials are Bearish with a score of 42.9 percent and the small traders (not shown in chart) are Bearish-Extreme with a score of 0.0 percent.
| Steel Futures Statistics | SPECULATORS | COMMERCIALS | SMALL TRADERS |
| – Percent of Open Interest Longs: | 7.4 | 82.6 | 0.7 |
| – Percent of Open Interest Shorts: | 26.0 | 63.5 | 1.2 |
| – Net Position: | -5,311 | 5,467 | -156 |
| – Gross Longs: | 2,112 | 23,604 | 191 |
| – Gross Shorts: | 7,423 | 18,137 | 347 |
| – Long to Short Ratio: | 0.3 to 1 | 1.3 to 1 | 0.6 to 1 |
| NET POSITION TREND: | |||
| – Strength Index Score (3 Year Range Pct): | 57.8 | 42.9 | 0.0 |
| – Strength Index Reading (3 Year Range): | Bullish | Bearish | Bearish-Extreme |
| NET POSITION MOVEMENT INDEX: | |||
| – 6-Week Change in Strength Index: | -0.6 | 1.5 | -40.4 |
Article By InvestMacro – Receive our weekly COT Newsletter
*COT Report: The COT data, released weekly to the public each Friday, is updated through the most recent Tuesday (data is 3 days old) and shows a quick view of how large speculators or non-commercials (for-profit traders) were positioned in the futures markets.
The CFTC categorizes trader positions according to commercial hedgers (traders who use futures contracts for hedging as part of the business), non-commercials (large traders who speculate to realize trading profits) and nonreportable traders (usually small traders/speculators) as well as their open interest (contracts open in the market at time of reporting). See CFTC criteria here.

- Geopolitical and macroeconomic conditions continue to pressure market sentiment Jul 20, 2026
- USD/JPY Poised to Continue Gains as Expensive Oil and Lack of Support Weigh on Yen Jul 20, 2026
- COT Metals Charts: Weekly Speculator Bets led by Copper & Steel Jul 18, 2026
- COT Bonds Charts: Weekly Speculator Bets led by 2-Year, SOFR 3M & 5-Year Bonds Jul 18, 2026
- COT Energy Charts: Weekly Speculator Bets led by Brent Oil & Heating Oil Jul 18, 2026
- COT Soft Commodities Charts: Weekly Speculator Bets led by Wheat, Corn & Soybean Meal Jul 18, 2026
- The Bank of Canada kept its interest rate unchanged. Platinum prices reached a three‑week high Jul 16, 2026
- Stock indices rose after the release of US inflation data. China’s GDP slowed sharply Jul 15, 2026
- GBP/USD Awaits Political News: What Will Happen Next Jul 15, 2026
- USD/JPY Holds at Highs: Pressure Lingers on Yen Jul 14, 2026