By InvestMacro
Here are the latest charts and statistics for the Commitment of Traders (COT) reports data published by the Commodities Futures Trading Commission (CFTC).
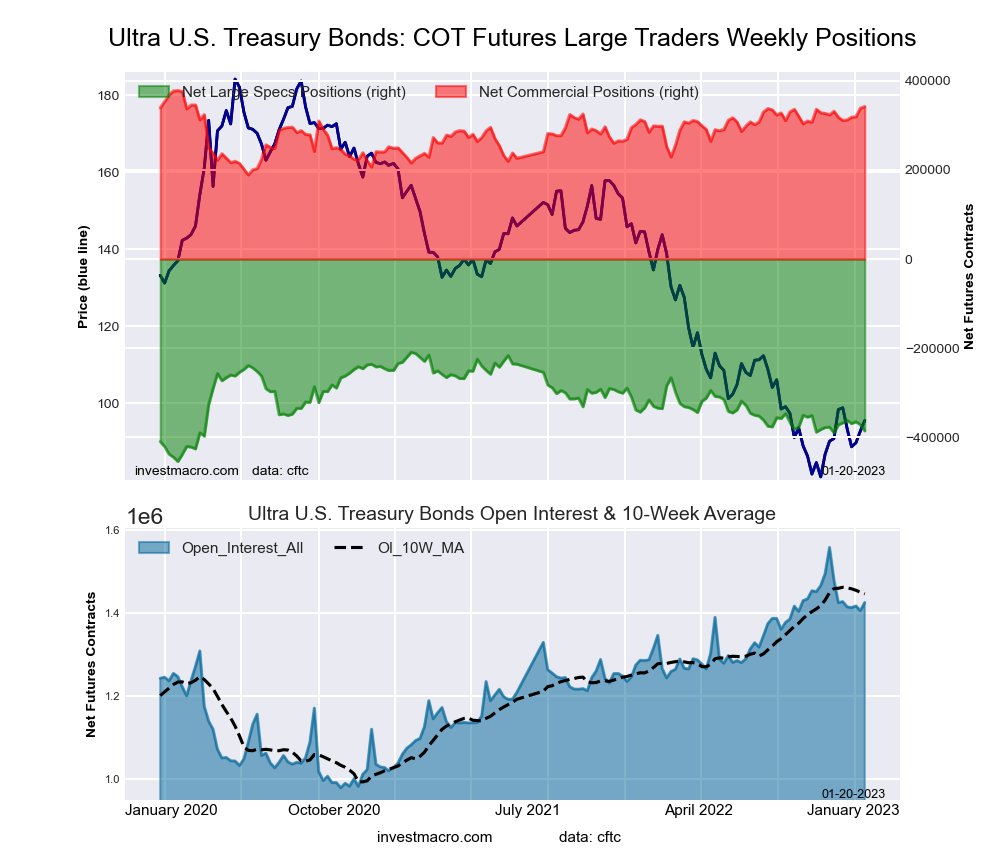
The latest COT data is updated through Tuesday January 24th and shows a quick view of how large traders (for-profit speculators and commercial entities) were positioned in the futures markets.
Weekly Speculator Changes led by Cotton & Corn
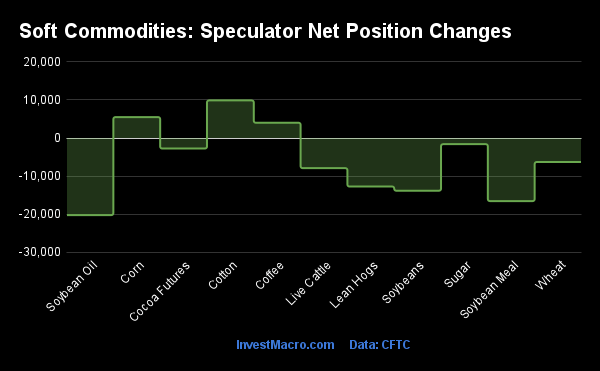
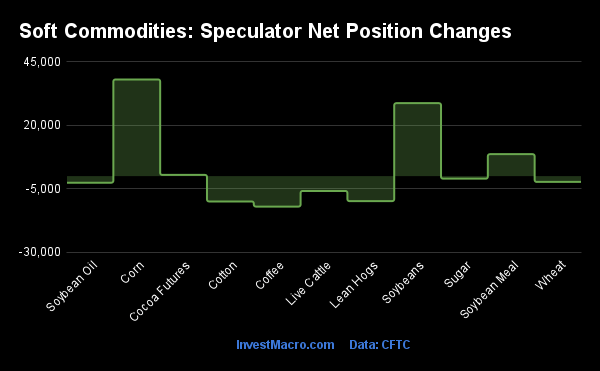
The COT soft commodities markets speculator bets were lower this week as just three out of the eleven softs markets we cover had higher positioning while the other eight markets had lower speculator contracts.
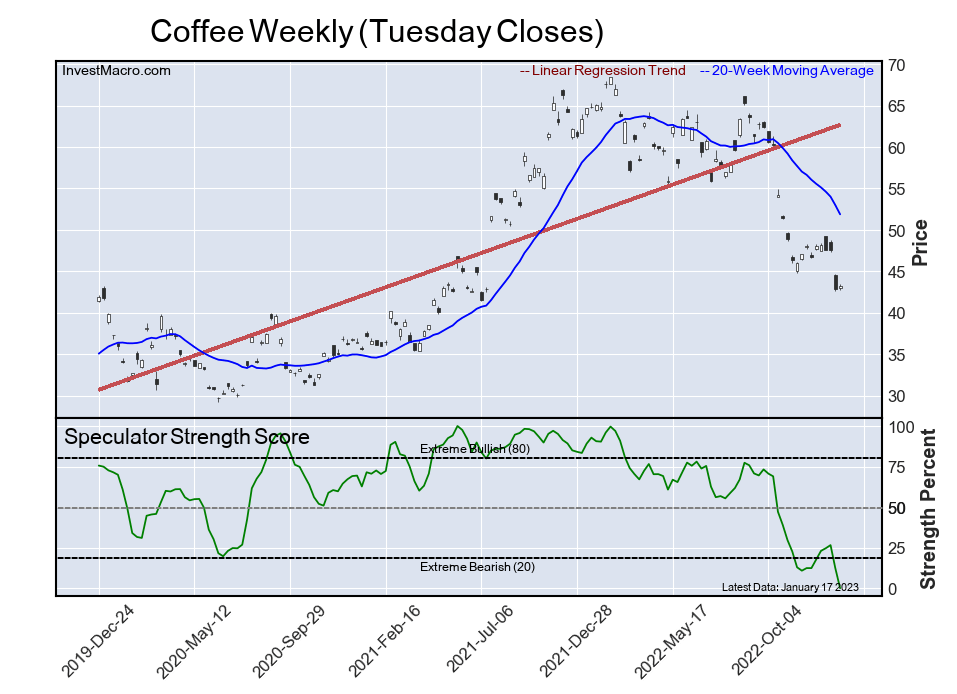
Leading the gains for the softs markets was Cotton (9,880 contracts) with Corn (5,496 contracts) and Coffee (4,017 contracts) also having positive weeks.
The markets with the declines in speculator bets this week were Soybean Oil (-20,245 contracts) with Soybean Meal (-16,565 contracts), Soybeans (-13,843 contracts), Lean Hogs (-12,741 contracts), Live Cattle (-7,915 contracts), Wheat (-6,306 contracts), Cocoa (-2,757 contracts) and Sugar (-1,614 contracts) also registering lower bets on the week.
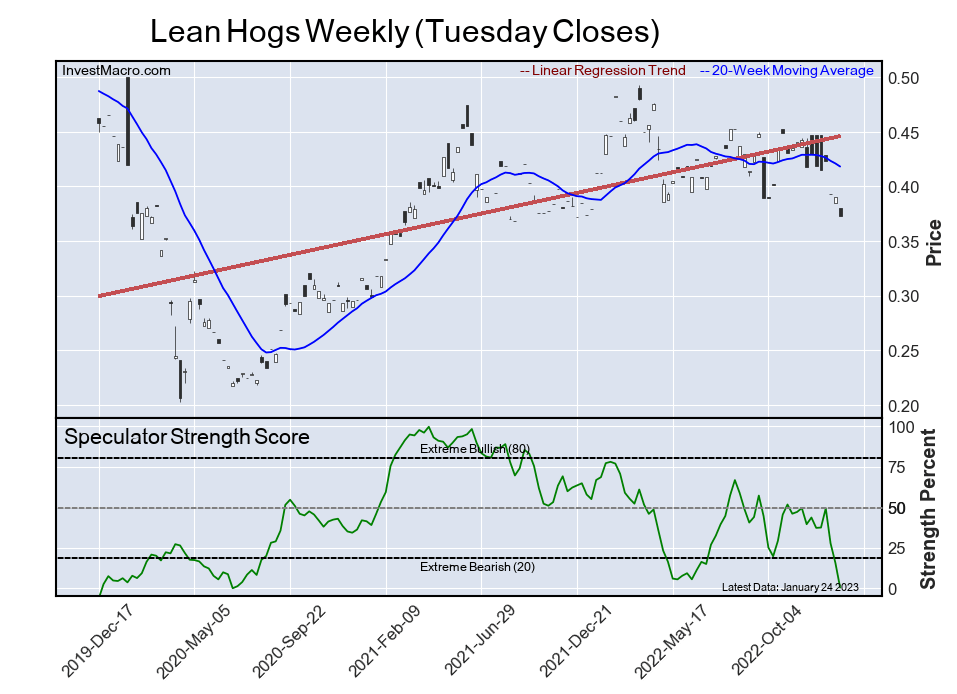
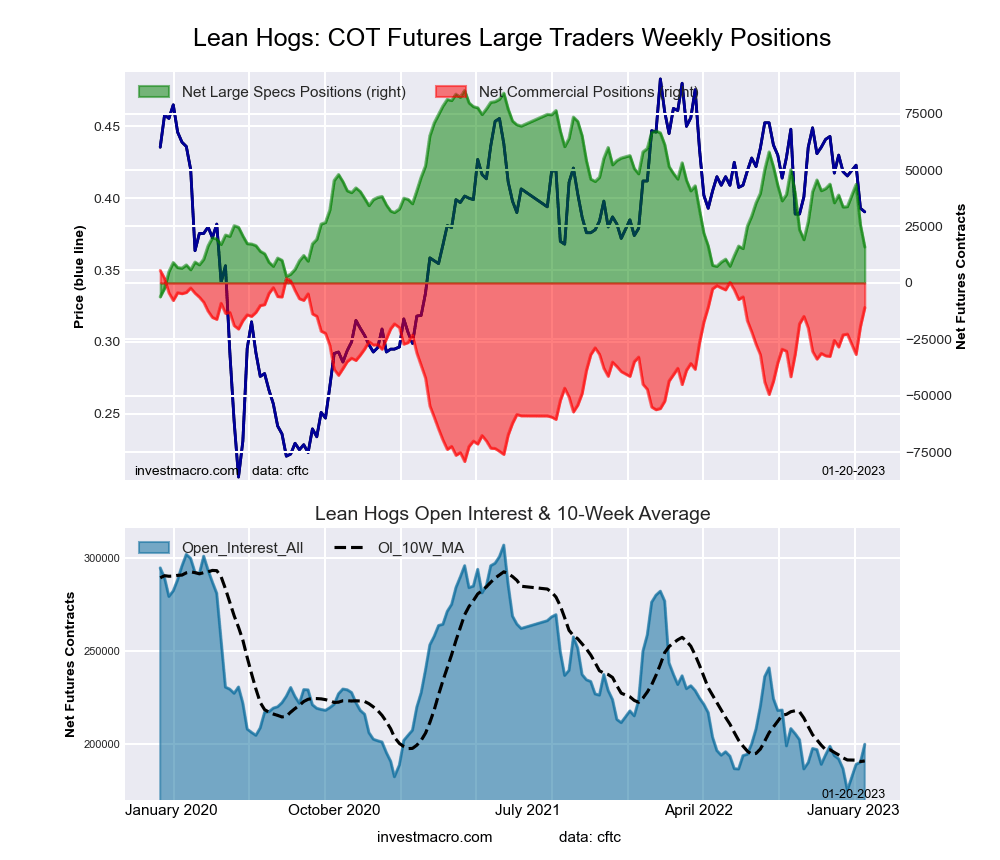
Highlighting the COT soft commodities data this week is the swift and strong decrease in the Lean Hogs speculator’s positioning. The large speculator bets for Lean Hogs fell this week for a fourth consecutive week (by a total of -41,547 contracts) and for the sixth time in the past nine weeks.
The speculator’s net position has dropped from a total of +44,713 contracts on December 27th to an overall bullish level of just +3,166 contracts this week. This recent weakness in speculator sentiment has now pushed the overall net position standing for Lean Hogs to the lowest level in the past 134 weeks, dating back to June 30th of 2020.
Lean Hogs prices have been under pressure since reaching a recent high in July above the 115.00 price level as the market has responded to ample hogs supply. Since then, the Lean Hog futures price (front-month) has fallen by over 30 percent and closed this week at the lowest level since late in 2021.
| Jan-24-2023 | OI | OI-Index | Spec-Net | Spec-Index | Com-Net | COM-Index | Smalls-Net | Smalls-Index |
|---|
| WTI Crude | 1,660,450 | 23 | 249,799 | 12 | -273,246 | 88 | 23,447 | 38 |
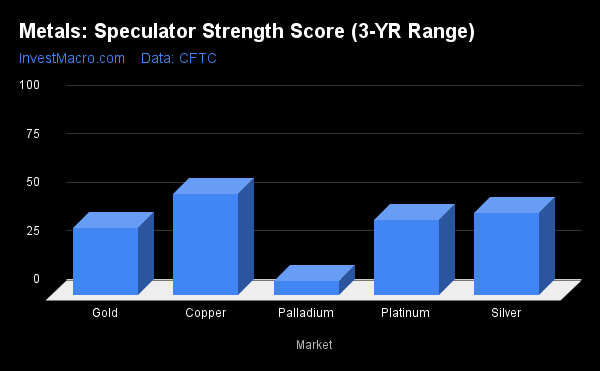
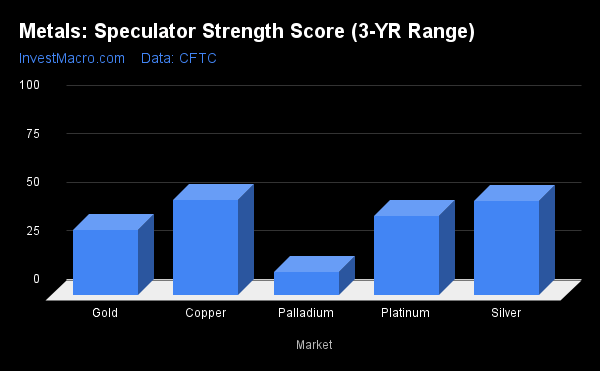
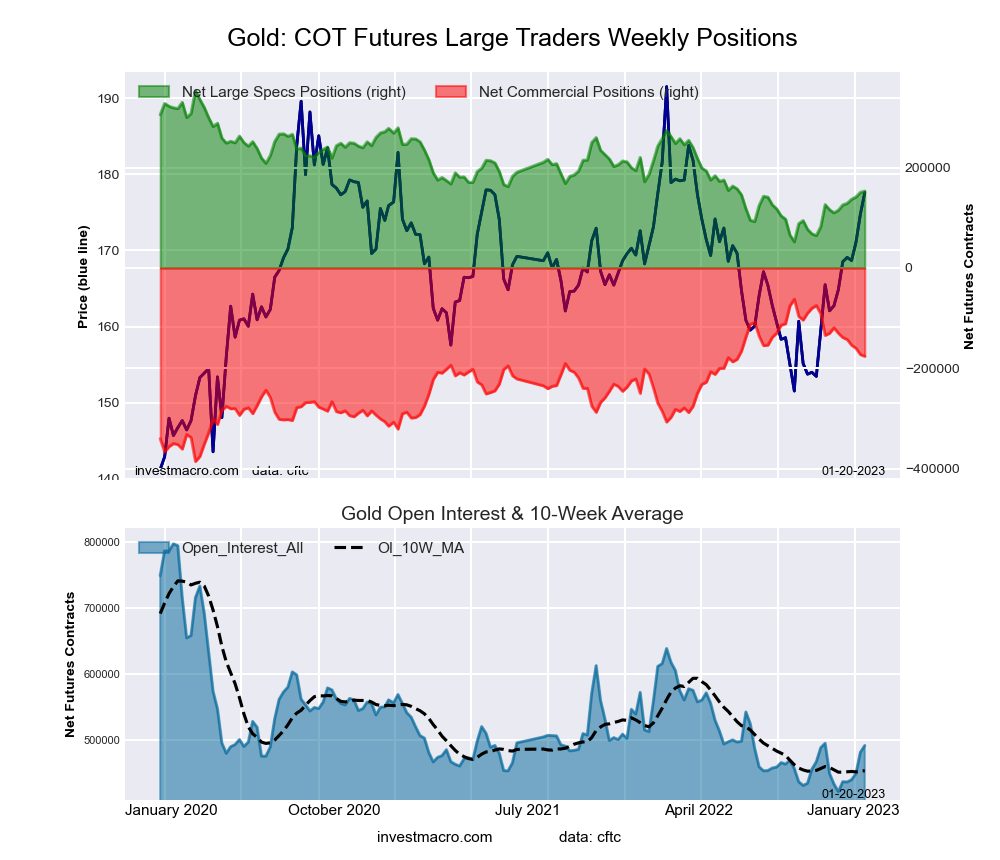
| Gold | 499,927 | 25 | 157,673 | 35 | -180,554 | 63 | 22,881 | 37 |
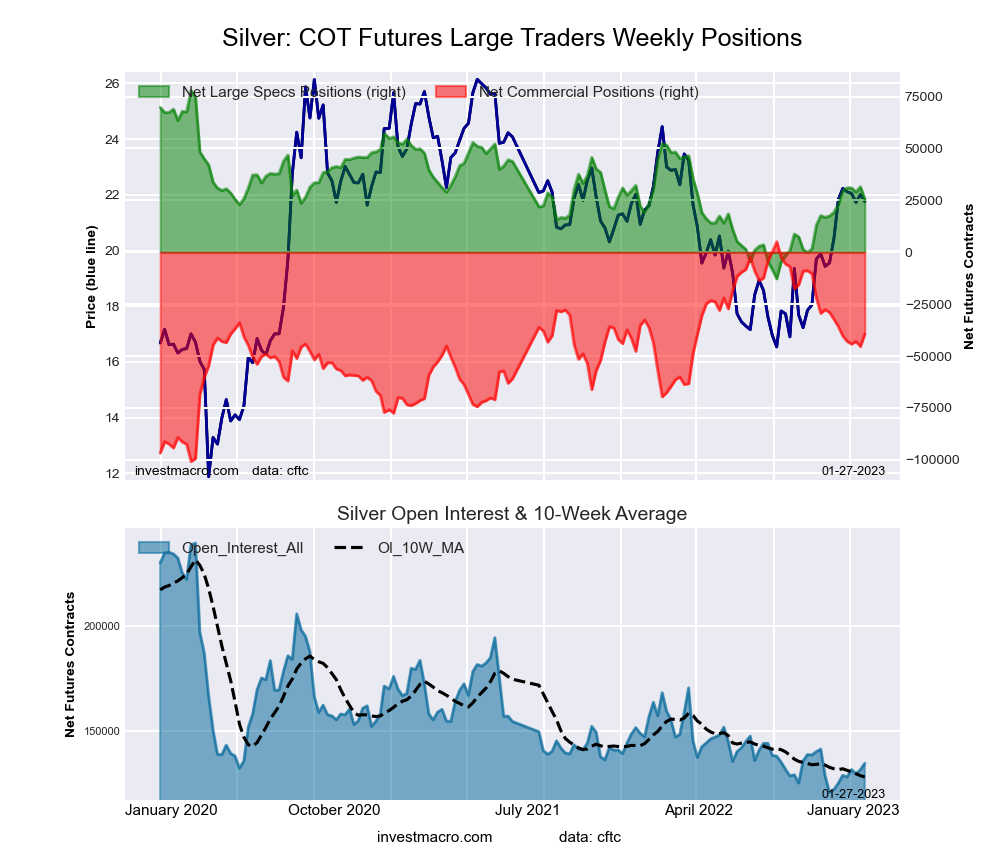
| Silver | 134,922 | 12 | 25,684 | 42 | -39,461 | 58 | 13,777 | 41 |
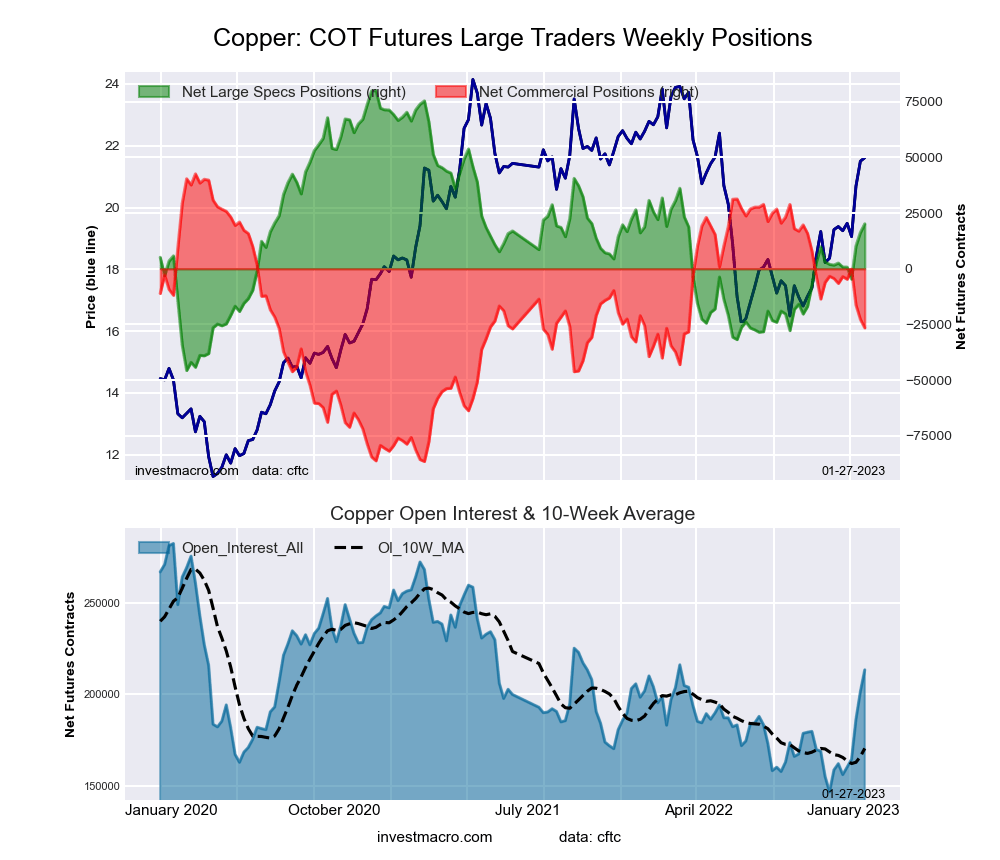
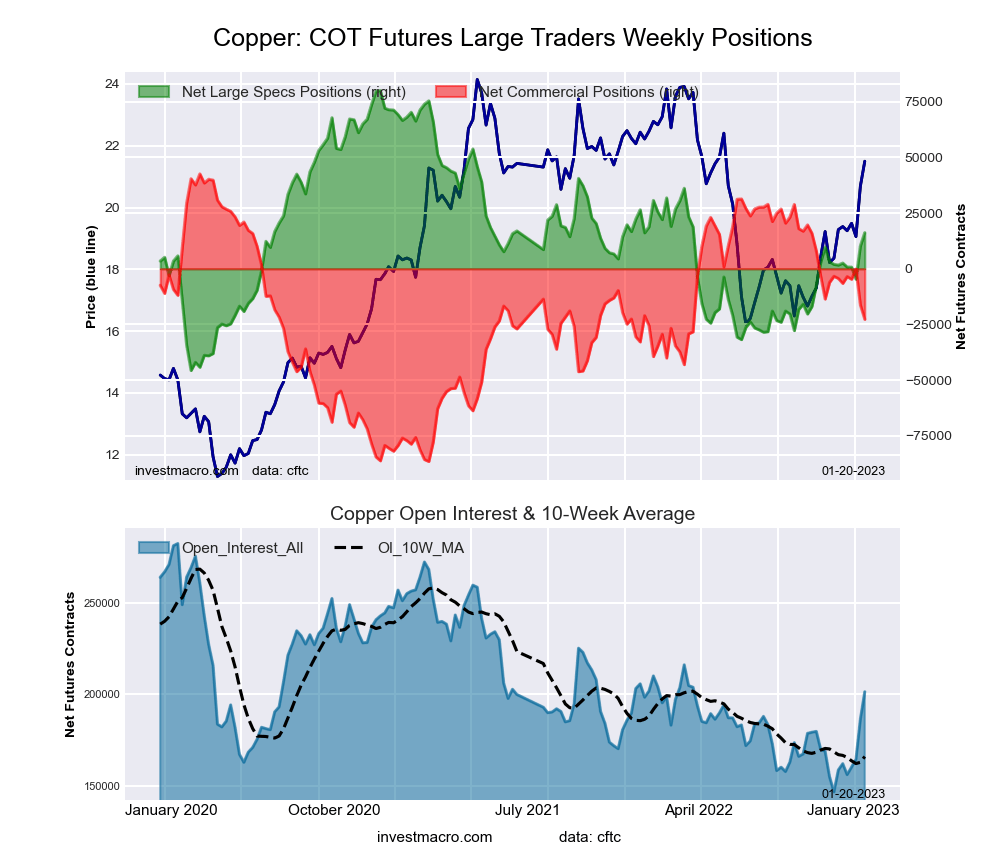
| Copper | 213,398 | 52 | 20,170 | 52 | -26,542 | 46 | 6,372 | 62 |
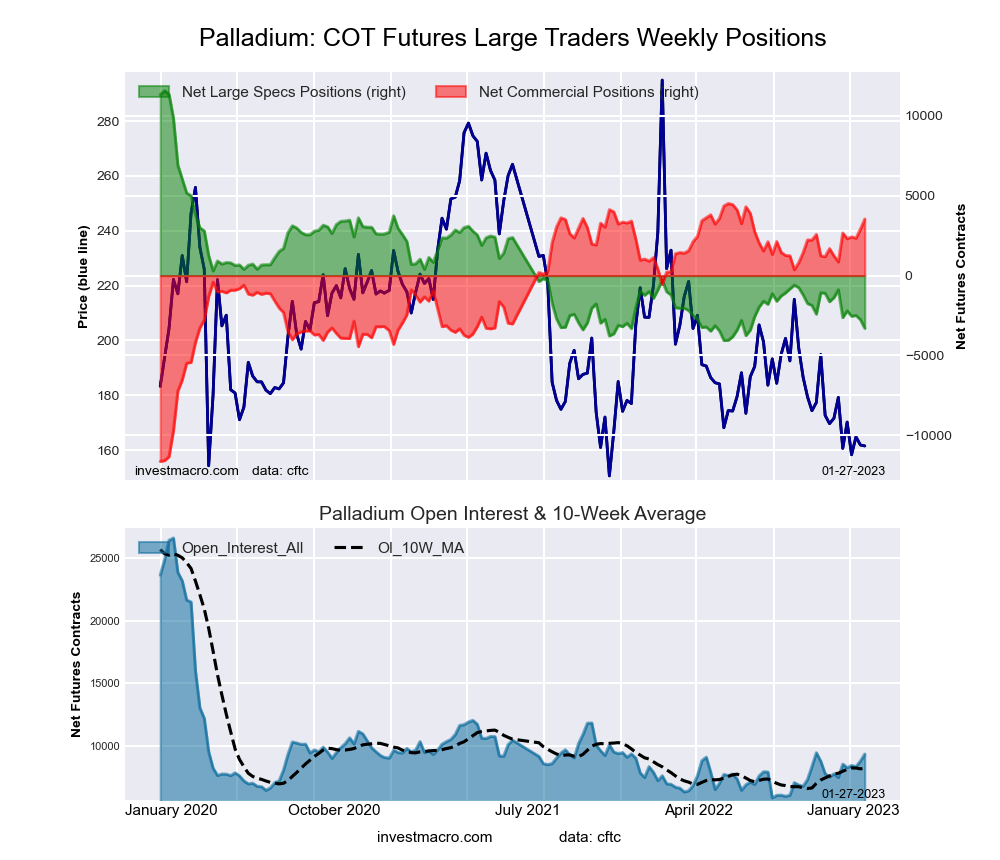
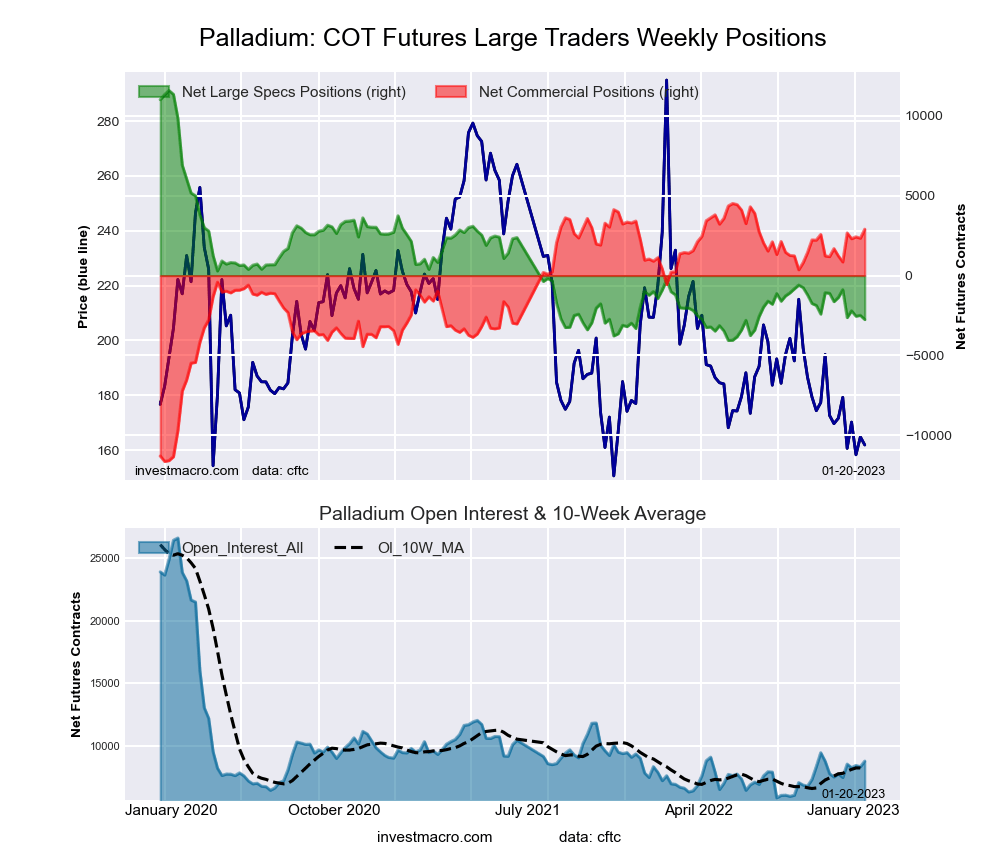
| Palladium | 9,363 | 20 | -3,297 | 8 | 3,534 | 91 | -237 | 27 |
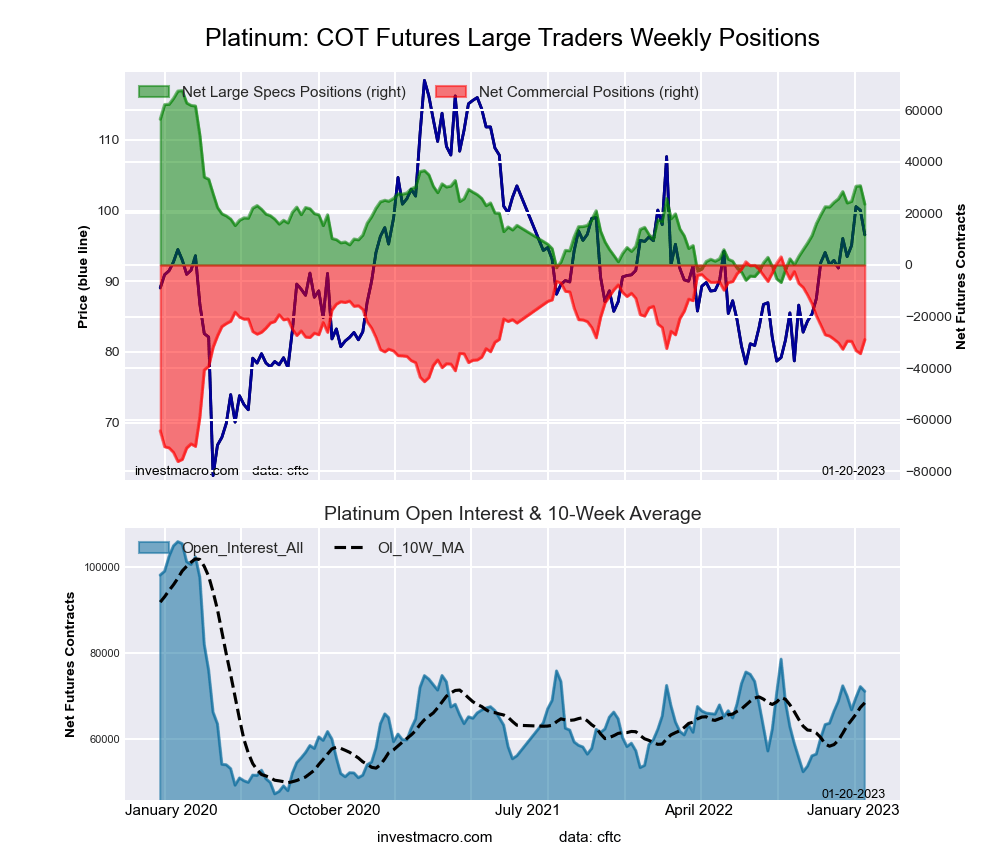
| Platinum | 72,613 | 46 | 20,261 | 39 | -25,819 | 61 | 5,558 | 42 |
| Natural Gas | 1,102,760 | 27 | -170,972 | 24 | 138,482 | 78 | 32,490 | 57 |
| Brent | 153,686 | 14 | -36,800 | 41 | 33,917 | 57 | 2,883 | 48 |
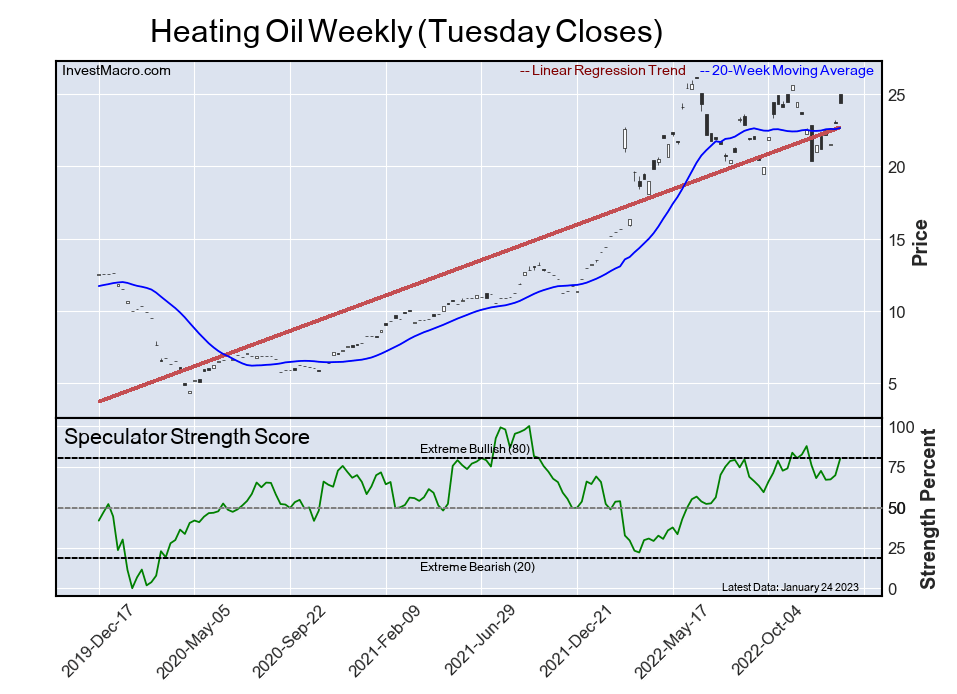
| Heating Oil | 278,159 | 27 | 25,360 | 80 | -48,540 | 20 | 23,180 | 79 |
| Soybeans | 667,416 | 20 | 155,222 | 59 | -117,945 | 52 | -37,277 | 8 |
| Corn | 1,274,410 | 11 | 277,369 | 65 | -205,662 | 43 | -71,707 | 2 |
| Coffee | 231,360 | 35 | -22,728 | 4 | 20,167 | 96 | 2,561 | 35 |
| Sugar | 924,848 | 42 | 185,084 | 58 | -229,339 | 37 | 44,255 | 63 |
| Wheat | 350,331 | 27 | -48,320 | 0 | 50,423 | 100 | -2,103 | 99 |
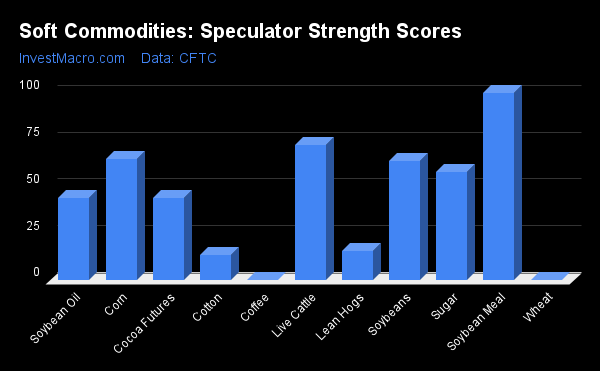
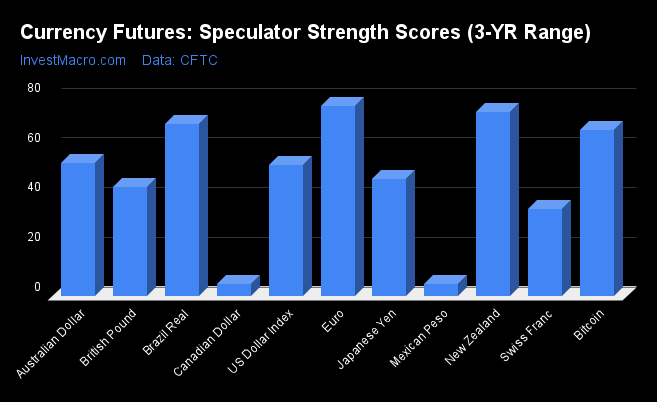
Strength Scores led by Soybean Meal & Corn
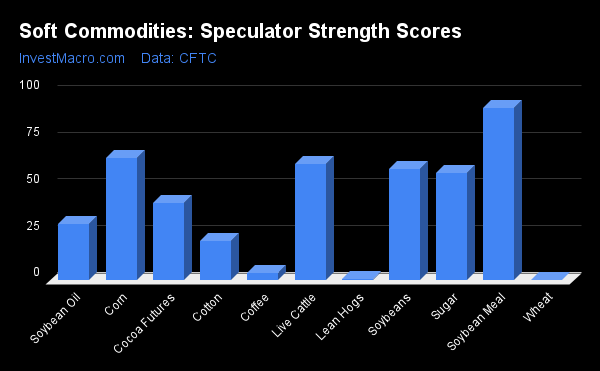
COT Strength Scores (a normalized measure of Speculator positions over a 3-Year range, from 0 to 100 where above 80 is Extreme-Bullish and below 20 is Extreme-Bearish) showed that Soybean Meal (92 percent) and Corn (65 percent) lead the softs markets this week. Live Cattle (62 percent), Soybeans (59 percent) and Sugar (58 percent) come in as the next highest in the weekly strength scores.
On the downside, Lean Hogs (0 percent), Wheat (0 percent) and Coffee (4 percent) come in at the lowest strength levels currently and are in Extreme-Bearish territory (below 20 percent).
Strength Statistics:
Corn (65.5 percent) vs Corn previous week (64.8 percent)
Sugar (57.6 percent) vs Sugar previous week (58.1 percent)
Coffee (4.1 percent) vs Coffee previous week (0.0 percent)
Soybeans (59.4 percent) vs Soybeans previous week (63.9 percent)
Soybean Oil (29.9 percent) vs Soybean Oil previous week (43.8 percent)
Soybean Meal (92.3 percent) vs Soybean Meal previous week (100.0 percent)
Live Cattle (62.4 percent) vs Live Cattle previous week (72.3 percent)
Lean Hogs (0.4 percent) vs Lean Hogs previous week (15.8 percent)
Cotton (20.9 percent) vs Cotton previous week (13.3 percent)
Cocoa (41.5 percent) vs Cocoa previous week (44.2 percent)
Wheat (0.0 percent) vs Wheat previous week (5.7 percent)
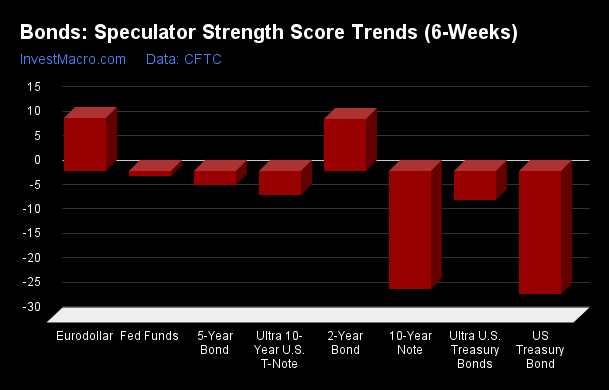
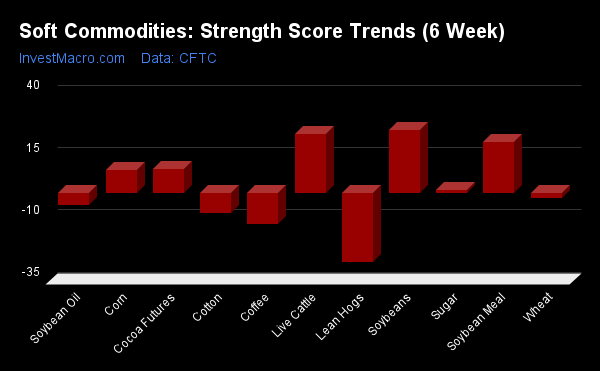
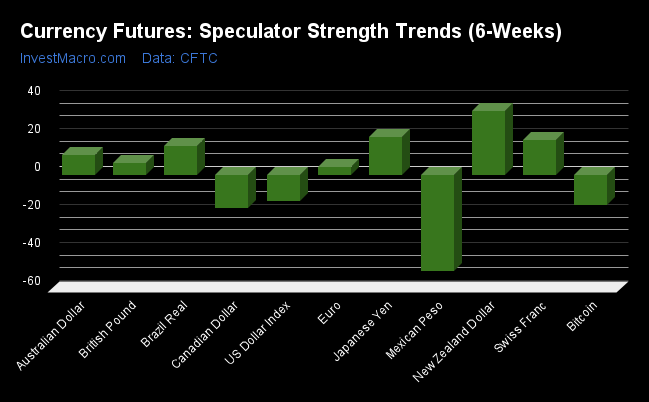
Soybeans & Live Cattle top the 6-Week Strength Trends
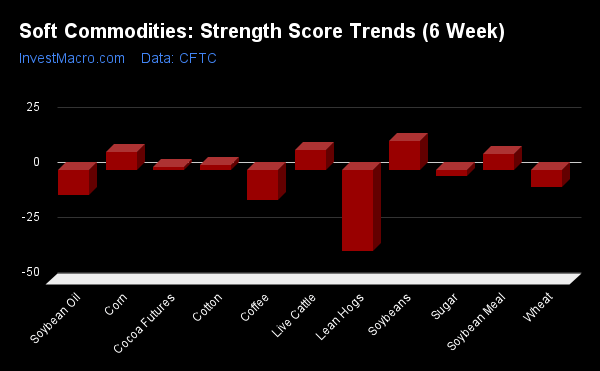
COT Strength Score Trends (or move index, calculates the 6-week changes in strength scores) showed that Soybeans (13 percent) and Live Cattle (9 percent) lead the past six weeks trends for soft commodities. Corn (8 percent), Soybean Meal (8 percent) and Cotton (3 percent) are the next highest positive movers in the latest trends data.
Lean Hogs (-37 percent) leads the downside trend scores currently with Coffee (-14 percent), Soybean Oil (-11 percent) and Wheat (-8 percent) following next with lower trend scores.
Strength Trend Statistics:
Corn (8.3 percent) vs Corn previous week (9.4 percent)
Sugar (-2.7 percent) vs Sugar previous week (1.2 percent)
Coffee (-13.6 percent) vs Coffee previous week (-12.4 percent)
Soybeans (13.5 percent) vs Soybeans previous week (25.4 percent)
Soybean Oil (-11.3 percent) vs Soybean Oil previous week (-4.7 percent)
Soybean Meal (7.5 percent) vs Soybean Meal previous week (20.5 percent)
Live Cattle (9.3 percent) vs Live Cattle previous week (23.7 percent)
Lean Hogs (-36.8 percent) vs Lean Hogs previous week (-27.8 percent)
Cotton (2.6 percent) vs Cotton previous week (-8.2 percent)
Cocoa (1.6 percent) vs Cocoa previous week (9.6 percent)
Wheat (-7.6 percent) vs Wheat previous week (-1.9 percent)
Individual Soft Commodities Markets:
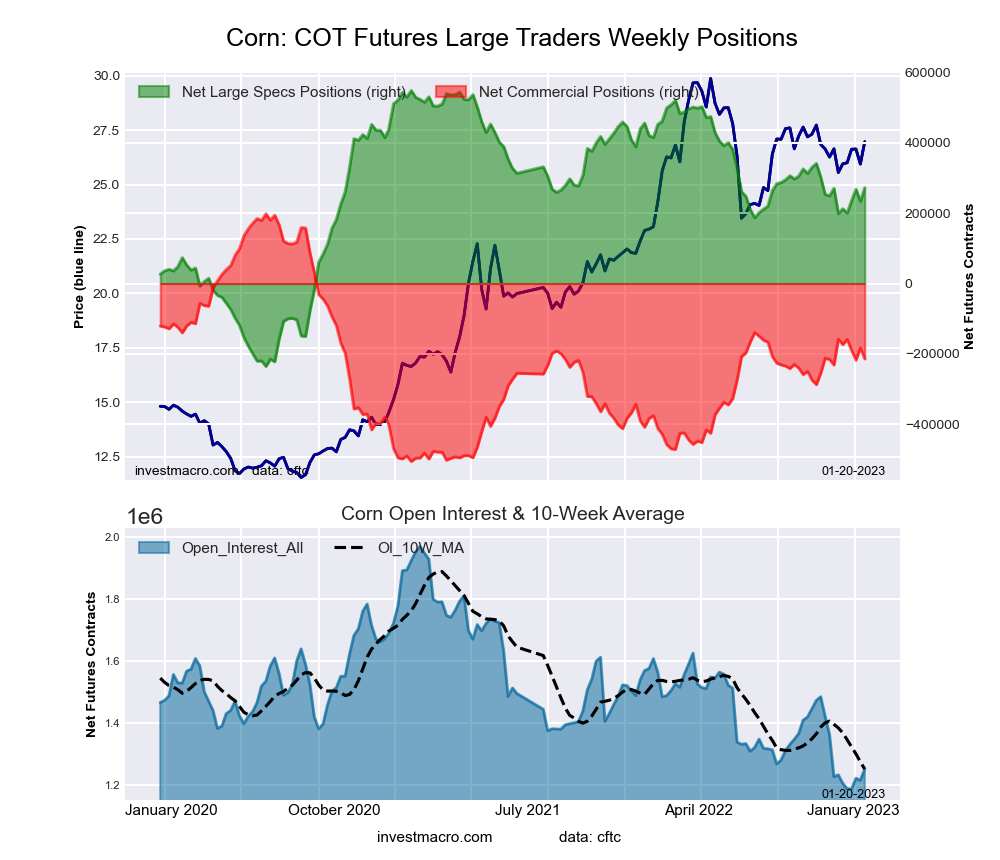
CORN Futures:
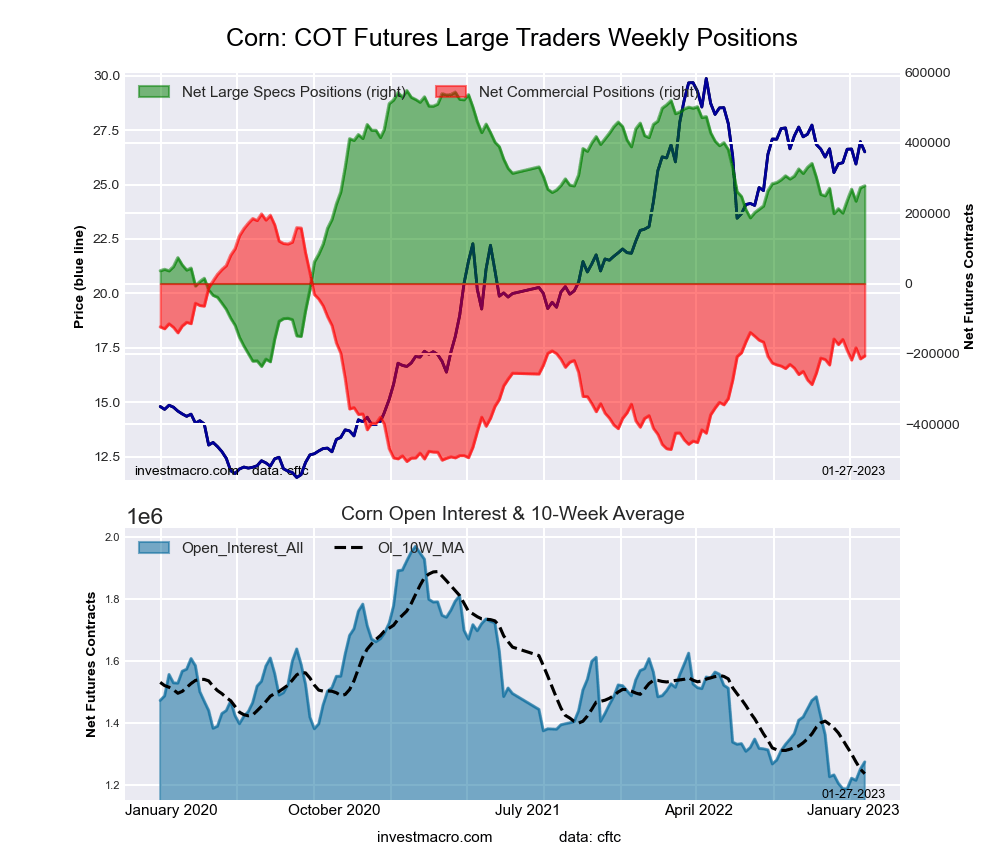 The CORN large speculator standing this week resulted in a net position of 277,369 contracts in the data reported through Tuesday. This was a weekly boost of 5,496 contracts from the previous week which had a total of 271,873 net contracts.
This week’s current strength score (the trader positioning range over the past three years, measured from 0 to 100) shows the speculators are currently Bullish with a score of 65.5 percent. The commercials are Bearish with a score of 42.6 percent and the small traders (not shown in chart) are Bearish-Extreme with a score of 2.1 percent.
| CORN Futures Statistics | SPECULATORS | COMMERCIALS | SMALL TRADERS |
| – Percent of Open Interest Longs: | 30.5 | 43.8 | 9.0 |
| – Percent of Open Interest Shorts: | 8.7 | 60.0 | 14.7 |
| – Net Position: | 277,369 | -205,662 | -71,707 |
| – Gross Longs: | 388,317 | 558,456 | 115,106 |
| – Gross Shorts: | 110,948 | 764,118 | 186,813 |
| – Long to Short Ratio: | 3.5 to 1 | 0.7 to 1 | 0.6 to 1 |
| NET POSITION TREND: | | | |
| – Strength Index Score (3 Year Range Pct): | 65.5 | 42.6 | 2.1 |
| – Strength Index Reading (3 Year Range): | Bullish | Bearish | Bearish-Extreme |
| NET POSITION MOVEMENT INDEX: | | | |
| – 6-Week Change in Strength Index: | 8.3 | -4.6 | -22.3 |
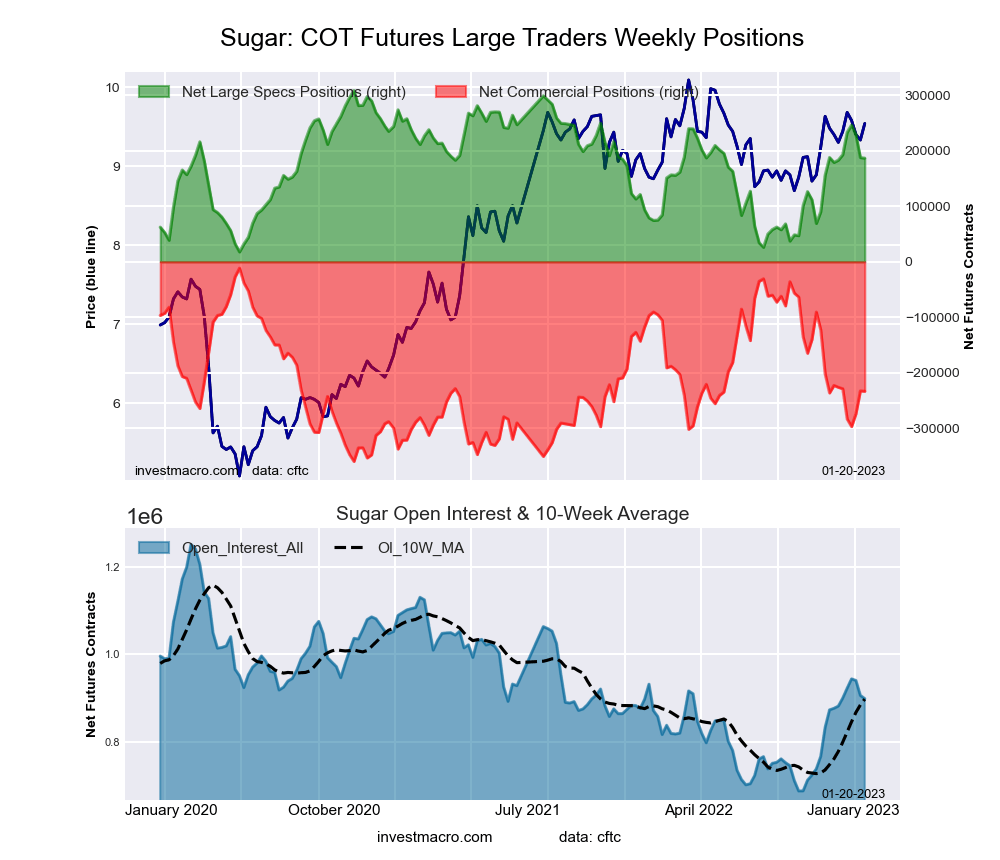
SUGAR Futures:
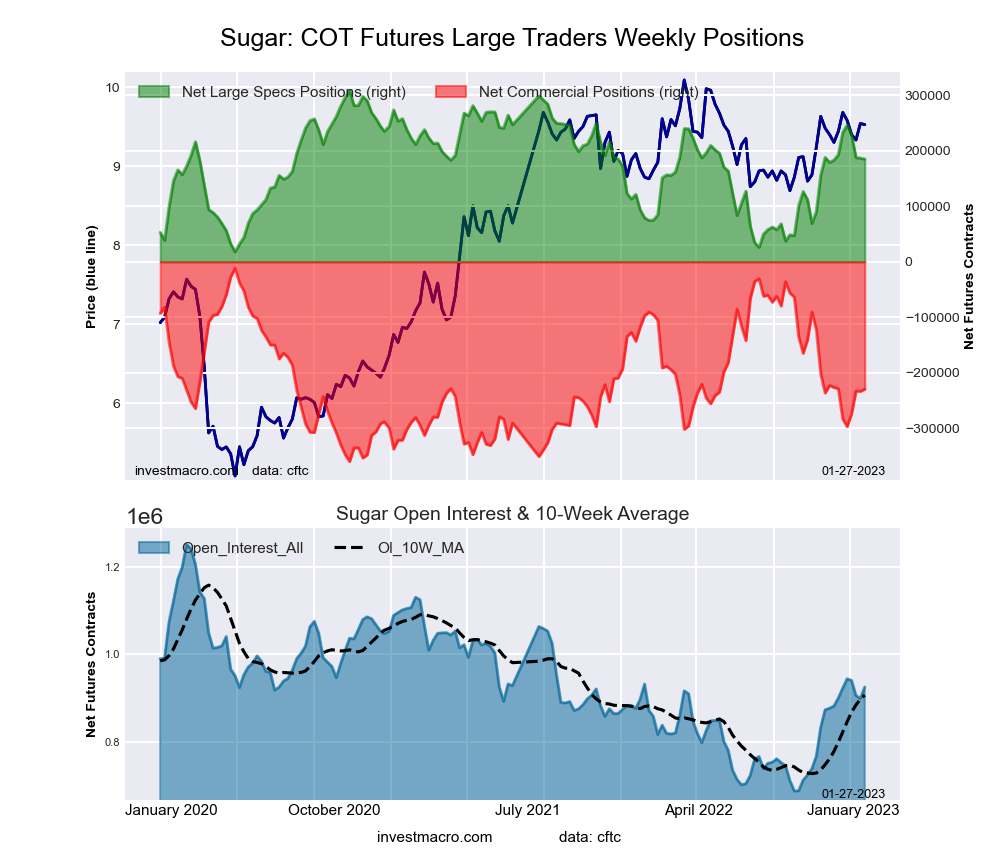 The SUGAR large speculator standing this week resulted in a net position of 185,084 contracts in the data reported through Tuesday. This was a weekly lowering of -1,614 contracts from the previous week which had a total of 186,698 net contracts.
This week’s current strength score (the trader positioning range over the past three years, measured from 0 to 100) shows the speculators are currently Bullish with a score of 57.6 percent. The commercials are Bearish with a score of 37.4 percent and the small traders (not shown in chart) are Bullish with a score of 62.6 percent.
| SUGAR Futures Statistics | SPECULATORS | COMMERCIALS | SMALL TRADERS |
| – Percent of Open Interest Longs: | 29.2 | 43.8 | 9.8 |
| – Percent of Open Interest Shorts: | 9.2 | 68.6 | 5.1 |
| – Net Position: | 185,084 | -229,339 | 44,255 |
| – Gross Longs: | 270,150 | 404,948 | 91,086 |
| – Gross Shorts: | 85,066 | 634,287 | 46,831 |
| – Long to Short Ratio: | 3.2 to 1 | 0.6 to 1 | 1.9 to 1 |
| NET POSITION TREND: | | | |
| – Strength Index Score (3 Year Range Pct): | 57.6 | 37.4 | 62.6 |
| – Strength Index Reading (3 Year Range): | Bullish | Bearish | Bullish |
| NET POSITION MOVEMENT INDEX: | | | |
| – 6-Week Change in Strength Index: | -2.7 | -0.2 | 10.8 |
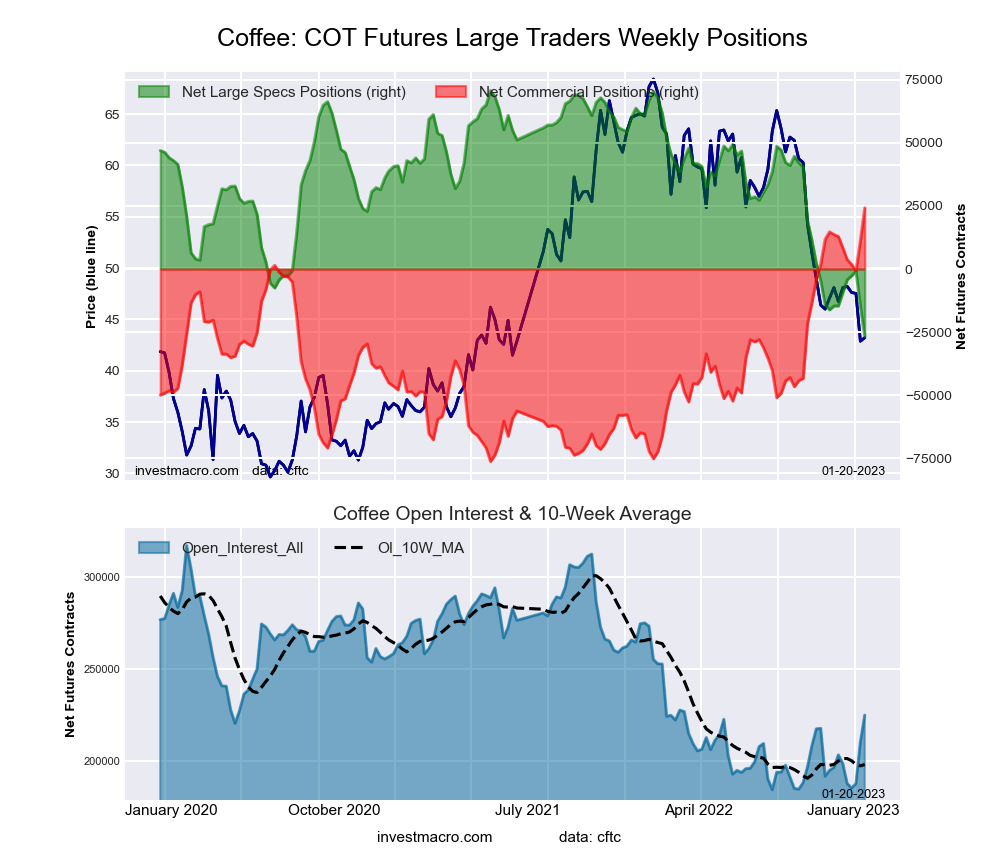
COFFEE Futures:
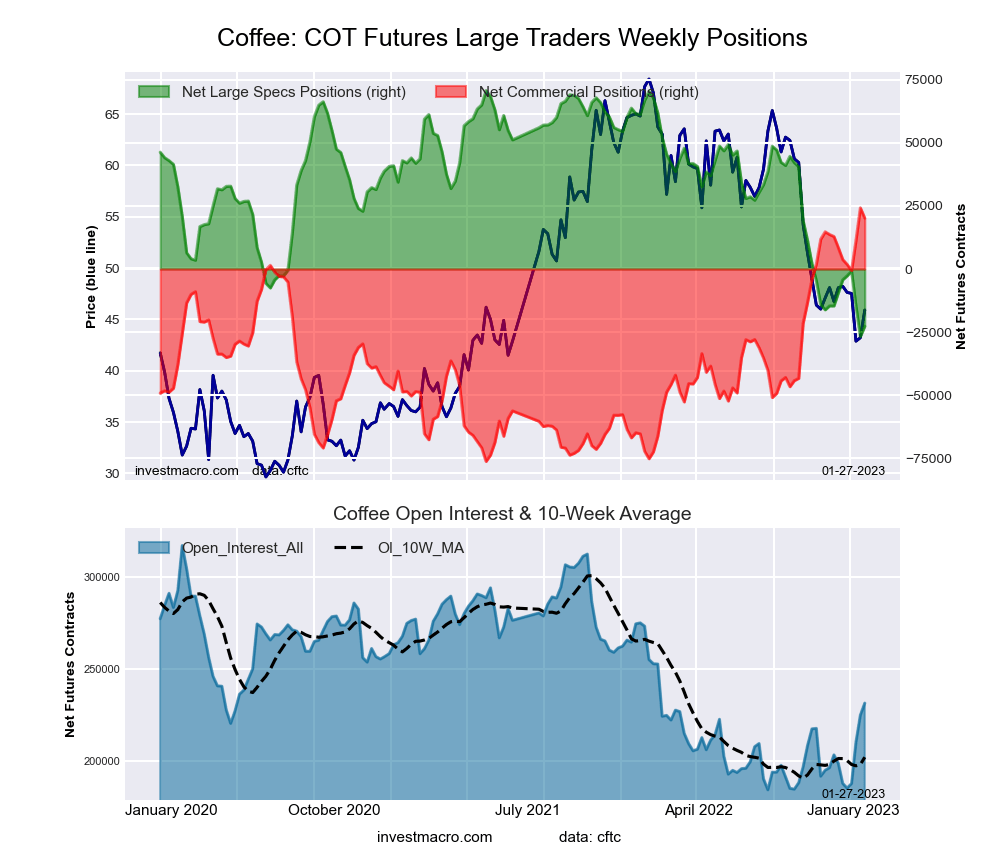 The COFFEE large speculator standing this week resulted in a net position of -22,728 contracts in the data reported through Tuesday. This was a weekly gain of 4,017 contracts from the previous week which had a total of -26,745 net contracts.
This week’s current strength score (the trader positioning range over the past three years, measured from 0 to 100) shows the speculators are currently Bearish-Extreme with a score of 4.1 percent. The commercials are Bullish-Extreme with a score of 95.9 percent and the small traders (not shown in chart) are Bearish with a score of 35.1 percent.
| COFFEE Futures Statistics | SPECULATORS | COMMERCIALS | SMALL TRADERS |
| – Percent of Open Interest Longs: | 19.6 | 52.9 | 4.6 |
| – Percent of Open Interest Shorts: | 29.4 | 44.2 | 3.5 |
| – Net Position: | -22,728 | 20,167 | 2,561 |
| – Gross Longs: | 45,404 | 122,400 | 10,598 |
| – Gross Shorts: | 68,132 | 102,233 | 8,037 |
| – Long to Short Ratio: | 0.7 to 1 | 1.2 to 1 | 1.3 to 1 |
| NET POSITION TREND: | | | |
| – Strength Index Score (3 Year Range Pct): | 4.1 | 95.9 | 35.1 |
| – Strength Index Reading (3 Year Range): | Bearish-Extreme | Bullish-Extreme | Bearish |
| NET POSITION MOVEMENT INDEX: | | | |
| – 6-Week Change in Strength Index: | -13.6 | 11.6 | 21.5 |
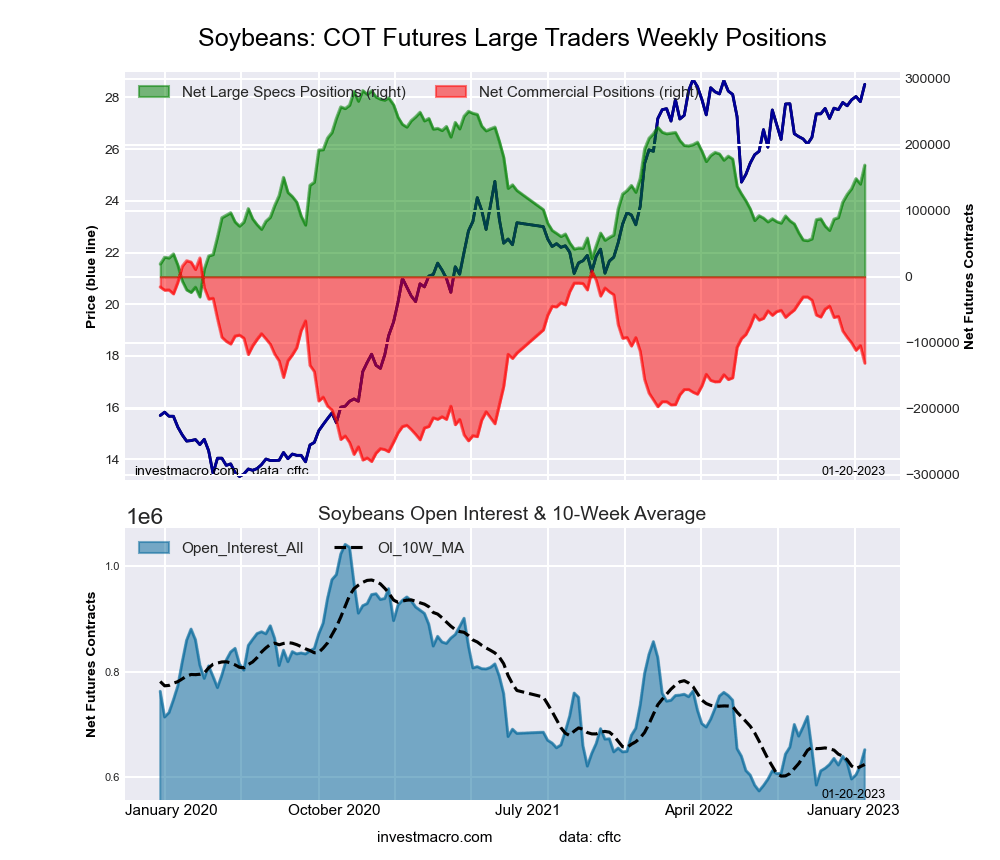
SOYBEANS Futures:
 The SOYBEANS large speculator standing this week resulted in a net position of 155,222 contracts in the data reported through Tuesday. This was a weekly decline of -13,843 contracts from the previous week which had a total of 169,065 net contracts.
This week’s current strength score (the trader positioning range over the past three years, measured from 0 to 100) shows the speculators are currently Bullish with a score of 59.4 percent. The commercials are Bullish with a score of 52.5 percent and the small traders (not shown in chart) are Bearish-Extreme with a score of 8.0 percent.
| SOYBEANS Futures Statistics | SPECULATORS | COMMERCIALS | SMALL TRADERS |
| – Percent of Open Interest Longs: | 30.9 | 46.6 | 6.9 |
| – Percent of Open Interest Shorts: | 7.7 | 64.3 | 12.5 |
| – Net Position: | 155,222 | -117,945 | -37,277 |
| – Gross Longs: | 206,329 | 311,307 | 46,219 |
| – Gross Shorts: | 51,107 | 429,252 | 83,496 |
| – Long to Short Ratio: | 4.0 to 1 | 0.7 to 1 | 0.6 to 1 |
| NET POSITION TREND: | | | |
| – Strength Index Score (3 Year Range Pct): | 59.4 | 52.5 | 8.0 |
| – Strength Index Reading (3 Year Range): | Bullish | Bullish | Bearish-Extreme |
| NET POSITION MOVEMENT INDEX: | | | |
| – 6-Week Change in Strength Index: | 13.5 | -11.7 | -10.6 |
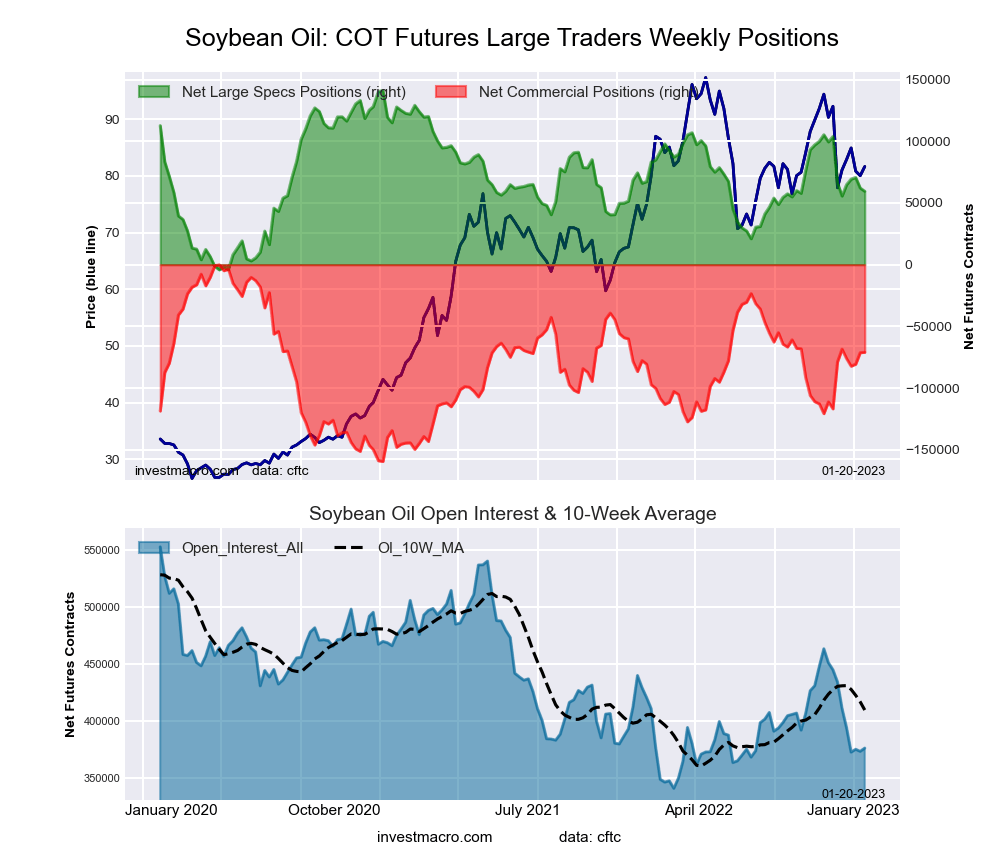
SOYBEAN OIL Futures:
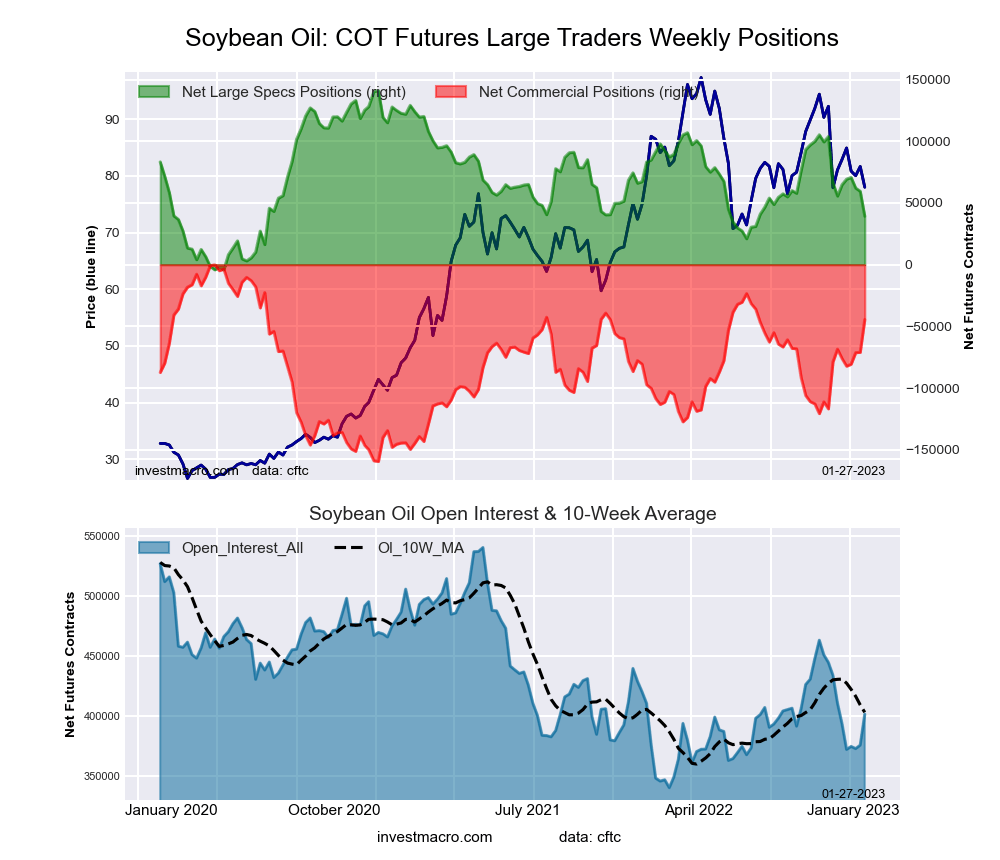 The SOYBEAN OIL large speculator standing this week resulted in a net position of 39,250 contracts in the data reported through Tuesday. This was a weekly lowering of -20,245 contracts from the previous week which had a total of 59,495 net contracts.
This week’s current strength score (the trader positioning range over the past three years, measured from 0 to 100) shows the speculators are currently Bearish with a score of 29.9 percent. The commercials are Bullish with a score of 72.2 percent and the small traders (not shown in chart) are Bearish with a score of 33.1 percent.
| SOYBEAN OIL Futures Statistics | SPECULATORS | COMMERCIALS | SMALL TRADERS |
| – Percent of Open Interest Longs: | 20.1 | 50.6 | 8.7 |
| – Percent of Open Interest Shorts: | 10.3 | 61.6 | 7.4 |
| – Net Position: | 39,250 | -44,514 | 5,264 |
| – Gross Longs: | 80,599 | 203,133 | 34,963 |
| – Gross Shorts: | 41,349 | 247,647 | 29,699 |
| – Long to Short Ratio: | 1.9 to 1 | 0.8 to 1 | 1.2 to 1 |
| NET POSITION TREND: | | | |
| – Strength Index Score (3 Year Range Pct): | 29.9 | 72.2 | 33.1 |
| – Strength Index Reading (3 Year Range): | Bearish | Bullish | Bearish |
| NET POSITION MOVEMENT INDEX: | | | |
| – 6-Week Change in Strength Index: | -11.3 | 15.1 | -28.4 |
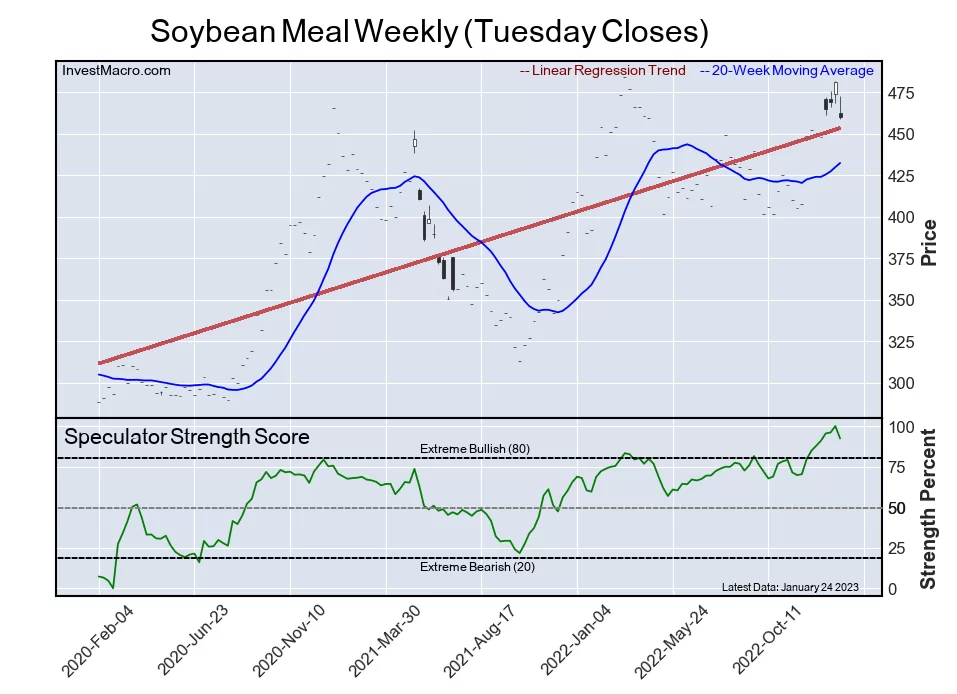
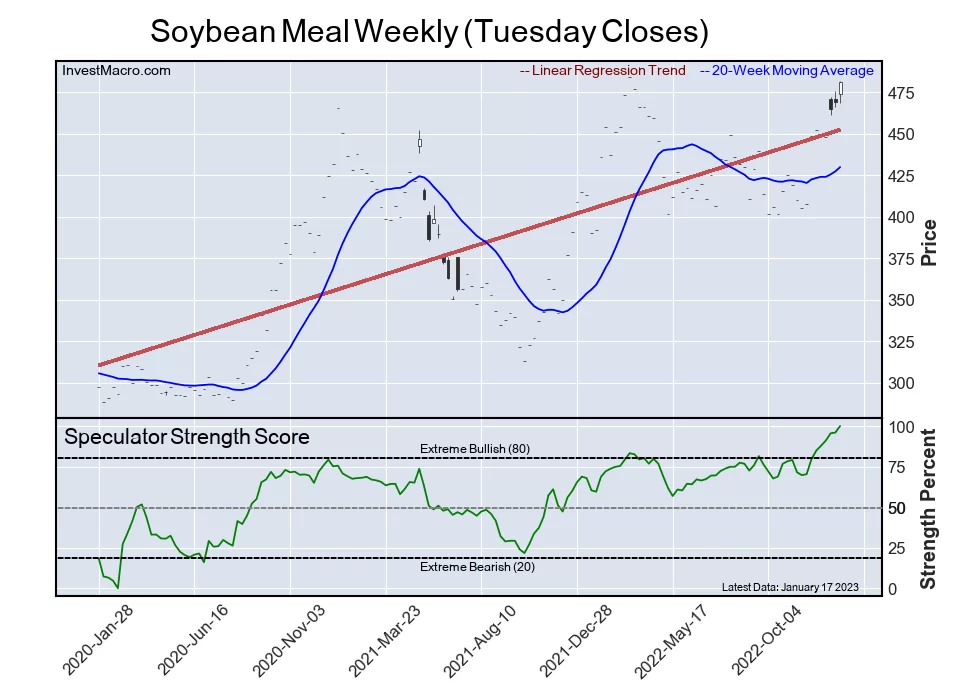
SOYBEAN MEAL Futures:
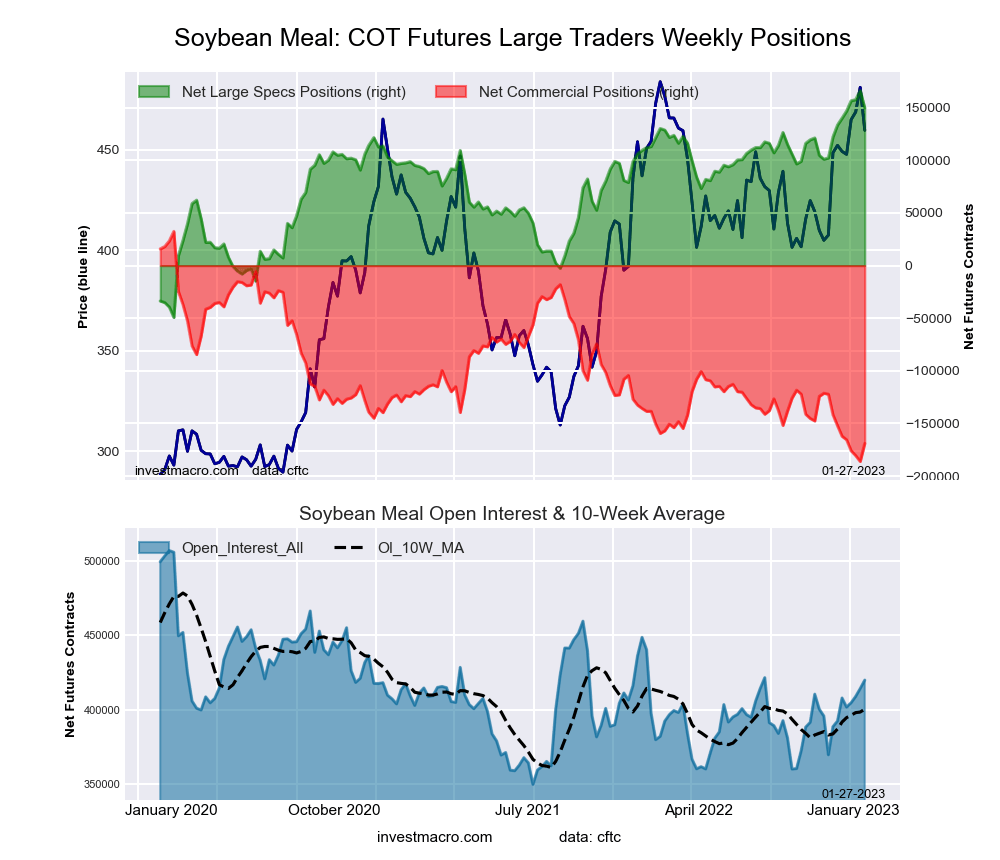 The SOYBEAN MEAL large speculator standing this week resulted in a net position of 149,785 contracts in the data reported through Tuesday. This was a weekly decline of -16,565 contracts from the previous week which had a total of 166,350 net contracts.
This week’s current strength score (the trader positioning range over the past three years, measured from 0 to 100) shows the speculators are currently Bullish-Extreme with a score of 92.3 percent. The commercials are Bearish-Extreme with a score of 7.8 percent and the small traders (not shown in chart) are Bearish with a score of 32.6 percent.
| SOYBEAN MEAL Futures Statistics | SPECULATORS | COMMERCIALS | SMALL TRADERS |
| – Percent of Open Interest Longs: | 40.1 | 32.9 | 11.7 |
| – Percent of Open Interest Shorts: | 4.5 | 73.2 | 7.1 |
| – Net Position: | 149,785 | -169,008 | 19,223 |
| – Gross Longs: | 168,470 | 138,088 | 49,137 |
| – Gross Shorts: | 18,685 | 307,096 | 29,914 |
| – Long to Short Ratio: | 9.0 to 1 | 0.4 to 1 | 1.6 to 1 |
| NET POSITION TREND: | | | |
| – Strength Index Score (3 Year Range Pct): | 92.3 | 7.8 | 32.6 |
| – Strength Index Reading (3 Year Range): | Bullish-Extreme | Bearish-Extreme | Bearish |
| NET POSITION MOVEMENT INDEX: | | | |
| – 6-Week Change in Strength Index: | 7.5 | -7.7 | 3.2 |
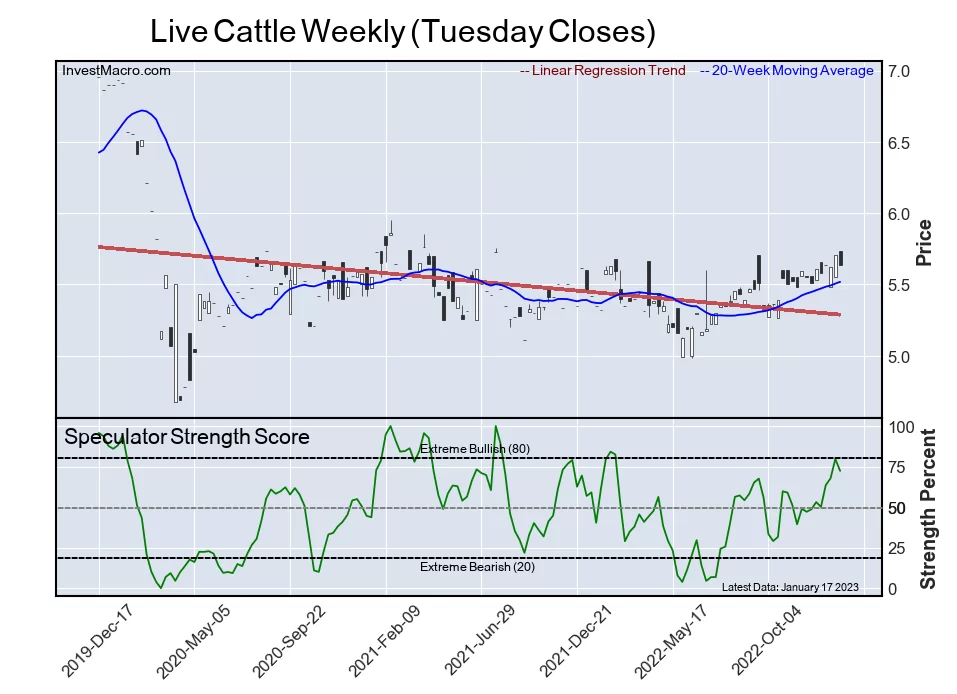
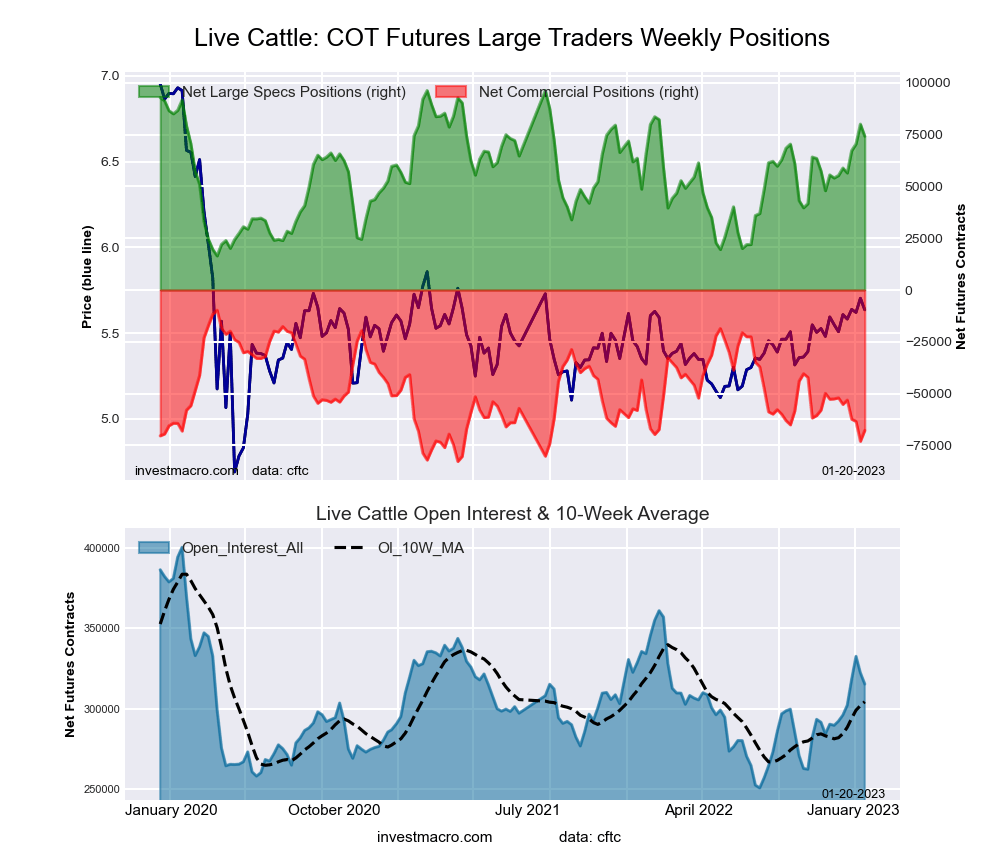
LIVE CATTLE Futures:
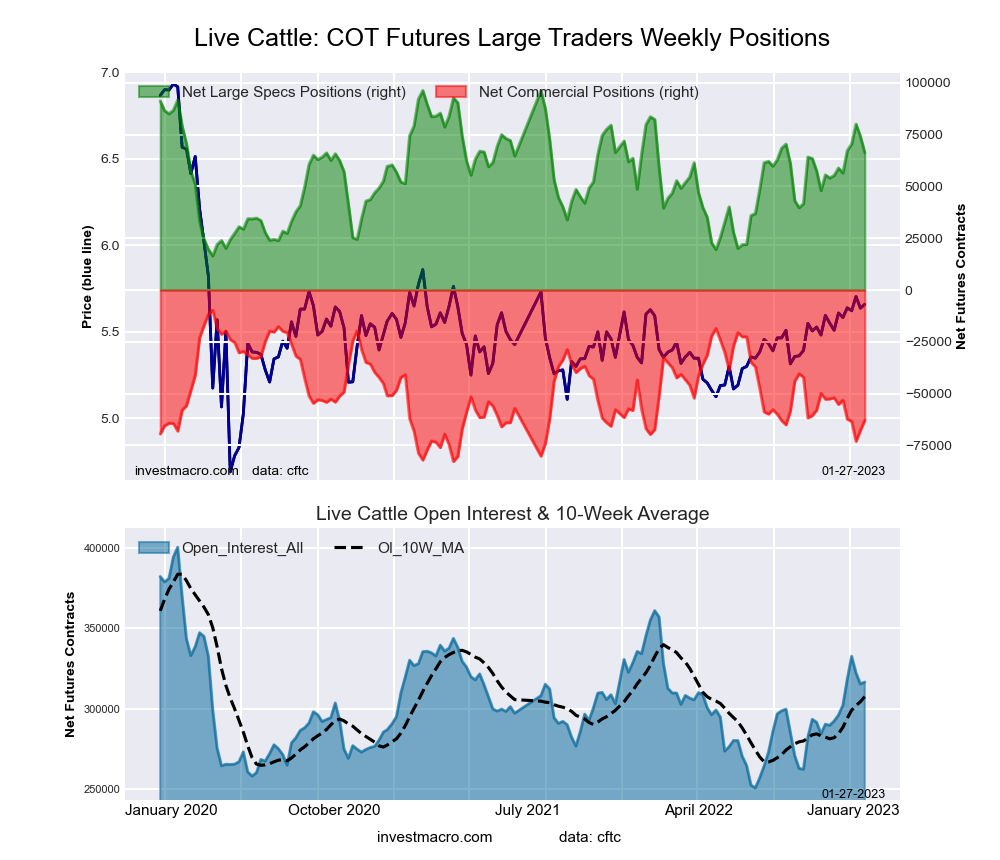 The LIVE CATTLE large speculator standing this week resulted in a net position of 66,228 contracts in the data reported through Tuesday. This was a weekly decrease of -7,915 contracts from the previous week which had a total of 74,143 net contracts.
This week’s current strength score (the trader positioning range over the past three years, measured from 0 to 100) shows the speculators are currently Bullish with a score of 62.4 percent. The commercials are Bearish with a score of 27.2 percent and the small traders (not shown in chart) are Bullish with a score of 70.4 percent.
| LIVE CATTLE Futures Statistics | SPECULATORS | COMMERCIALS | SMALL TRADERS |
| – Percent of Open Interest Longs: | 37.0 | 30.6 | 11.2 |
| – Percent of Open Interest Shorts: | 16.1 | 50.4 | 12.2 |
| – Net Position: | 66,228 | -62,823 | -3,405 |
| – Gross Longs: | 117,249 | 96,720 | 35,368 |
| – Gross Shorts: | 51,021 | 159,543 | 38,773 |
| – Long to Short Ratio: | 2.3 to 1 | 0.6 to 1 | 0.9 to 1 |
| NET POSITION TREND: | | | |
| – Strength Index Score (3 Year Range Pct): | 62.4 | 27.2 | 70.4 |
| – Strength Index Reading (3 Year Range): | Bullish | Bearish | Bullish |
| NET POSITION MOVEMENT INDEX: | | | |
| – 6-Week Change in Strength Index: | 9.3 | -10.5 | 1.4 |
LEAN HOGS Futures:
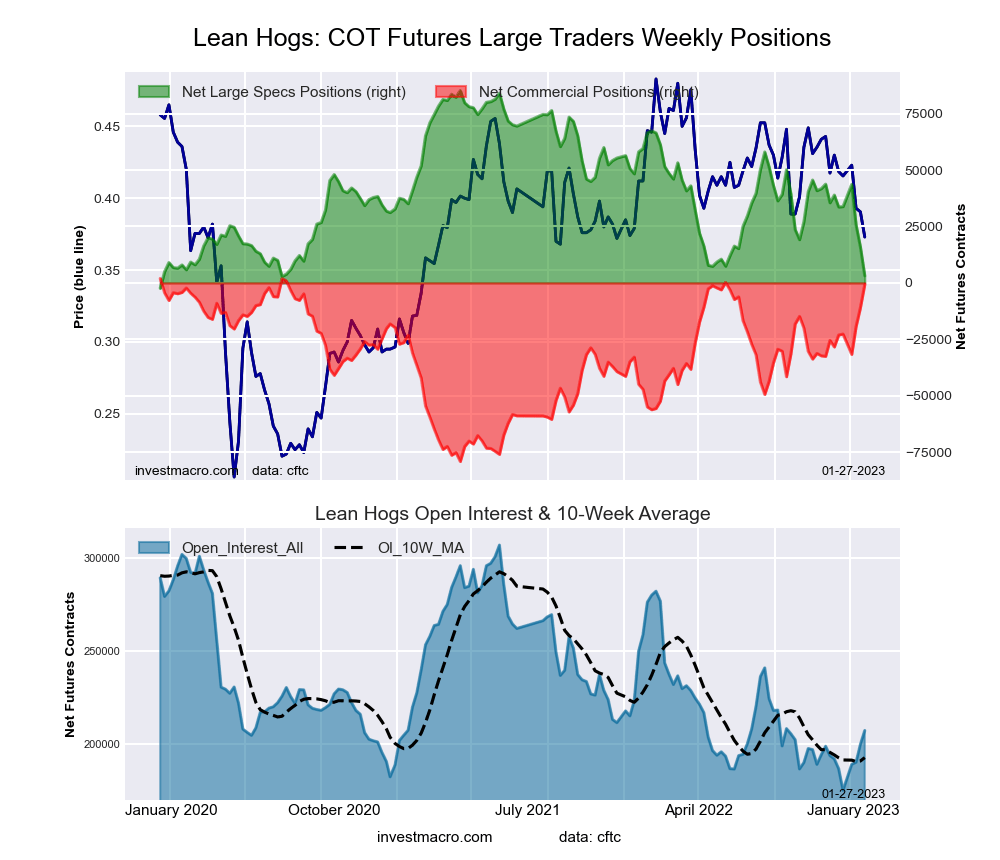 The LEAN HOGS large speculator standing this week resulted in a net position of 3,166 contracts in the data reported through Tuesday. This was a weekly fall of -12,741 contracts from the previous week which had a total of 15,907 net contracts.
This week’s current strength score (the trader positioning range over the past three years, measured from 0 to 100) shows the speculators are currently Bearish-Extreme with a score of 0.4 percent. The commercials are Bullish-Extreme with a score of 96.9 percent and the small traders (not shown in chart) are Bullish-Extreme with a score of 95.4 percent.
| LEAN HOGS Futures Statistics | SPECULATORS | COMMERCIALS | SMALL TRADERS |
| – Percent of Open Interest Longs: | 32.3 | 36.7 | 11.3 |
| – Percent of Open Interest Shorts: | 30.8 | 37.0 | 12.5 |
| – Net Position: | 3,166 | -682 | -2,484 |
| – Gross Longs: | 66,938 | 75,927 | 23,357 |
| – Gross Shorts: | 63,772 | 76,609 | 25,841 |
| – Long to Short Ratio: | 1.0 to 1 | 1.0 to 1 | 0.9 to 1 |
| NET POSITION TREND: | | | |
| – Strength Index Score (3 Year Range Pct): | 0.4 | 96.9 | 95.4 |
| – Strength Index Reading (3 Year Range): | Bearish-Extreme | Bullish-Extreme | Bullish-Extreme |
| NET POSITION MOVEMENT INDEX: | | | |
| – 6-Week Change in Strength Index: | -36.8 | 27.7 | 47.8 |
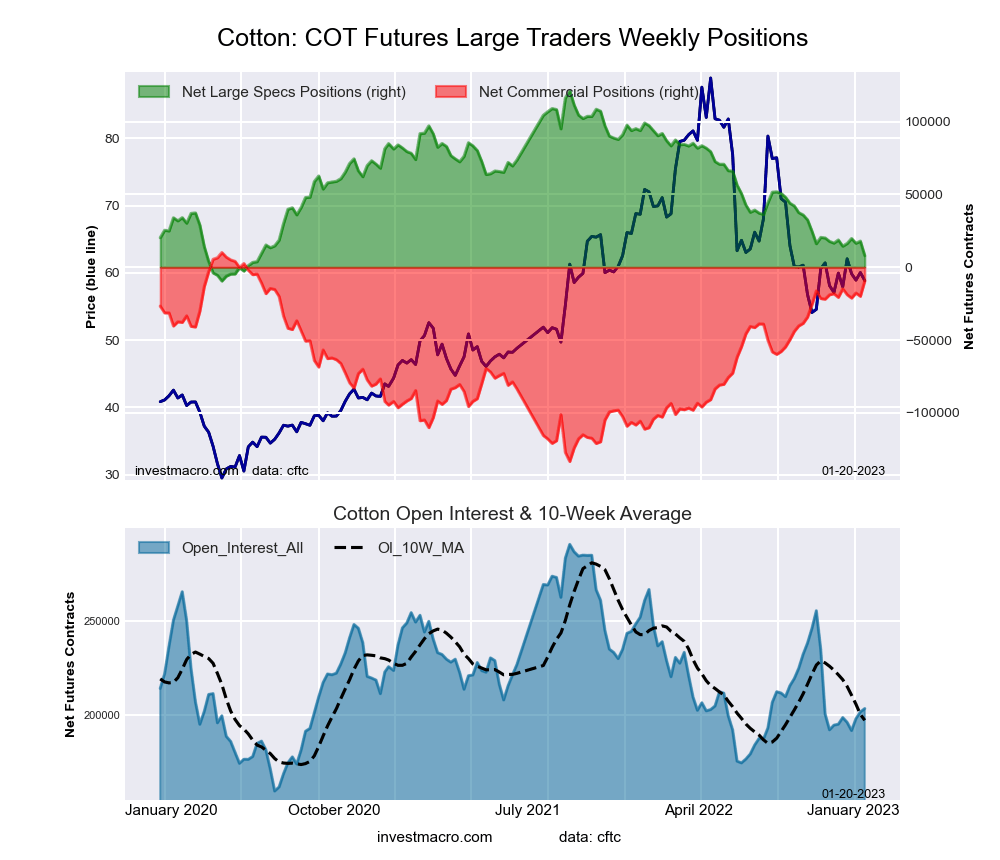
COTTON Futures:
 The COTTON large speculator standing this week resulted in a net position of 17,833 contracts in the data reported through Tuesday. This was a weekly increase of 9,880 contracts from the previous week which had a total of 7,953 net contracts.
This week’s current strength score (the trader positioning range over the past three years, measured from 0 to 100) shows the speculators are currently Bearish with a score of 20.9 percent. The commercials are Bullish with a score of 79.2 percent and the small traders (not shown in chart) are Bearish with a score of 22.2 percent.
| COTTON Futures Statistics | SPECULATORS | COMMERCIALS | SMALL TRADERS |
| – Percent of Open Interest Longs: | 29.6 | 48.5 | 6.2 |
| – Percent of Open Interest Shorts: | 21.0 | 58.0 | 5.3 |
| – Net Position: | 17,833 | -19,679 | 1,846 |
| – Gross Longs: | 61,599 | 100,981 | 12,918 |
| – Gross Shorts: | 43,766 | 120,660 | 11,072 |
| – Long to Short Ratio: | 1.4 to 1 | 0.8 to 1 | 1.2 to 1 |
| NET POSITION TREND: | | | |
| – Strength Index Score (3 Year Range Pct): | 20.9 | 79.2 | 22.2 |
| – Strength Index Reading (3 Year Range): | Bearish | Bullish | Bearish |
| NET POSITION MOVEMENT INDEX: | | | |
| – 6-Week Change in Strength Index: | 2.6 | -3.4 | 9.5 |
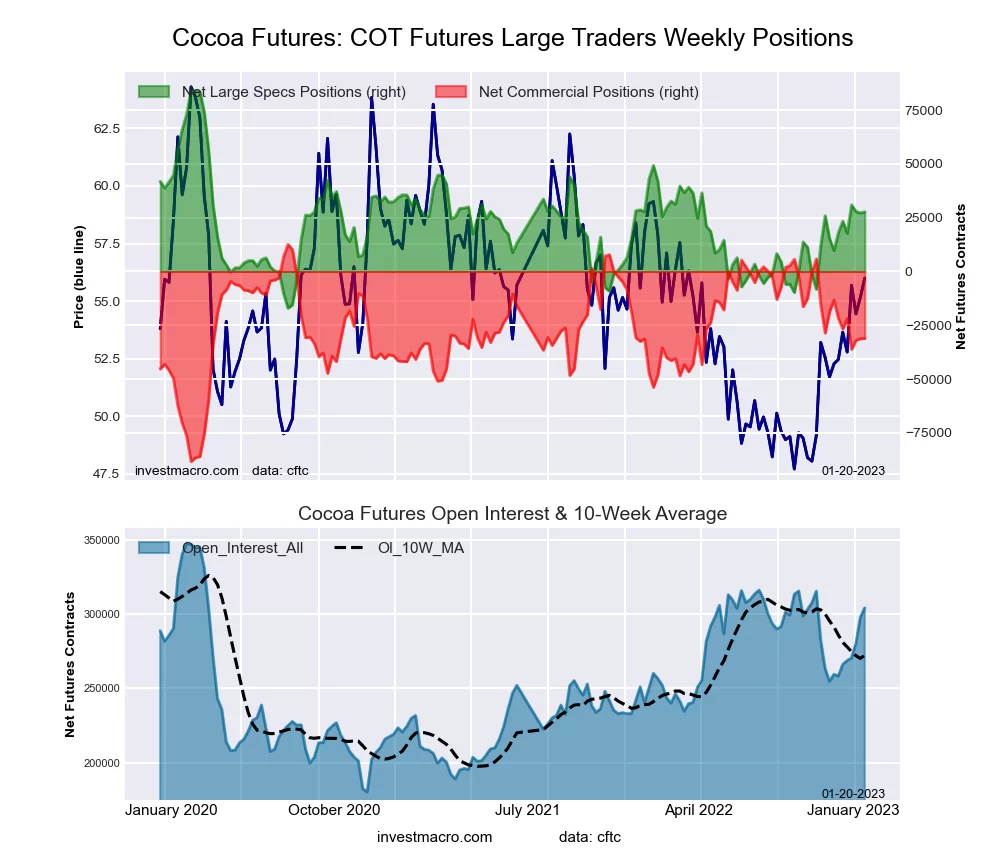
COCOA Futures:
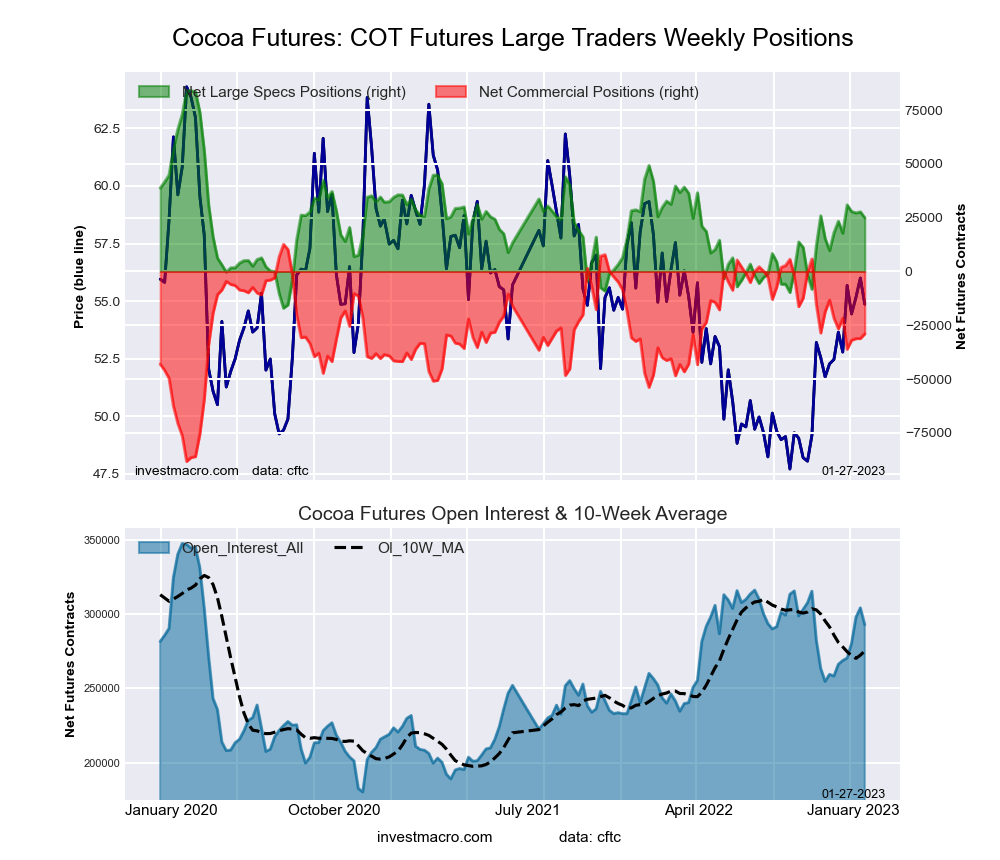 The COCOA large speculator standing this week resulted in a net position of 24,941 contracts in the data reported through Tuesday. This was a weekly decrease of -2,757 contracts from the previous week which had a total of 27,698 net contracts.
This week’s current strength score (the trader positioning range over the past three years, measured from 0 to 100) shows the speculators are currently Bearish with a score of 41.5 percent. The commercials are Bullish with a score of 58.8 percent and the small traders (not shown in chart) are Bearish with a score of 36.9 percent.
| COCOA Futures Statistics | SPECULATORS | COMMERCIALS | SMALL TRADERS |
| – Percent of Open Interest Longs: | 31.1 | 47.3 | 4.3 |
| – Percent of Open Interest Shorts: | 22.6 | 57.2 | 2.9 |
| – Net Position: | 24,941 | -28,978 | 4,037 |
| – Gross Longs: | 90,986 | 138,394 | 12,460 |
| – Gross Shorts: | 66,045 | 167,372 | 8,423 |
| – Long to Short Ratio: | 1.4 to 1 | 0.8 to 1 | 1.5 to 1 |
| NET POSITION TREND: | | | |
| – Strength Index Score (3 Year Range Pct): | 41.5 | 58.8 | 36.9 |
| – Strength Index Reading (3 Year Range): | Bearish | Bullish | Bearish |
| NET POSITION MOVEMENT INDEX: | | | |
| – 6-Week Change in Strength Index: | 1.6 | -2.3 | 6.9 |
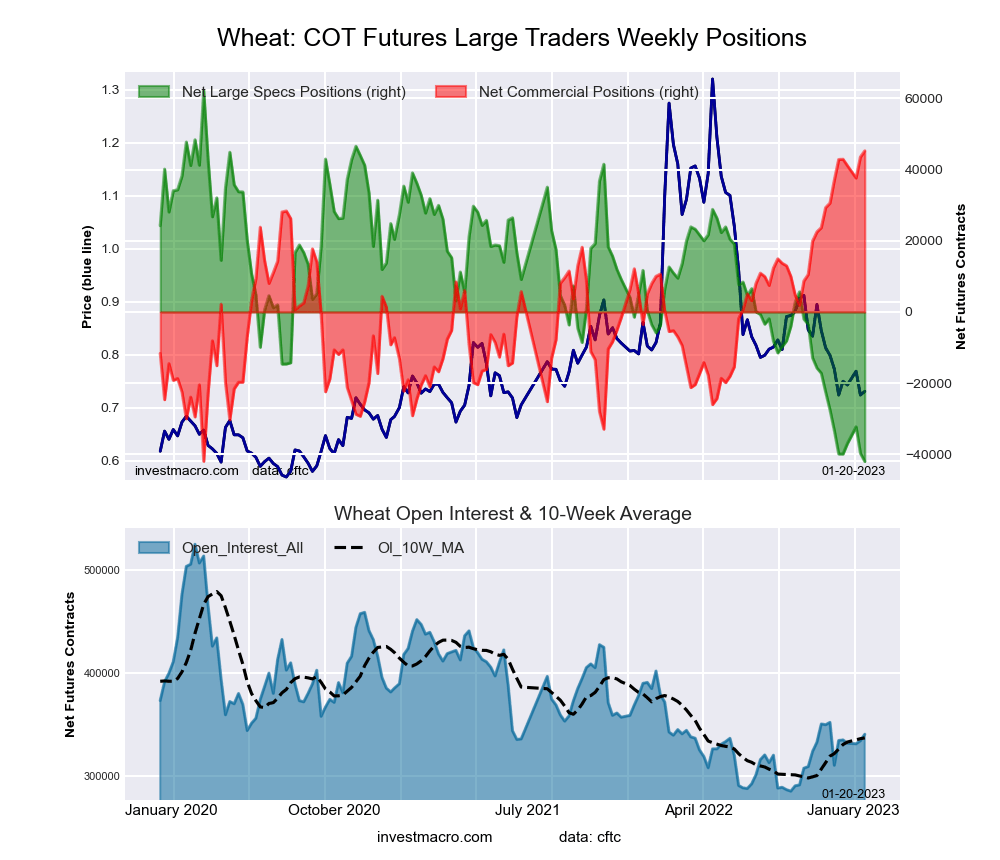
WHEAT Futures:
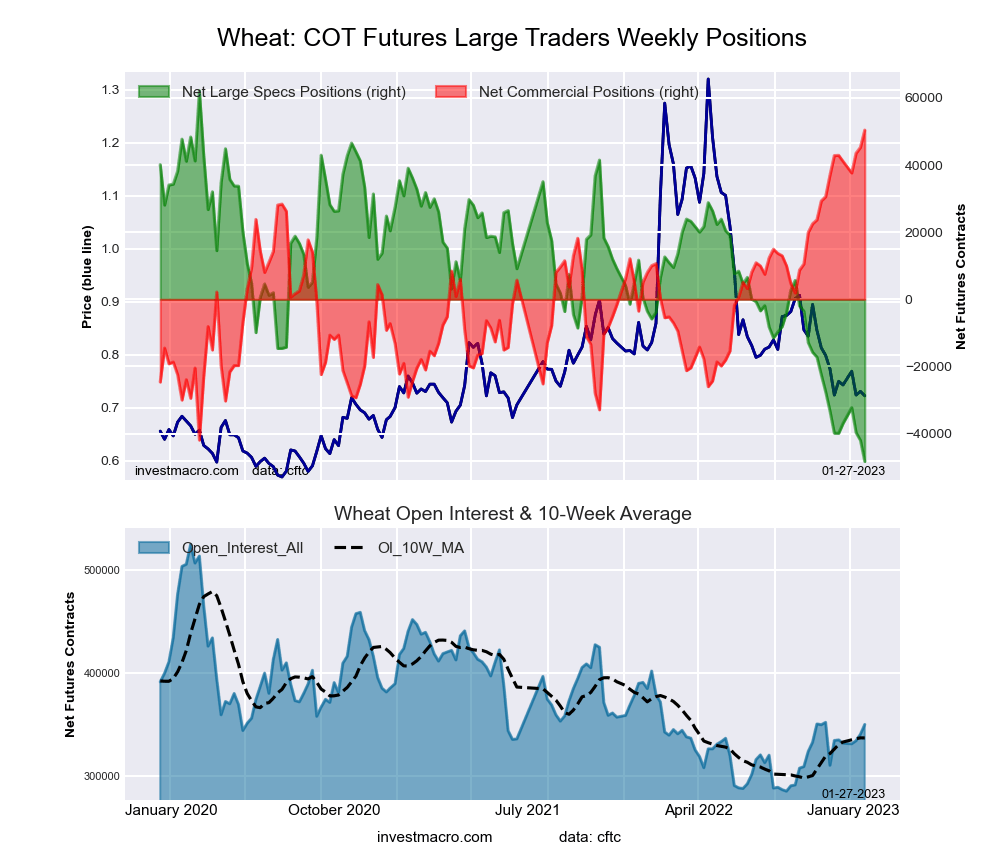 The WHEAT large speculator standing this week resulted in a net position of -48,320 contracts in the data reported through Tuesday. This was a weekly fall of -6,306 contracts from the previous week which had a total of -42,014 net contracts.
This week’s current strength score (the trader positioning range over the past three years, measured from 0 to 100) shows the speculators are currently Bearish-Extreme with a score of 0.0 percent. The commercials are Bullish-Extreme with a score of 100.0 percent and the small traders (not shown in chart) are Bullish-Extreme with a score of 99.5 percent.
| WHEAT Futures Statistics | SPECULATORS | COMMERCIALS | SMALL TRADERS |
| – Percent of Open Interest Longs: | 25.3 | 40.7 | 9.7 |
| – Percent of Open Interest Shorts: | 39.1 | 26.3 | 10.3 |
| – Net Position: | -48,320 | 50,423 | -2,103 |
| – Gross Longs: | 88,787 | 142,422 | 33,981 |
| – Gross Shorts: | 137,107 | 91,999 | 36,084 |
| – Long to Short Ratio: | 0.6 to 1 | 1.5 to 1 | 0.9 to 1 |
| NET POSITION TREND: | | | |
| – Strength Index Score (3 Year Range Pct): | 0.0 | 100.0 | 99.5 |
| – Strength Index Reading (3 Year Range): | Bearish-Extreme | Bullish-Extreme | Bullish-Extreme |
| NET POSITION MOVEMENT INDEX: | | | |
| – 6-Week Change in Strength Index: | -7.6 | 8.2 | 4.5 |
Article By InvestMacro – Receive our weekly COT Newsletter
*COT Report: The COT data, released weekly to the public each Friday, is updated through the most recent Tuesday (data is 3 days old) and shows a quick view of how large speculators or non-commercials (for-profit traders) were positioned in the futures markets.
The CFTC categorizes trader positions according to commercial hedgers (traders who use futures contracts for hedging as part of the business), non-commercials (large traders who speculate to realize trading profits) and nonreportable traders (usually small traders/speculators) as well as their open interest (contracts open in the market at time of reporting). See CFTC criteria here.


