
By InvestMacro
The latest update for the weekly Commitment of Traders (COT) report was released by the Commodity Futures Trading Commission (CFTC) on Friday for data ending on January 17th.
This weekly Extreme Positions report highlights the Most Bullish and Most Bearish Positions for the speculator category. Extreme positioning in these markets can foreshadow strong moves in the underlying market.
To signify an extreme position, we use the Strength Index (also known as the COT Index) of each instrument, a common method of measuring COT data. The Strength Index is simply a comparison of current trader positions against the range of positions over the previous 3 years. We use over 80 percent as extremely bullish and under 20 percent as extremely bearish. (Compare Strength Index scores across all markets in the data table or cot leaders table)
Here Are This Week’s Most Bullish Speculator Positions:
Soybean Meal
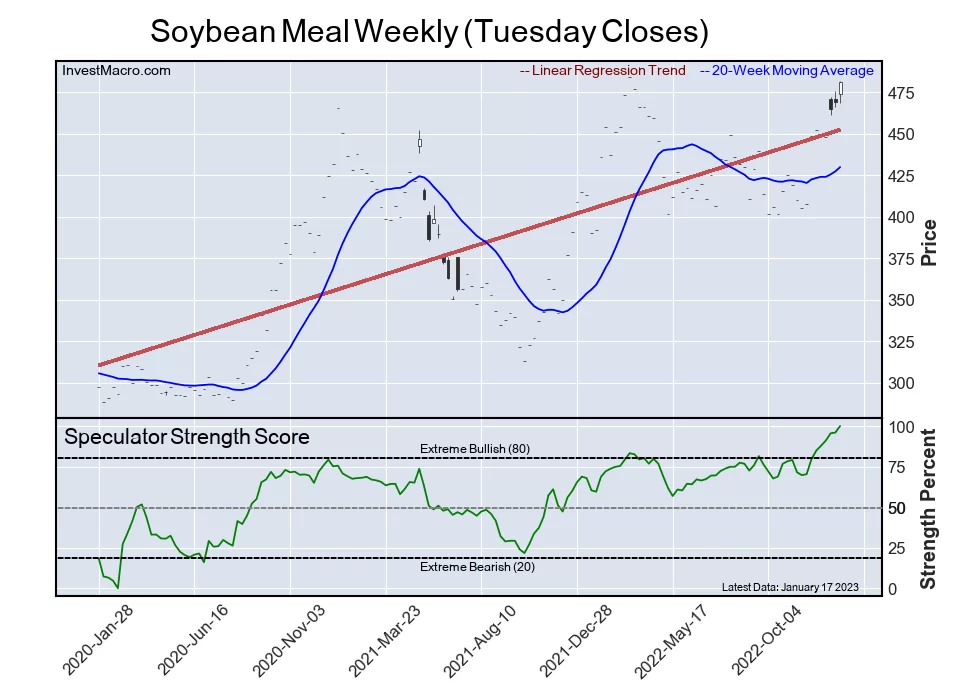
The Soybean Meal speculator position comes in as the most bullish extreme standing this week. The Soybean Meal speculator level is currently at a 100.0 percent score of its 3-year range.
The six-week trend for the percent strength score totaled 20.5 this week. The overall net speculator position was a total of 166,350 net contracts this week with a rise of 8,640 contract in the weekly speculator bets.
Free Reports:
 Download Our Metatrader 4 Indicators – Put Our Free MetaTrader 4 Custom Indicators on your charts when you join our Weekly Newsletter
 Get our Weekly Commitment of Traders Reports - See where the biggest traders (Hedge Funds and Commercial Hedgers) are positioned in the futures markets on a weekly basis.
VIX
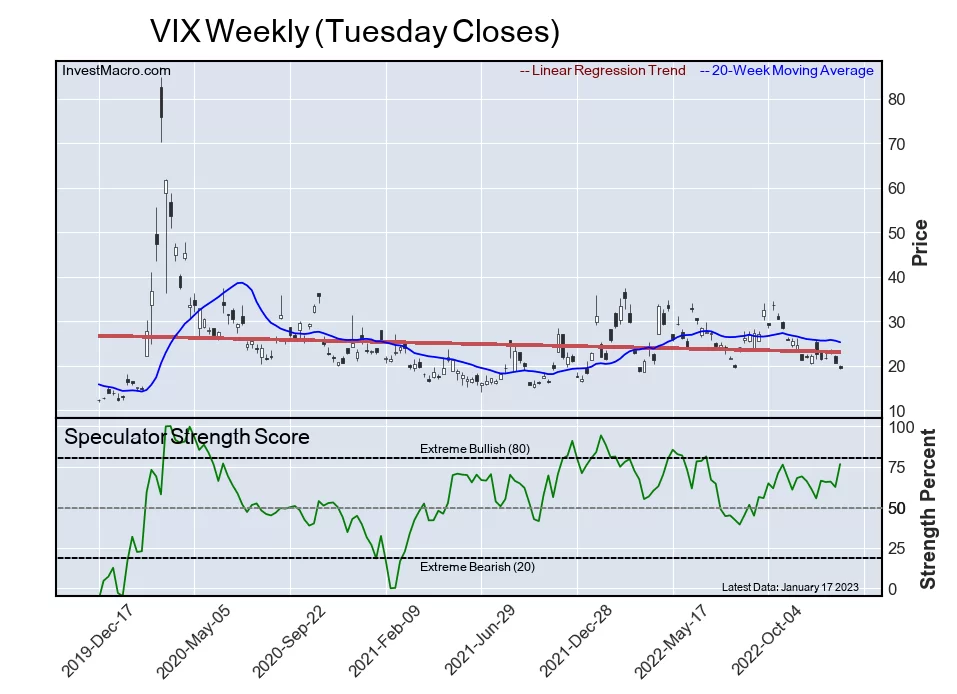
The VIX speculator position comes next in the extreme standings this week. The VIX speculator level is now at a 76.5 percent score of its 3-year range.
The six-week trend for the percent strength score was 15.3 this week. The speculator position registered -52,355 net contracts this week with a weekly gain of 20,452 contracts in speculator bets.
Euro
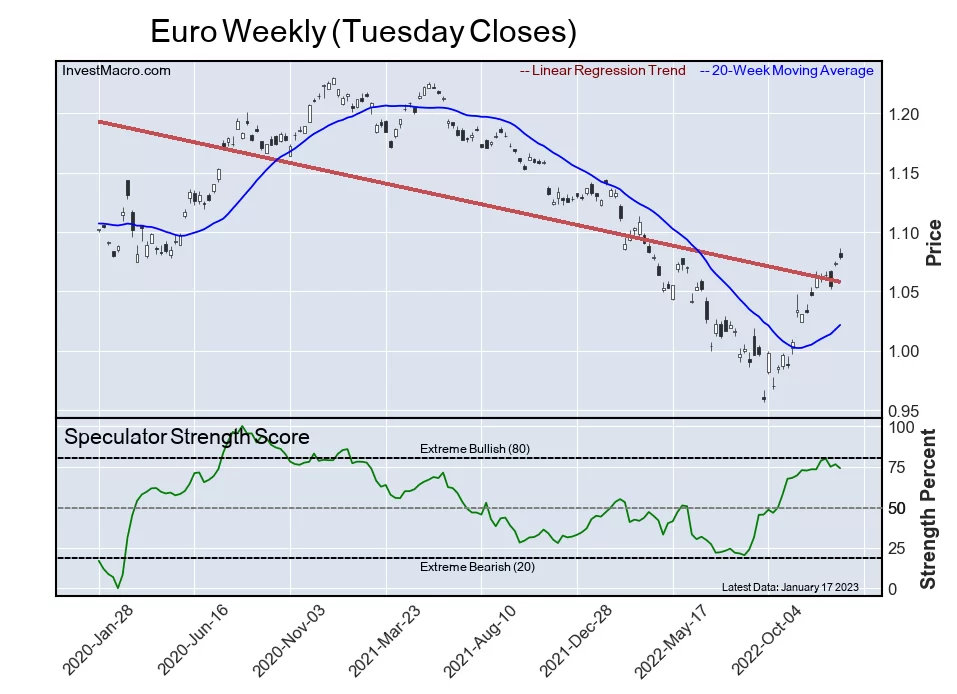
The Euro speculator position comes in third this week in the extreme standings. The Euro speculator level resides at a 74.0 percent score of its 3-year range.
The six-week trend for the speculator strength score came in at 0.6 this week. The overall speculator position was 126,984 net contracts this week with a decline of -7,998 contracts in the weekly speculator bets.
Live Cattle
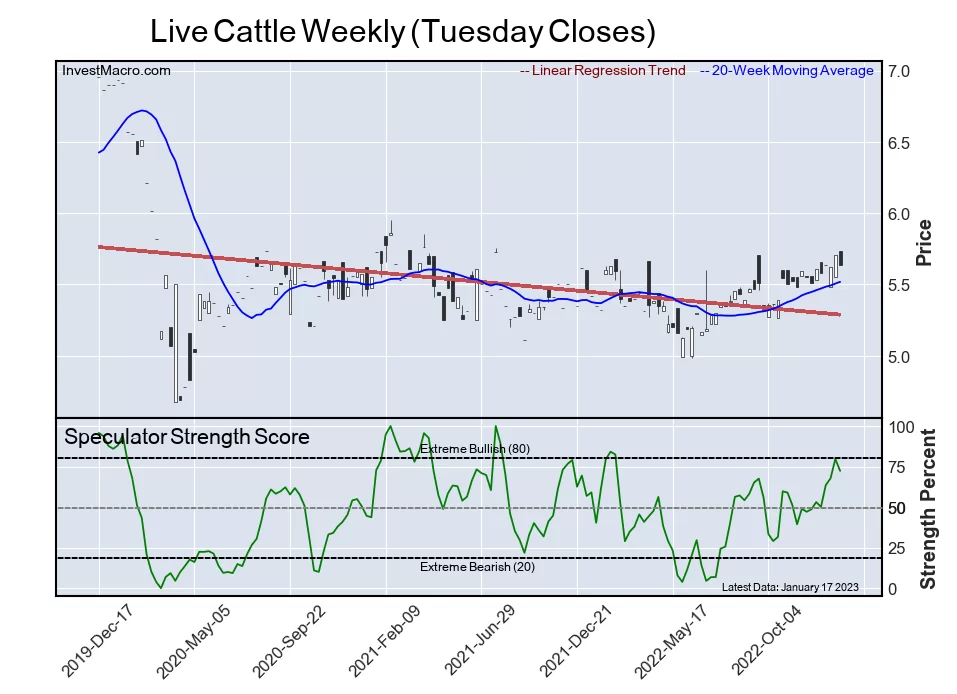
The Live Cattle speculator position comes up number four in the extreme standings this week. The Live Cattle speculator level is at a 72.3 percent score of its 3-year range.
The six-week trend for the speculator strength score totaled a change of 23.7 this week. The overall speculator position was 74,143 net contracts this week with a dip of -5,851 contracts in the speculator bets.
New Zealand Dollar

The New Zealand Dollar speculator position rounds out the top five in this week’s bullish extreme standings. The New Zealand Dollar speculator level sits at a 70.4 percent score of its 3-year range. The six-week trend for the speculator strength score was 33.6 this week.
The speculator position was 6,058 net contracts this week with a decrease of -1,292 contracts in the weekly speculator bets.
This Week’s Most Bearish Speculator Positions:
Ultra 10-Year U.S. T-Note
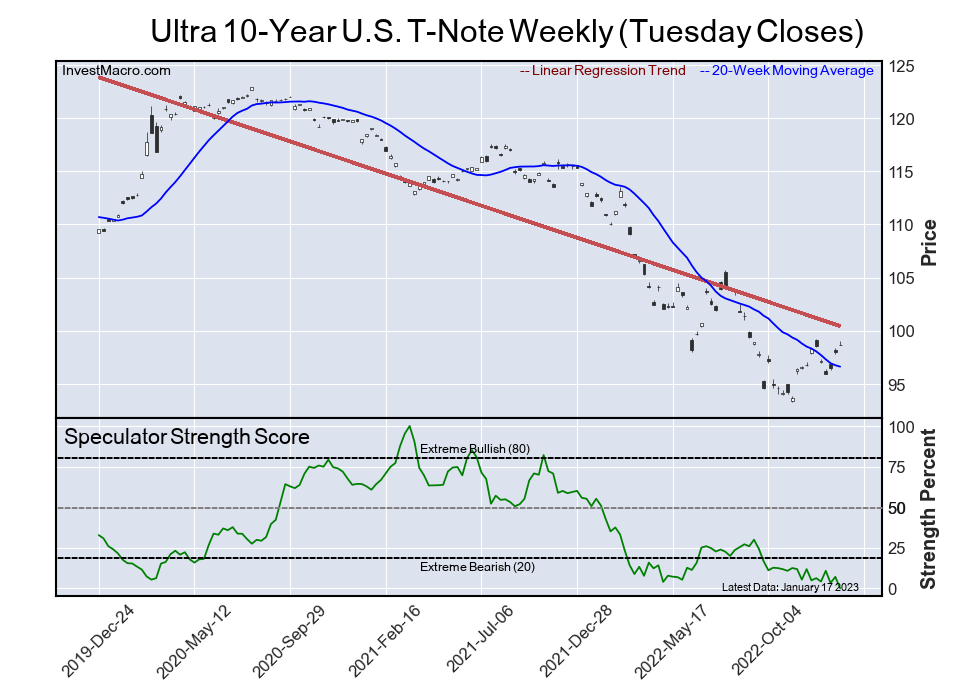
The Ultra 10-Year U.S. T-Note speculator position comes in as the most bearish extreme standing this week. The Ultra 10-Year U.S. T-Note speculator level is at a 0.0 percent score of its 3-year range.
The six-week trend for the speculator strength score was -4.8 this week. The overall speculator position was -126,321 net contracts this week with a decline of -28,051 contracts in the speculator bets.
Wheat

The Wheat speculator position comes in next for the most bearish extreme standing on the week. The Wheat speculator level is at a 0.0 percent score of its 3-year range.
The six-week trend for the speculator strength score was -2.0 this week. The speculator position was -42,014 net contracts this week with a dip of -2,298 contracts in the weekly speculator bets.
10-Year Note
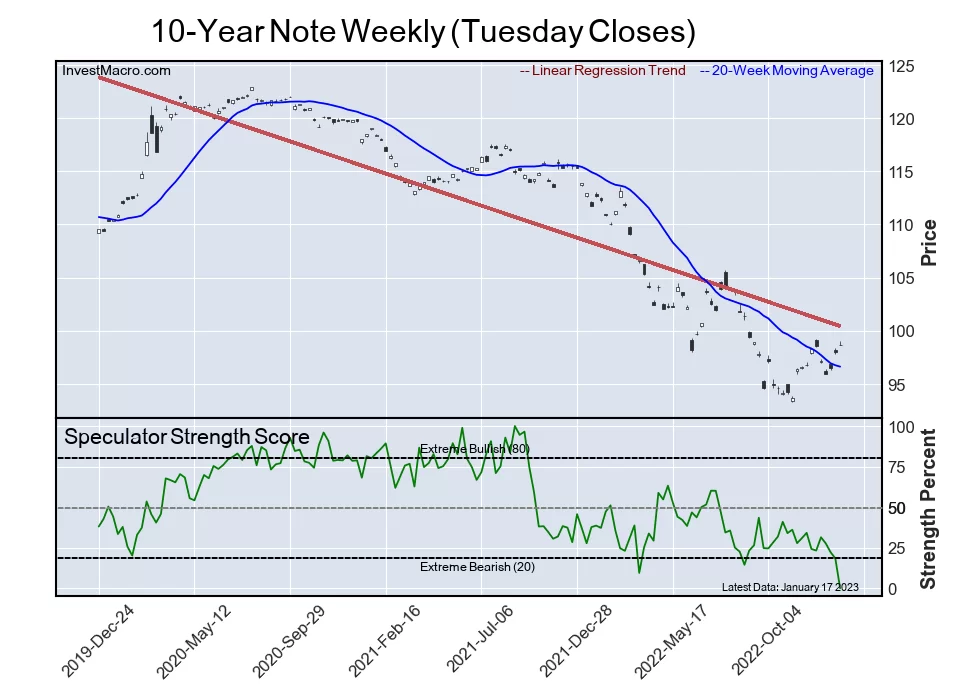
The 10-Year Note speculator position comes in as third most bearish extreme standing of the week. The 10-Year Note speculator level resides at a 0.0 percent score of its 3-year range.
The six-week trend for the speculator strength score was -24.2 this week. The overall speculator position was -545,057 net contracts this week with a shortfall of -133,699 contracts in the speculator bets.
Coffee
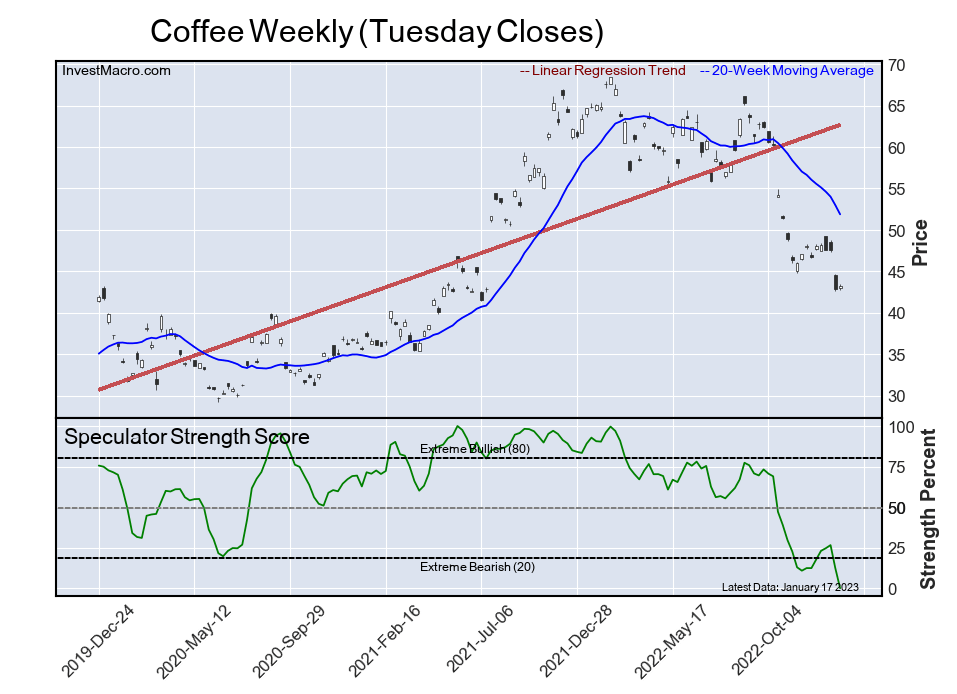
The Coffee speculator position comes in as this week’s fourth most bearish extreme standing. The Coffee speculator level is at a 0.0 percent score of its 3-year range.
The six-week trend for the speculator strength score was -12.4 this week. The speculator position was -26,745 net contracts this week with a decline of -12,006 contracts in the weekly speculator bets.
5-Year Bond
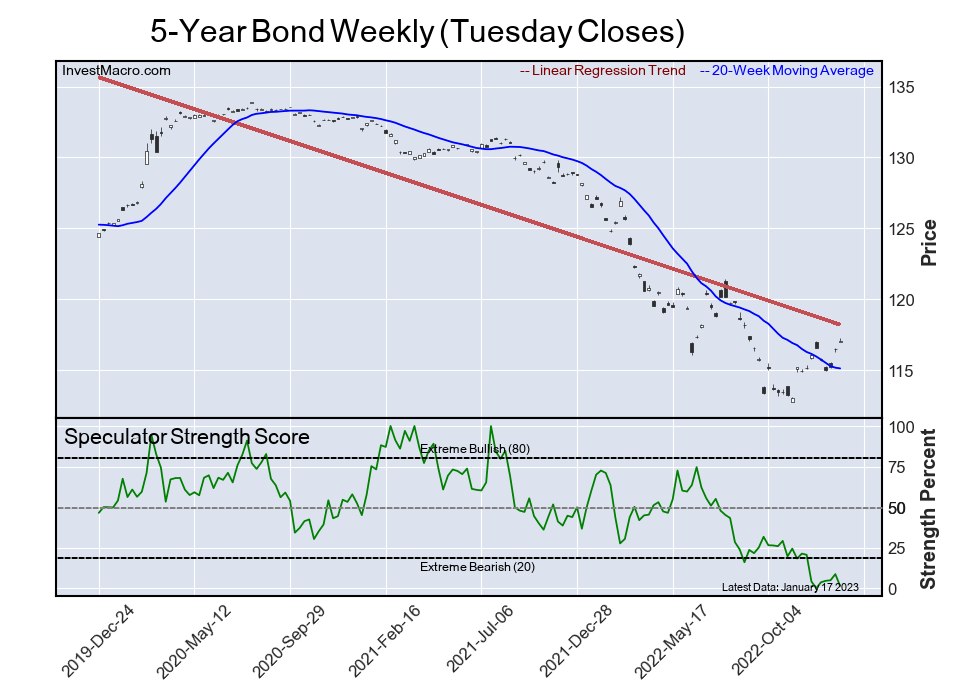
Finally, the 5-Year Bond speculator position comes in as the fifth most bearish extreme standing for this week. The 5-Year Bond speculator level is at a 1.4 percent score of its 3-year range.
The six-week trend for the speculator strength score was -2.8 this week. The speculator position was -680,655 net contracts this week with a drop of -57,504 contracts in the weekly speculator bets.
Speculators or Non-Commercials Notes:
Speculators, classified as non-commercial traders by the CFTC, are made up of large commodity funds, hedge funds and other significant for-profit participants. The Specs are generally regarded as trend-followers in their behavior towards price action – net speculator bets and prices tend to go in the same directions. These traders often look to buy when prices are rising and sell when prices are falling. To illustrate this point, many times speculator contracts can be found at their most extremes (bullish or bearish) when prices are also close to their highest or lowest levels.
These extreme levels can be dangerous for the large speculators as the trade is most crowded, there is less trading ammunition still sitting on the sidelines to push the trend further and prices have moved a significant distance. When the trend becomes exhausted, some speculators take profits while others look to also exit positions when prices fail to continue in the same direction. This process usually plays out over many months to years and can ultimately create a reverse effect where prices start to fall and speculators start a process of selling when prices are falling.
Article By InvestMacro – Receive our weekly COT Newsletter
*COT Report: The COT data, released weekly to the public each Friday, is updated through the most recent Tuesday (data is 3 days old) and shows a quick view of how large speculators or non-commercials (for-profit traders) were positioned in the futures markets.
The CFTC categorizes trader positions according to commercial hedgers (traders who use futures contracts for hedging as part of the business), non-commercials (large traders who speculate to realize trading profits) and nonreportable traders (usually small traders/speculators) as well as their open interest (contracts open in the market at time of reporting). See CFTC criteria here.

- The US introduces new import tariffs for 60 countries. Brent crude surpasses $100 per barrel Jul 24, 2026
- USD/JPY Breaks Records: Nothing Slows the Yen’s Decline Jul 24, 2026
- Oil prices reached a 6‑week high. The AUD strengthened on the back of a strong labor‑market report Jul 23, 2026
- EUR/USD Recovers as Dollar Weakens Jul 23, 2026
- Bitcoin rose to $66,000. The New Zealand dollar continues to strengthen Jul 22, 2026
- Inflationary pressure is easing in Canada. In New Zealand, on the contrary, inflation is rising Jul 21, 2026
- GBP/USD Falls After Cabinet Changes Jul 21, 2026
- Geopolitical and macroeconomic conditions continue to pressure market sentiment Jul 20, 2026
- USD/JPY Poised to Continue Gains as Expensive Oil and Lack of Support Weigh on Yen Jul 20, 2026
- COT Metals Charts: Weekly Speculator Bets led by Copper & Steel Jul 18, 2026