
By InvestMacro
Here are the latest charts and statistics for the Commitment of Traders (COT) data published by the Commodities Futures Trading Commission (CFTC).
The latest COT data is updated through Tuesday January 17th and shows a quick view of how large traders (for-profit speculators and commercial entities) were positioned in the futures markets.
Weekly Speculator Changes led by VIX
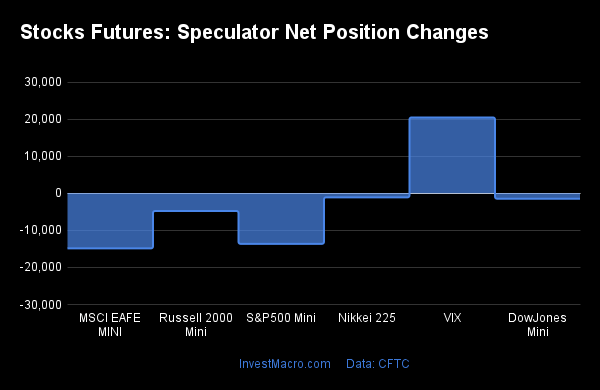
The COT stock markets speculator bets were lower this week as just one out of the six stock markets we cover had higher positioning while the other seven markets had lower speculator contracts.
Free Reports:
 Get our Weekly Commitment of Traders Reports - See where the biggest traders (Hedge Funds and Commercial Hedgers) are positioned in the futures markets on a weekly basis.
 Download Our Metatrader 4 Indicators – Put Our Free MetaTrader 4 Custom Indicators on your charts when you join our Weekly Newsletter
The only market with gains for this week was the VIX with a rise of 20,452 contracts.
The markets with the declines in speculator bets this week were Nasdaq-Mini (-12,482 contracts) with the Russell-Mini (-4,787 contracts), MSCI EAFE-Mini (-14,869 contracts), S&P500-Mini (-13,644 contracts), DowJones-Mini (-1,471 contracts) and the Nikkei 225 (-1,106 contracts) also registering lower bets on the week.
| Jan-17-2023 | OI | OI-Index | Spec-Net | Spec-Index | Com-Net | COM-Index | Smalls-Net | Smalls-Index |
|---|---|---|---|---|---|---|---|---|
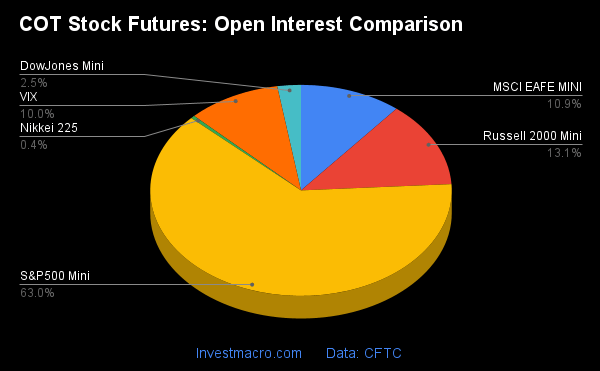
| S&P500-Mini | 2,056,472 | 4 | -226,818 | 14 | 231,163 | 81 | -4,345 | 25 |
| Nikkei 225 | 14,138 | 10 | -3,825 | 59 | 4,340 | 51 | -515 | 22 |
| Nasdaq-Mini | 275,015 | 57 | -20,633 | 64 | 30,544 | 45 | -9,911 | 33 |
| DowJones-Mini | 82,660 | 46 | -10,613 | 27 | 12,290 | 74 | -1,677 | 32 |
| VIX | 326,900 | 49 | -52,355 | 77 | 55,595 | 22 | -3,240 | 76 |
| Nikkei 225 Yen | 37,043 | 14 | 7,971 | 59 | -2,240 | 4 | -5,731 | 68 |
Strength Scores led by VIX & Nasdaq-Mini

COT Strength Scores (a normalized measure of Speculator positions over a 3-Year range, from 0 to 100 where above 80 is Extreme-Bullish and below 20 is Extreme-Bearish) showed that the VIX (77 percent) and the Nasdaq-Mini (64 percent) lead the stock markets this week. The Nikkei 225 (59 percent) and Nikkei 225 Yen (59 percent) come in as the next highest in the weekly strength scores.
On the downside, the MSCI EAFE-Mini (9 percent) comes in at the lowest strength level currently and is in Extreme-Bearish territory (below 20 percent). The next lowest strength score is the S&P500-Mini (14 percent).
Strength Statistics:
VIX (76.5 percent) vs VIX previous week (62.4 percent)
S&P500-Mini (14.2 percent) vs S&P500-Mini previous week (16.7 percent)
DowJones-Mini (27.1 percent) vs DowJones-Mini previous week (29.3 percent)
Nasdaq-Mini (63.5 percent) vs Nasdaq-Mini previous week (70.5 percent)
Russell2000-Mini (32.0 percent) vs Russell2000-Mini previous week (34.7 percent)
Nikkei USD (59.3 percent) vs Nikkei USD previous week (64.6 percent)
EAFE-Mini (9.4 percent) vs EAFE-Mini previous week (27.2 percent)
VIX & Nikkei 225 Yen top the 6-Week Strength Trends

COT Strength Score Trends (or move index, calculates the 6-week changes in strength scores) showed that the VIX (15 percent) leads the past six weeks trends for the stock markets. The Nikkei 225 Yen (8 percent), the Russell-Mini (6 percent) and the DowJones-Mini (1 percent) are the next highest positive movers in the latest trends data.
The MSCI EAFE-Mini (-26 percent) leads the downside trend scores currently with the Nasdaq-Mini (-19 percent) coming in as the next market with lower trend scores.
Strength Trend Statistics:
VIX (15.3 percent) vs VIX previous week (-3.6 percent)
S&P500-Mini (-4.3 percent) vs S&P500-Mini previous week (-1.7 percent)
DowJones-Mini (1.5 percent) vs DowJones-Mini previous week (-4.5 percent)
Nasdaq-Mini (-19.1 percent) vs Nasdaq-Mini previous week (-10.0 percent)
Russell2000-Mini (5.9 percent) vs Russell2000-Mini previous week (-0.3 percent)
Nikkei USD (-6.1 percent) vs Nikkei USD previous week (-3.9 percent)
EAFE-Mini (-25.5 percent) vs EAFE-Mini previous week (15.7 percent)
Individual Stock Market Charts:
VIX Volatility Futures:
 The VIX Volatility large speculator standing this week came in at a net position of -52,355 contracts in the data reported through Tuesday. This was a weekly boost of 20,452 contracts from the previous week which had a total of -72,807 net contracts.
This week’s current strength score (the trader positioning range over the past three years, measured from 0 to 100) shows the speculators are currently Bullish with a score of 76.5 percent. The commercials are Bearish with a score of 22.1 percent and the small traders (not shown in chart) are Bullish with a score of 75.6 percent.
| VIX Volatility Futures Statistics | SPECULATORS | COMMERCIALS | SMALL TRADERS |
| – Percent of Open Interest Longs: | 16.4 | 53.9 | 8.8 |
| – Percent of Open Interest Shorts: | 32.4 | 36.9 | 9.8 |
| – Net Position: | -52,355 | 55,595 | -3,240 |
| – Gross Longs: | 53,609 | 176,081 | 28,892 |
| – Gross Shorts: | 105,964 | 120,486 | 32,132 |
| – Long to Short Ratio: | 0.5 to 1 | 1.5 to 1 | 0.9 to 1 |
| NET POSITION TREND: | |||
| – Strength Index Score (3 Year Range Pct): | 76.5 | 22.1 | 75.6 |
| – Strength Index Reading (3 Year Range): | Bullish | Bearish | Bullish |
| NET POSITION MOVEMENT INDEX: | |||
| – 6-Week Change in Strength Index: | 15.3 | -15.3 | 3.2 |
S&P500 Mini Futures:
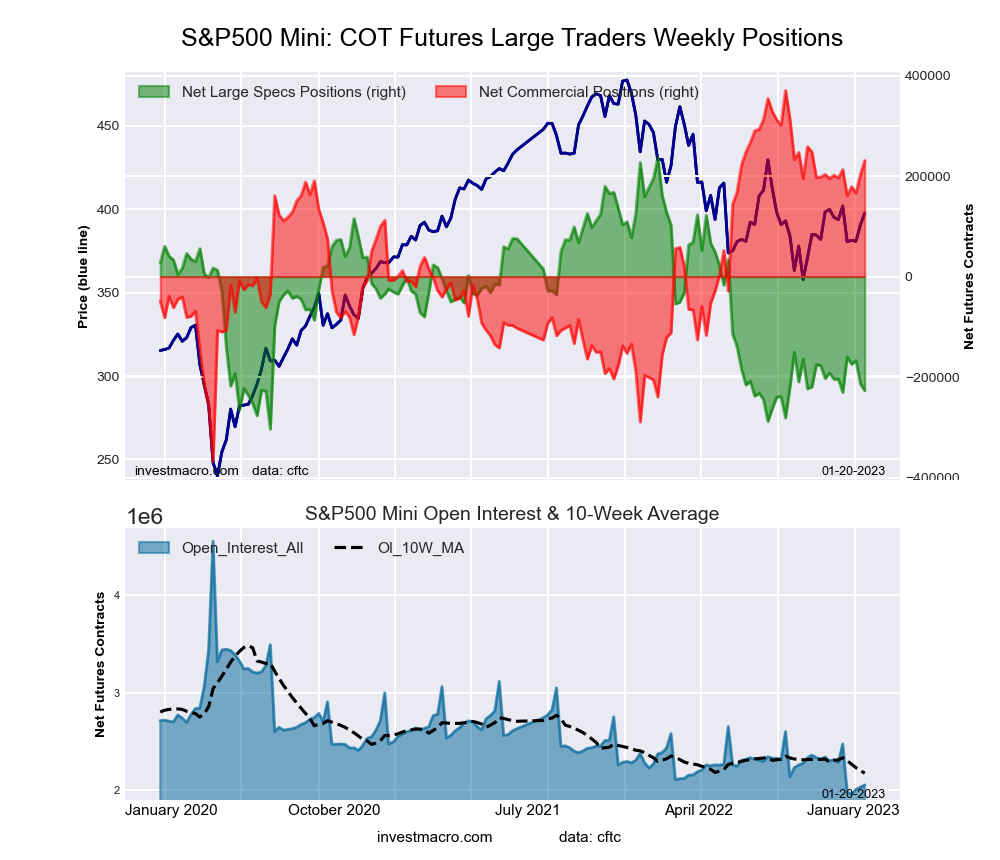 The S&P500 Mini large speculator standing this week came in at a net position of -226,818 contracts in the data reported through Tuesday. This was a weekly reduction of -13,644 contracts from the previous week which had a total of -213,174 net contracts.
This week’s current strength score (the trader positioning range over the past three years, measured from 0 to 100) shows the speculators are currently Bearish-Extreme with a score of 14.2 percent. The commercials are Bullish-Extreme with a score of 81.2 percent and the small traders (not shown in chart) are Bearish with a score of 25.5 percent.
| S&P500 Mini Futures Statistics | SPECULATORS | COMMERCIALS | SMALL TRADERS |
| – Percent of Open Interest Longs: | 12.7 | 73.8 | 11.4 |
| – Percent of Open Interest Shorts: | 23.7 | 62.6 | 11.6 |
| – Net Position: | -226,818 | 231,163 | -4,345 |
| – Gross Longs: | 260,337 | 1,518,121 | 234,865 |
| – Gross Shorts: | 487,155 | 1,286,958 | 239,210 |
| – Long to Short Ratio: | 0.5 to 1 | 1.2 to 1 | 1.0 to 1 |
| NET POSITION TREND: | |||
| – Strength Index Score (3 Year Range Pct): | 14.2 | 81.2 | 25.5 |
| – Strength Index Reading (3 Year Range): | Bearish-Extreme | Bullish-Extreme | Bearish |
| NET POSITION MOVEMENT INDEX: | |||
| – 6-Week Change in Strength Index: | -4.3 | 4.7 | -2.4 |
Dow Jones Mini Futures:
 The Dow Jones Mini large speculator standing this week came in at a net position of -10,613 contracts in the data reported through Tuesday. This was a weekly decline of -1,471 contracts from the previous week which had a total of -9,142 net contracts.
This week’s current strength score (the trader positioning range over the past three years, measured from 0 to 100) shows the speculators are currently Bearish with a score of 27.1 percent. The commercials are Bullish with a score of 73.9 percent and the small traders (not shown in chart) are Bearish with a score of 32.2 percent.
| Dow Jones Mini Futures Statistics | SPECULATORS | COMMERCIALS | SMALL TRADERS |
| – Percent of Open Interest Longs: | 31.3 | 48.3 | 16.5 |
| – Percent of Open Interest Shorts: | 44.1 | 33.5 | 18.5 |
| – Net Position: | -10,613 | 12,290 | -1,677 |
| – Gross Longs: | 25,847 | 39,948 | 13,654 |
| – Gross Shorts: | 36,460 | 27,658 | 15,331 |
| – Long to Short Ratio: | 0.7 to 1 | 1.4 to 1 | 0.9 to 1 |
| NET POSITION TREND: | |||
| – Strength Index Score (3 Year Range Pct): | 27.1 | 73.9 | 32.2 |
| – Strength Index Reading (3 Year Range): | Bearish | Bullish | Bearish |
| NET POSITION MOVEMENT INDEX: | |||
| – 6-Week Change in Strength Index: | 1.5 | -9.7 | 29.9 |
Nasdaq Mini Futures:
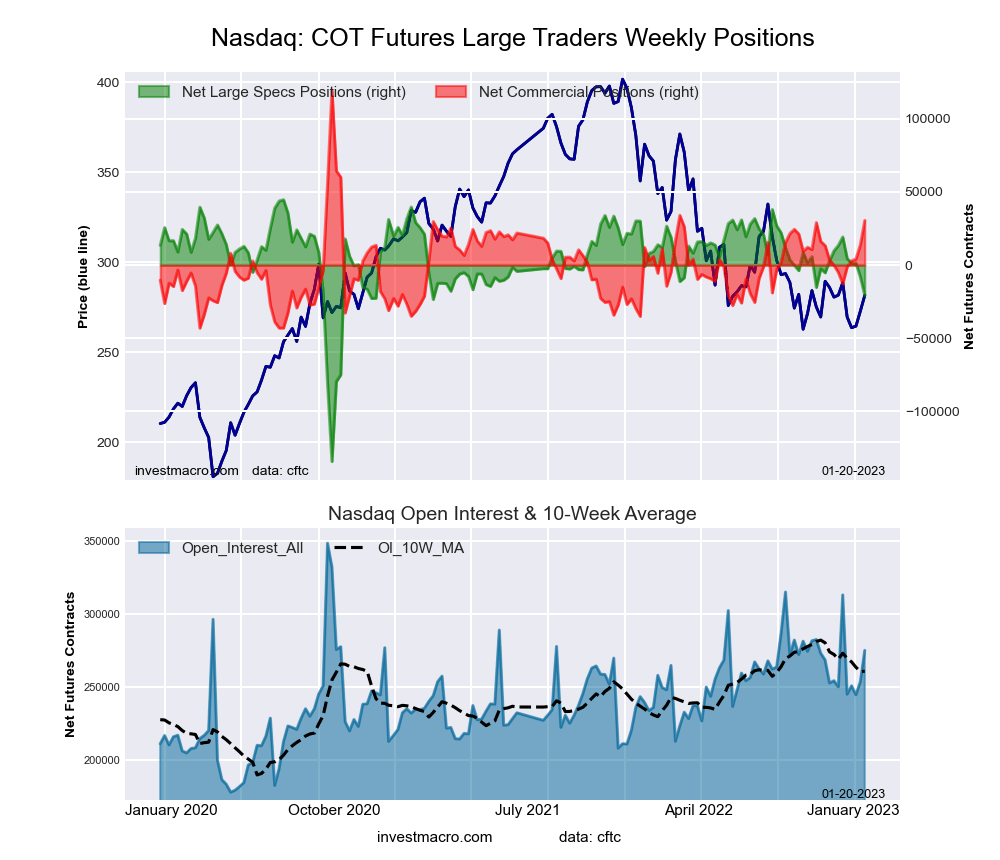 The Nasdaq Mini large speculator standing this week came in at a net position of -20,633 contracts in the data reported through Tuesday. This was a weekly lowering of -12,482 contracts from the previous week which had a total of -8,151 net contracts.
This week’s current strength score (the trader positioning range over the past three years, measured from 0 to 100) shows the speculators are currently Bullish with a score of 63.5 percent. The commercials are Bearish with a score of 45.3 percent and the small traders (not shown in chart) are Bearish with a score of 33.3 percent.
| Nasdaq Mini Futures Statistics | SPECULATORS | COMMERCIALS | SMALL TRADERS |
| – Percent of Open Interest Longs: | 22.4 | 62.9 | 11.9 |
| – Percent of Open Interest Shorts: | 29.9 | 51.8 | 15.5 |
| – Net Position: | -20,633 | 30,544 | -9,911 |
| – Gross Longs: | 61,621 | 172,926 | 32,760 |
| – Gross Shorts: | 82,254 | 142,382 | 42,671 |
| – Long to Short Ratio: | 0.7 to 1 | 1.2 to 1 | 0.8 to 1 |
| NET POSITION TREND: | |||
| – Strength Index Score (3 Year Range Pct): | 63.5 | 45.3 | 33.3 |
| – Strength Index Reading (3 Year Range): | Bullish | Bearish | Bearish |
| NET POSITION MOVEMENT INDEX: | |||
| – 6-Week Change in Strength Index: | -19.1 | 21.9 | -2.7 |
Russell 2000 Mini Futures:
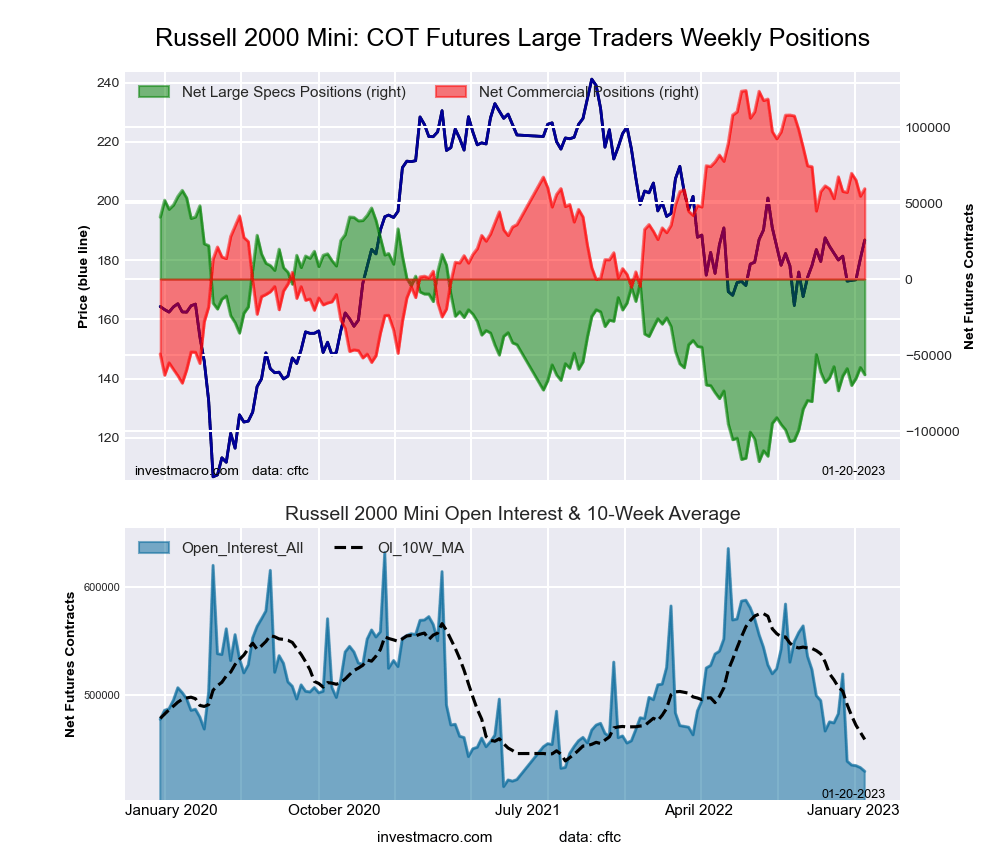 The Russell 2000 Mini large speculator standing this week came in at a net position of -62,915 contracts in the data reported through Tuesday. This was a weekly fall of -4,787 contracts from the previous week which had a total of -58,128 net contracts.
This week’s current strength score (the trader positioning range over the past three years, measured from 0 to 100) shows the speculators are currently Bearish with a score of 32.0 percent. The commercials are Bullish with a score of 66.4 percent and the small traders (not shown in chart) are Bearish with a score of 37.4 percent.
| Russell 2000 Mini Futures Statistics | SPECULATORS | COMMERCIALS | SMALL TRADERS |
| – Percent of Open Interest Longs: | 10.4 | 82.7 | 5.7 |
| – Percent of Open Interest Shorts: | 25.1 | 68.8 | 4.9 |
| – Net Position: | -62,915 | 59,423 | 3,492 |
| – Gross Longs: | 44,629 | 354,698 | 24,352 |
| – Gross Shorts: | 107,544 | 295,275 | 20,860 |
| – Long to Short Ratio: | 0.4 to 1 | 1.2 to 1 | 1.2 to 1 |
| NET POSITION TREND: | |||
| – Strength Index Score (3 Year Range Pct): | 32.0 | 66.4 | 37.4 |
| – Strength Index Reading (3 Year Range): | Bearish | Bullish | Bearish |
| NET POSITION MOVEMENT INDEX: | |||
| – 6-Week Change in Strength Index: | 5.9 | -4.1 | -8.3 |
Nikkei Stock Average (USD) Futures:
 The Nikkei Stock Average (USD) large speculator standing this week came in at a net position of -3,825 contracts in the data reported through Tuesday. This was a weekly decrease of -1,106 contracts from the previous week which had a total of -2,719 net contracts.
This week’s current strength score (the trader positioning range over the past three years, measured from 0 to 100) shows the speculators are currently Bullish with a score of 59.3 percent. The commercials are Bullish with a score of 51.4 percent and the small traders (not shown in chart) are Bearish with a score of 21.9 percent.
| Nikkei Stock Average Futures Statistics | SPECULATORS | COMMERCIALS | SMALL TRADERS |
| – Percent of Open Interest Longs: | 18.1 | 61.2 | 20.6 |
| – Percent of Open Interest Shorts: | 45.2 | 30.5 | 24.3 |
| – Net Position: | -3,825 | 4,340 | -515 |
| – Gross Longs: | 2,560 | 8,653 | 2,914 |
| – Gross Shorts: | 6,385 | 4,313 | 3,429 |
| – Long to Short Ratio: | 0.4 to 1 | 2.0 to 1 | 0.8 to 1 |
| NET POSITION TREND: | |||
| – Strength Index Score (3 Year Range Pct): | 59.3 | 51.4 | 21.9 |
| – Strength Index Reading (3 Year Range): | Bullish | Bullish | Bearish |
| NET POSITION MOVEMENT INDEX: | |||
| – 6-Week Change in Strength Index: | -6.1 | 13.4 | -17.4 |
MSCI EAFE Mini Futures:
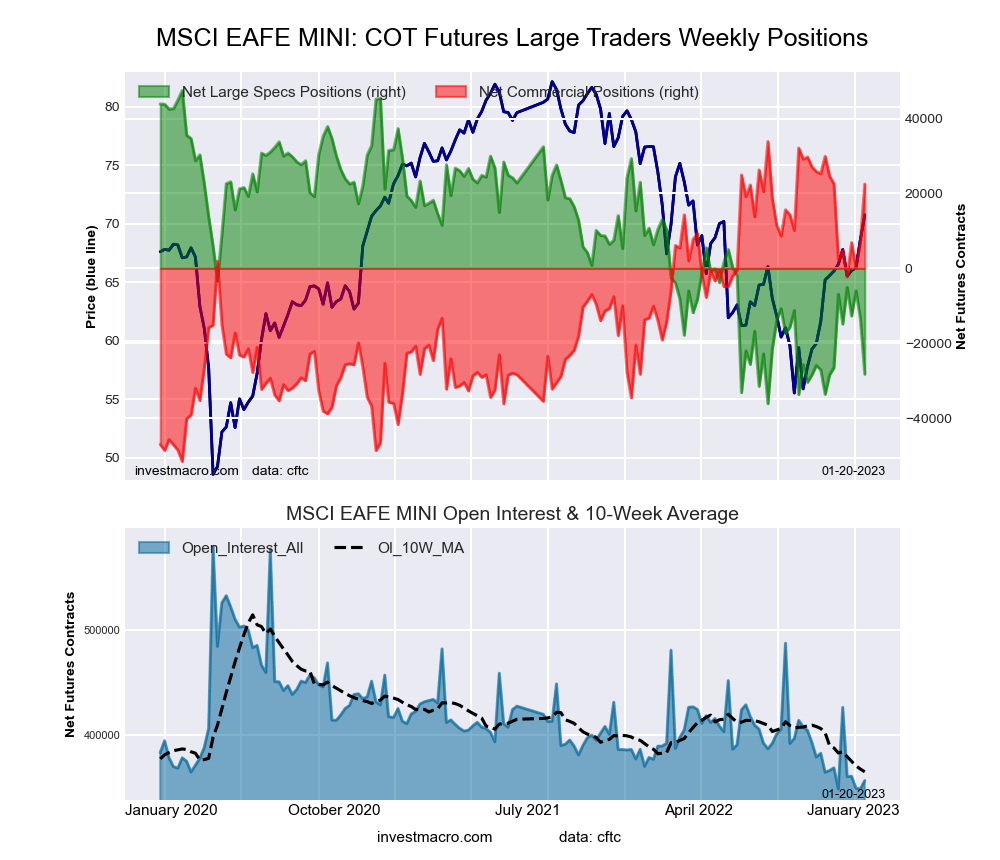 The MSCI EAFE Mini large speculator standing this week came in at a net position of -28,278 contracts in the data reported through Tuesday. This was a weekly decrease of -14,869 contracts from the previous week which had a total of -13,409 net contracts.
This week’s current strength score (the trader positioning range over the past three years, measured from 0 to 100) shows the speculators are currently Bearish-Extreme with a score of 9.4 percent. The commercials are Bullish-Extreme with a score of 86.7 percent and the small traders (not shown in chart) are Bullish with a score of 68.7 percent.
| MSCI EAFE Mini Futures Statistics | SPECULATORS | COMMERCIALS | SMALL TRADERS |
| – Percent of Open Interest Longs: | 5.2 | 91.1 | 3.2 |
| – Percent of Open Interest Shorts: | 13.2 | 84.8 | 1.5 |
| – Net Position: | -28,278 | 22,516 | 5,762 |
| – Gross Longs: | 18,717 | 324,872 | 11,276 |
| – Gross Shorts: | 46,995 | 302,356 | 5,514 |
| – Long to Short Ratio: | 0.4 to 1 | 1.1 to 1 | 2.0 to 1 |
| NET POSITION TREND: | |||
| – Strength Index Score (3 Year Range Pct): | 9.4 | 86.7 | 68.7 |
| – Strength Index Reading (3 Year Range): | Bearish-Extreme | Bullish-Extreme | Bullish |
| NET POSITION MOVEMENT INDEX: | |||
| – 6-Week Change in Strength Index: | -25.5 | 23.7 | 8.5 |
Article By InvestMacro – Receive our weekly COT Newsletter
*COT Report: The COT data, released weekly to the public each Friday, is updated through the most recent Tuesday (data is 3 days old) and shows a quick view of how large speculators or non-commercials (for-profit traders) were positioned in the futures markets.
The CFTC categorizes trader positions according to commercial hedgers (traders who use futures contracts for hedging as part of the business), non-commercials (large traders who speculate to realize trading profits) and nonreportable traders (usually small traders/speculators) as well as their open interest (contracts open in the market at time of reporting). See CFTC criteria here.

- COT Metals Charts: Weekly Speculator Changes led by Copper Jul 26, 2026
- COT Bonds Charts: Speculator Bets led by SOFR 3-Months & 5-Year Bonds Jul 26, 2026
- COT Energy Charts: Weekly Speculator Bets led by WTI Crude & Natural Gas Jul 26, 2026
- COT Soft Commodities Charts: Weekly Speculator Bets led by Corn & Soybeans Jul 26, 2026
- The US introduces new import tariffs for 60 countries. Brent crude surpasses $100 per barrel Jul 24, 2026
- USD/JPY Breaks Records: Nothing Slows the Yen’s Decline Jul 24, 2026
- Oil prices reached a 6‑week high. The AUD strengthened on the back of a strong labor‑market report Jul 23, 2026
- EUR/USD Recovers as Dollar Weakens Jul 23, 2026
- Bitcoin rose to $66,000. The New Zealand dollar continues to strengthen Jul 22, 2026
- Inflationary pressure is easing in Canada. In New Zealand, on the contrary, inflation is rising Jul 21, 2026