By InvestMacro

Here are the latest charts and statistics for the Commitment of Traders (COT) data published by the Commodities Futures Trading Commission (CFTC).
The latest COT data is updated through Tuesday January 16th and shows a quick view of how large market participants (for-profit speculators and commercial traders) were positioned in the futures markets. All currency positions are in direct relation to the US dollar where, for example, a bet for the euro is a bet that the euro will rise versus the dollar while a bet against the euro will be a bet that the euro will decline versus the dollar.
Weekly Speculator Changes led by British Pound Sterling & Swiss Franc
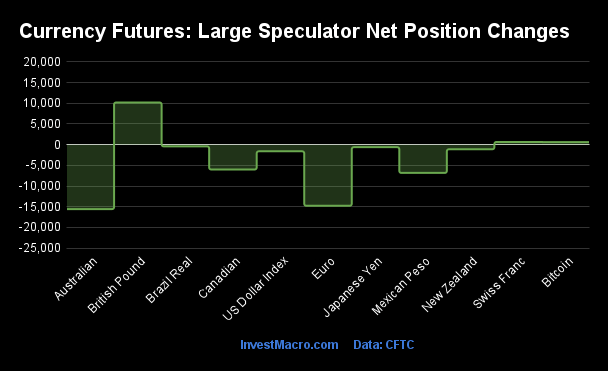
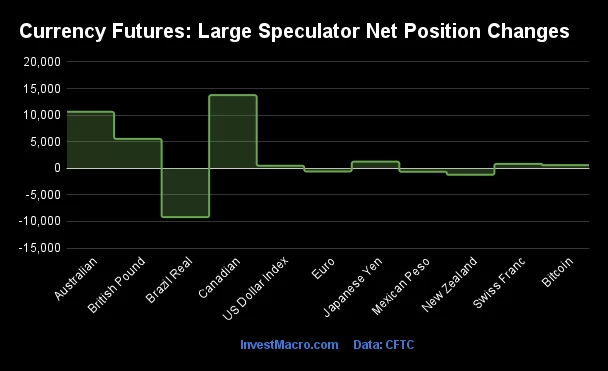
The COT currency market speculator bets were lower this week as three out of the eleven currency markets we cover had higher positioning while the other eight markets had lower speculator contracts.
Leading the gains for the currency markets was the British Pound (10,197 contracts) with the Swiss Franc (654 contracts) and Bitcoin (624 contracts) also recording positive weeks.
The currencies seeing declines in speculator bets on the week were the Australian Dollar (-15,583 contracts), the Euro (-14,785 contracts), the Mexican Peso (-6,837 contracts), the Canadian Dollar (-6,008 contracts), the US Dollar Index (-1,610 contracts), the New Zealand Dollar (-1,115 contracts), the Japanese Yen (-611 contracts) and with the Brazilian Real (-419 contracts) also seeing lower bets on the week.
Speculators drop their US Dollar Index bets to 133-week low
Highlighting the COT currency’s data this week is the continued decline of the speculator’s positioning in the US Dollar Index. The large speculative US Dollar Index positions fell this week for a fifth time out of the past six weeks. The speculator position has now seen an overall decrease by a total of -18,644 net contracts over this last six-week span.
This recent weakness has brought the US Dollar Index speculator net position (currently at a total of +1,300 contracts) to a 133-week low, dating back to June 29th of 2021 when the net position saw it’s last bearish reading at -448 contracts.
The Dollar Index is starting off 2024 on much weaker footing than the previous two years as expectations of peak interest rates in the US have weighed on the currency’s outlook. The Dollar Index’s speculator positioning started 2023 with a total of +17,761 contracts in the first week of trading and the average weekly speculator position over the whole of 2023 was +12,782 contracts. The first week of 2022 started even stronger with a net position of +39,078 contracts in the first week and the weekly average speculator position over the course of 2022 was +33,606 contracts.
The US Dollar Index price, despite the recent setback in speculator bets, has risen for two out of the past three weeks with an approximate gain by 1 percent this week. Since October, the USD Index has been on a downtrend and declined from an October high of 107.05 to the most recent low at 100.32 in late December. The USD Index price has come off that 100.00 support level and has now climbed back to the 103.07 level to close out this week.
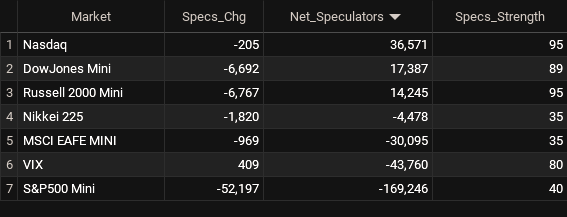
Major Currencies – Speculators Leaderboard
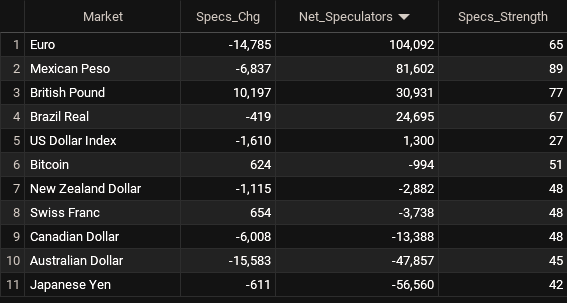
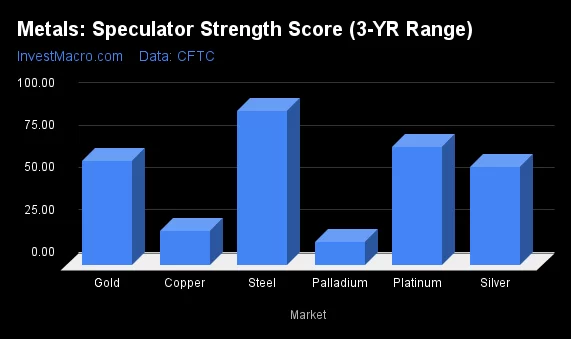
Legend: Weekly Speculators Change | Speculators Current Net Position | Speculators Strength Score compared to last 3-Years (0-100 range)
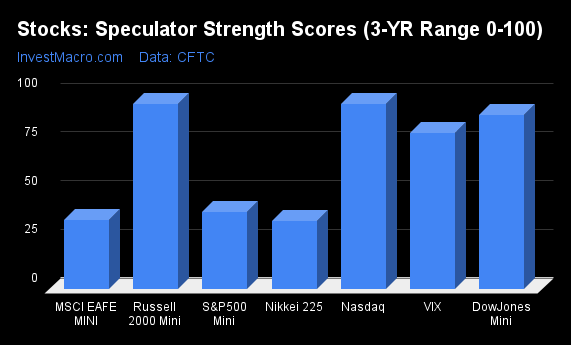
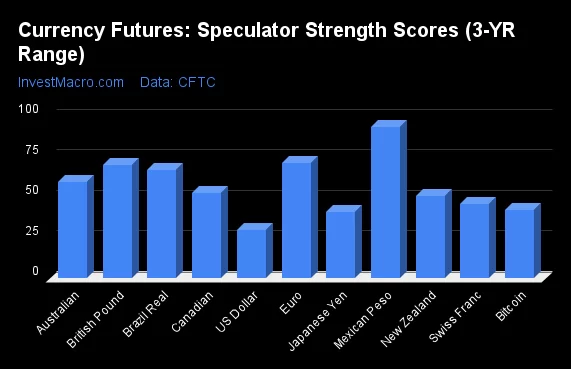
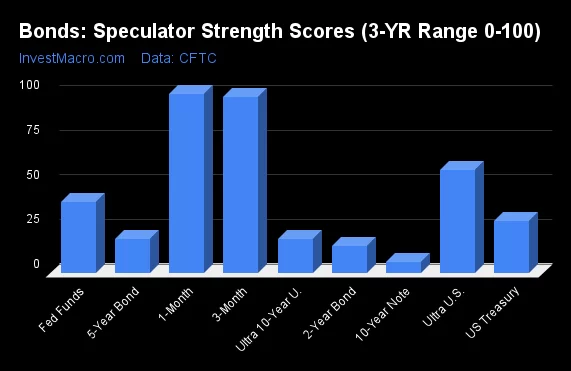
Strength Scores led by Mexican Peso & British Pound
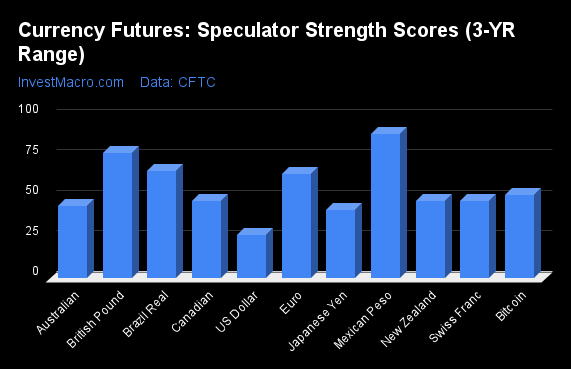
COT Strength Scores (a normalized measure of Speculator positions over a 3-Year range, from 0 to 100 where above 80 is Extreme-Bullish and below 20 is Extreme-Bearish) showed that the Mexican Peso (89 percent) and the British Pound (77 percent) lead the currency markets this week. The Brazilian Real (67 percent), EuroFX (65 percent) and Bitcoin (51 percent) come in as the next highest in the weekly strength scores.
On the downside, the US Dollar Index (27 percent) and the Japanese Yen (42 percent) come in at the lowest strength levels currently.
Strength Statistics:
US Dollar Index (27.0 percent) vs US Dollar Index previous week (29.6 percent)
EuroFX (64.6 percent) vs EuroFX previous week (70.9 percent)
British Pound Sterling (77.2 percent) vs British Pound Sterling previous week (70.2 percent)
Japanese Yen (42.1 percent) vs Japanese Yen previous week (42.4 percent)
Swiss Franc (47.9 percent) vs Swiss Franc previous week (46.1 percent)
Canadian Dollar (47.8 percent) vs Canadian Dollar previous week (52.9 percent)
Australian Dollar (44.9 percent) vs Australian Dollar previous week (59.2 percent)
New Zealand Dollar (47.9 percent) vs New Zealand Dollar previous week (50.8 percent)
Mexican Peso (88.9 percent) vs Mexican Peso previous week (93.1 percent)
Brazilian Real (66.5 percent) vs Brazilian Real previous week (67.1 percent)
Bitcoin (51.4 percent) vs Bitcoin previous week (42.1 percent)
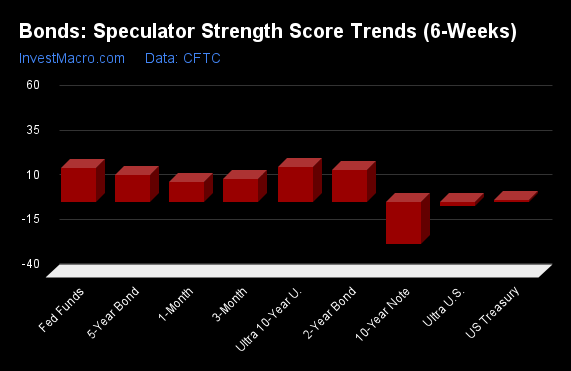
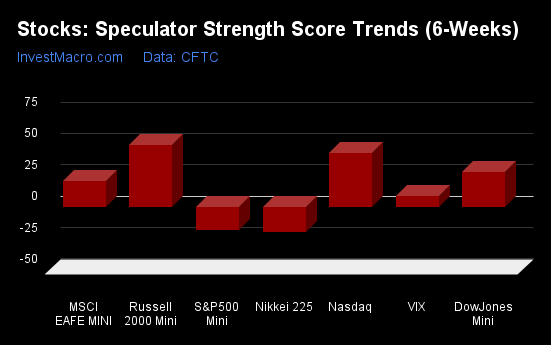
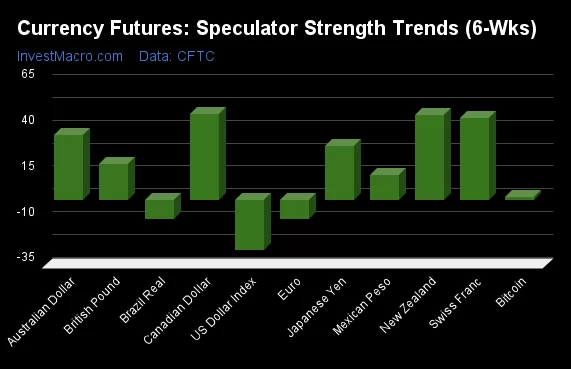
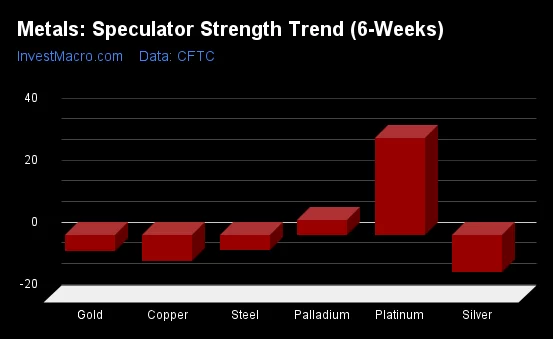
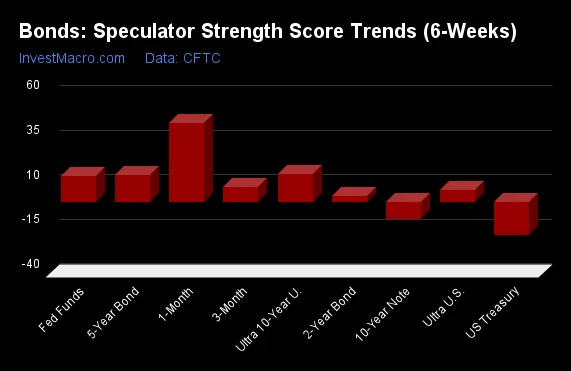
Swiss Franc & Canadian Dollar top the 6-Week Strength Trends
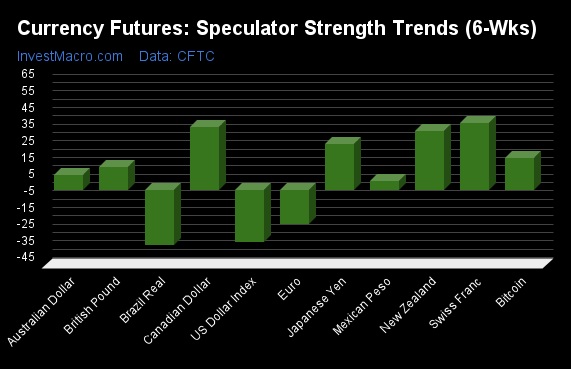
COT Strength Score Trends (or move index, calculates the 6-week changes in strength scores) showed that the Swiss Franc (40 percent) and the Canadian Dollar (37 percent) lead the past six weeks trends for the currencies. The New Zealand Dollar (35 percent), the Japanese Yen (28 percent) and Bitcoin (19 percent) are the next highest positive movers in the latest trends data.
The Brazilian Real (-33 percent) leads the downside trend scores currently with the US Dollar Index (-31 percent) and the EuroFX (-21 percent) following next with lower trend scores.
Strength Trend Statistics:
US Dollar Index (-31.2 percent) vs US Dollar Index previous week (-27.0 percent)
EuroFX (-20.6 percent) vs EuroFX previous week (-10.3 percent)
British Pound Sterling (13.4 percent) vs British Pound Sterling previous week (19.9 percent)
Japanese Yen (27.6 percent) vs Japanese Yen previous week (30.4 percent)
Swiss Franc (40.0 percent) vs Swiss Franc previous week (45.0 percent)
Canadian Dollar (37.3 percent) vs Canadian Dollar previous week (46.9 percent)
Australian Dollar (9.0 percent) vs Australian Dollar previous week (35.7 percent)
New Zealand Dollar (35.3 percent) vs New Zealand Dollar previous week (46.5 percent)
Mexican Peso (5.0 percent) vs Mexican Peso previous week (14.0 percent)
Brazilian Real (-33.1 percent) vs Brazilian Real previous week (-10.1 percent)
Bitcoin (18.9 percent) vs Bitcoin previous week (1.9 percent)
Individual COT Forex Markets:
US Dollar Index Futures:
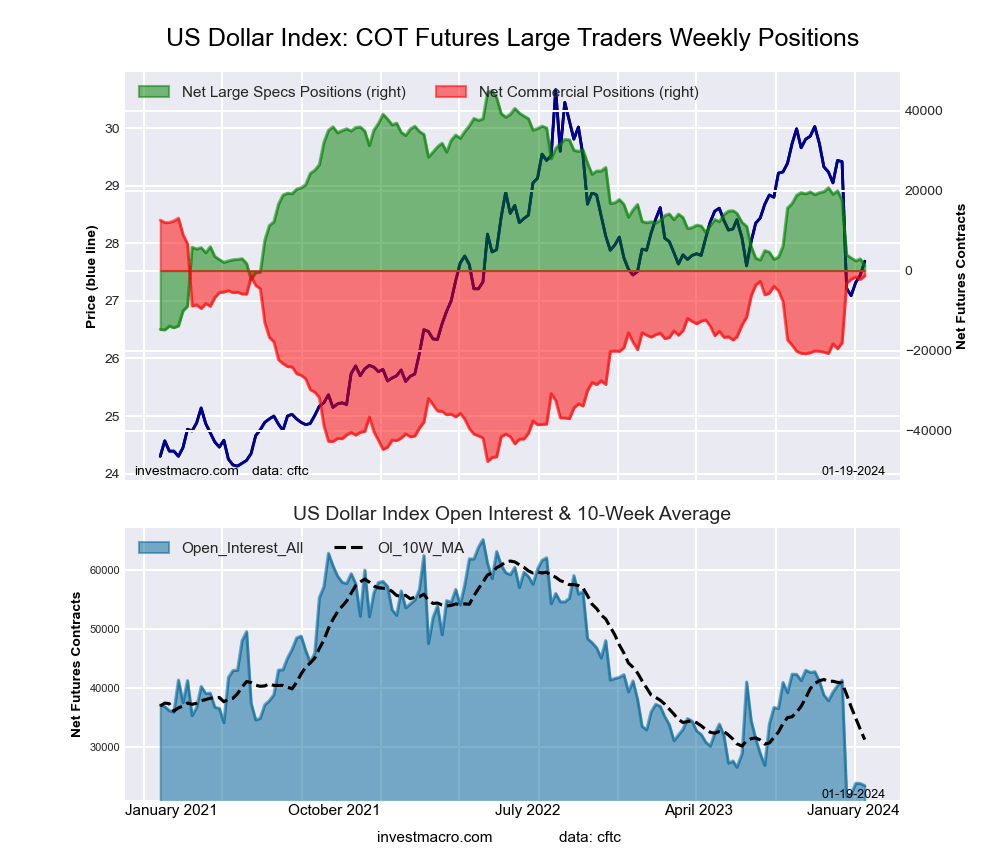 The US Dollar Index large speculator standing this week came in at a net position of 1,300 contracts in the data reported through Tuesday. This was a weekly lowering of -1,610 contracts from the previous week which had a total of 2,910 net contracts.
This week’s current strength score (the trader positioning range over the past three years, measured from 0 to 100) shows the speculators are currently Bearish with a score of 27.0 percent. The commercials are Bullish with a score of 76.3 percent and the small traders (not shown in chart) are Bearish-Extreme with a score of 11.1 percent.
Price Trend-Following Model: Strong Downtrend
Our weekly trend-following model classifies the current market price position as: Strong Downtrend. The current action for the model is considered to be: Hold – Maintain Short Position.
| US DOLLAR INDEX Statistics | SPECULATORS | COMMERCIALS | SMALL TRADERS |
| – Percent of Open Interest Longs: | 64.2 | 16.7 | 11.8 |
| – Percent of Open Interest Shorts: | 58.6 | 22.2 | 11.9 |
| – Net Position: | 1,300 | -1,292 | -8 |
| – Gross Longs: | 15,077 | 3,918 | 2,781 |
| – Gross Shorts: | 13,777 | 5,210 | 2,789 |
| – Long to Short Ratio: | 1.1 to 1 | 0.8 to 1 | 1.0 to 1 |
| NET POSITION TREND: | | | |
| – Strength Index Score (3 Year Range Pct): | 27.0 | 76.3 | 11.1 |
| – Strength Index Reading (3 Year Range): | Bearish | Bullish | Bearish-Extreme |
| NET POSITION MOVEMENT INDEX: | | | |
| – 6-Week Change in Strength Index: | -31.2 | 30.0 | 4.4 |
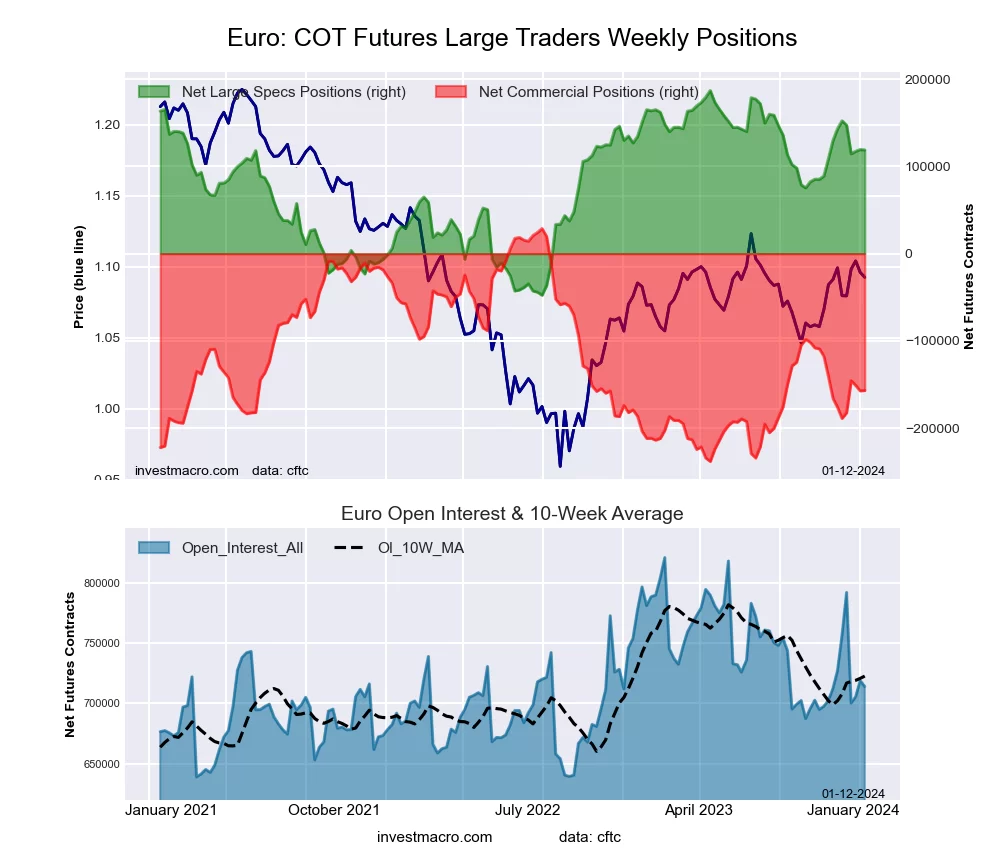
Euro Currency Futures:
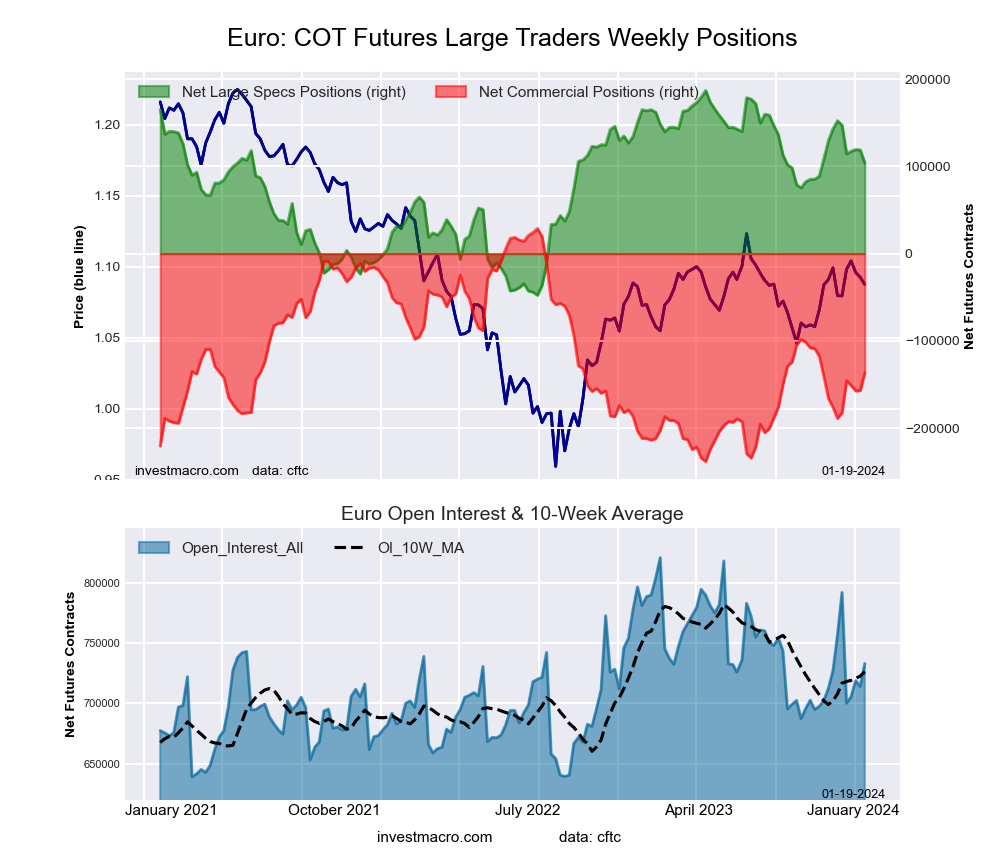 The Euro Currency large speculator standing this week came in at a net position of 104,092 contracts in the data reported through Tuesday. This was a weekly lowering of -14,785 contracts from the previous week which had a total of 118,877 net contracts.
This week’s current strength score (the trader positioning range over the past three years, measured from 0 to 100) shows the speculators are currently Bullish with a score of 64.6 percent. The commercials are Bearish with a score of 38.1 percent and the small traders (not shown in chart) are Bearish with a score of 30.7 percent.
Price Trend-Following Model: Uptrend
Our weekly trend-following model classifies the current market price position as: Uptrend. The current action for the model is considered to be: Hold – Maintain Long Position.
| EURO Currency Statistics | SPECULATORS | COMMERCIALS | SMALL TRADERS |
| – Percent of Open Interest Longs: | 27.9 | 59.1 | 11.1 |
| – Percent of Open Interest Shorts: | 13.7 | 77.8 | 6.6 |
| – Net Position: | 104,092 | -136,513 | 32,421 |
| – Gross Longs: | 204,294 | 433,577 | 81,115 |
| – Gross Shorts: | 100,202 | 570,090 | 48,694 |
| – Long to Short Ratio: | 2.0 to 1 | 0.8 to 1 | 1.7 to 1 |
| NET POSITION TREND: | | | |
| – Strength Index Score (3 Year Range Pct): | 64.6 | 38.1 | 30.7 |
| – Strength Index Reading (3 Year Range): | Bullish | Bearish | Bearish |
| NET POSITION MOVEMENT INDEX: | | | |
| – 6-Week Change in Strength Index: | -20.6 | 19.6 | -6.6 |
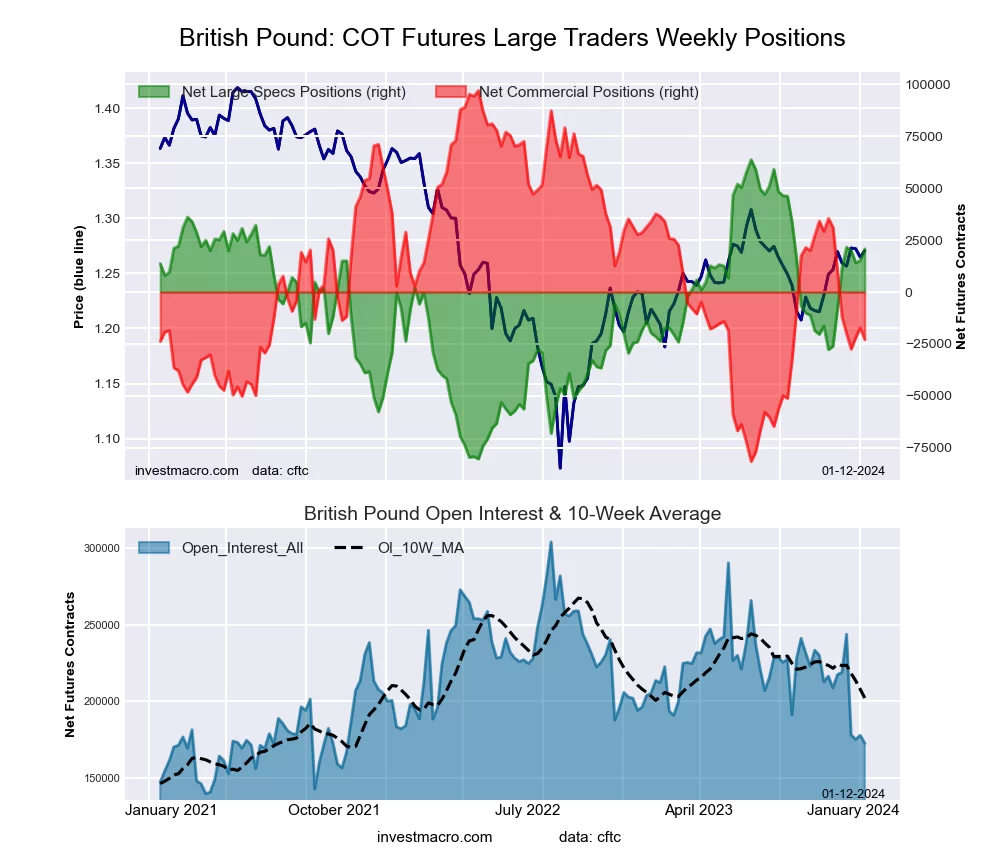
British Pound Sterling Futures:
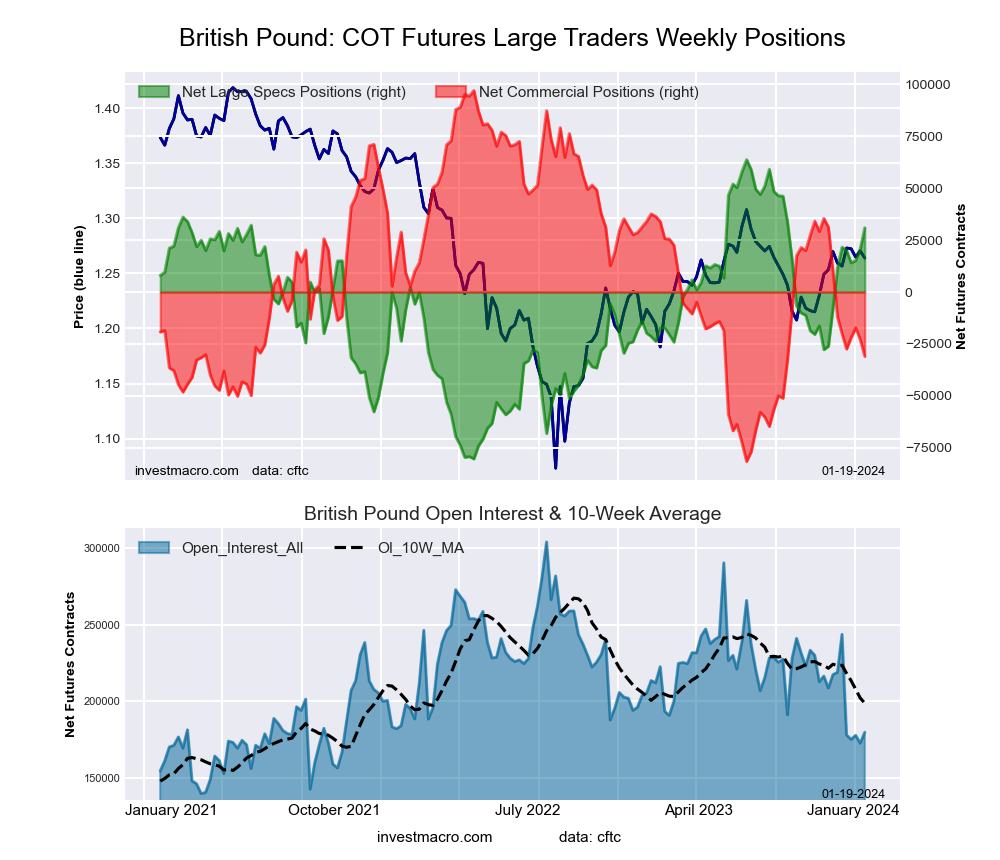 The British Pound Sterling large speculator standing this week came in at a net position of 30,931 contracts in the data reported through Tuesday. This was a weekly rise of 10,197 contracts from the previous week which had a total of 20,734 net contracts.
This week’s current strength score (the trader positioning range over the past three years, measured from 0 to 100) shows the speculators are currently Bullish with a score of 77.2 percent. The commercials are Bearish with a score of 28.3 percent and the small traders (not shown in chart) are Bullish with a score of 58.1 percent.
Price Trend-Following Model: Uptrend
Our weekly trend-following model classifies the current market price position as: Uptrend. The current action for the model is considered to be: Hold – Maintain Long Position.
| BRITISH POUND Statistics | SPECULATORS | COMMERCIALS | SMALL TRADERS |
| – Percent of Open Interest Longs: | 36.8 | 41.4 | 16.5 |
| – Percent of Open Interest Shorts: | 19.6 | 58.6 | 16.4 |
| – Net Position: | 30,931 | -30,980 | 49 |
| – Gross Longs: | 66,230 | 74,438 | 29,608 |
| – Gross Shorts: | 35,299 | 105,418 | 29,559 |
| – Long to Short Ratio: | 1.9 to 1 | 0.7 to 1 | 1.0 to 1 |
| NET POSITION TREND: | | | |
| – Strength Index Score (3 Year Range Pct): | 77.2 | 28.3 | 58.1 |
| – Strength Index Reading (3 Year Range): | Bullish | Bearish | Bullish |
| NET POSITION MOVEMENT INDEX: | | | |
| – 6-Week Change in Strength Index: | 13.4 | -10.6 | -0.5 |
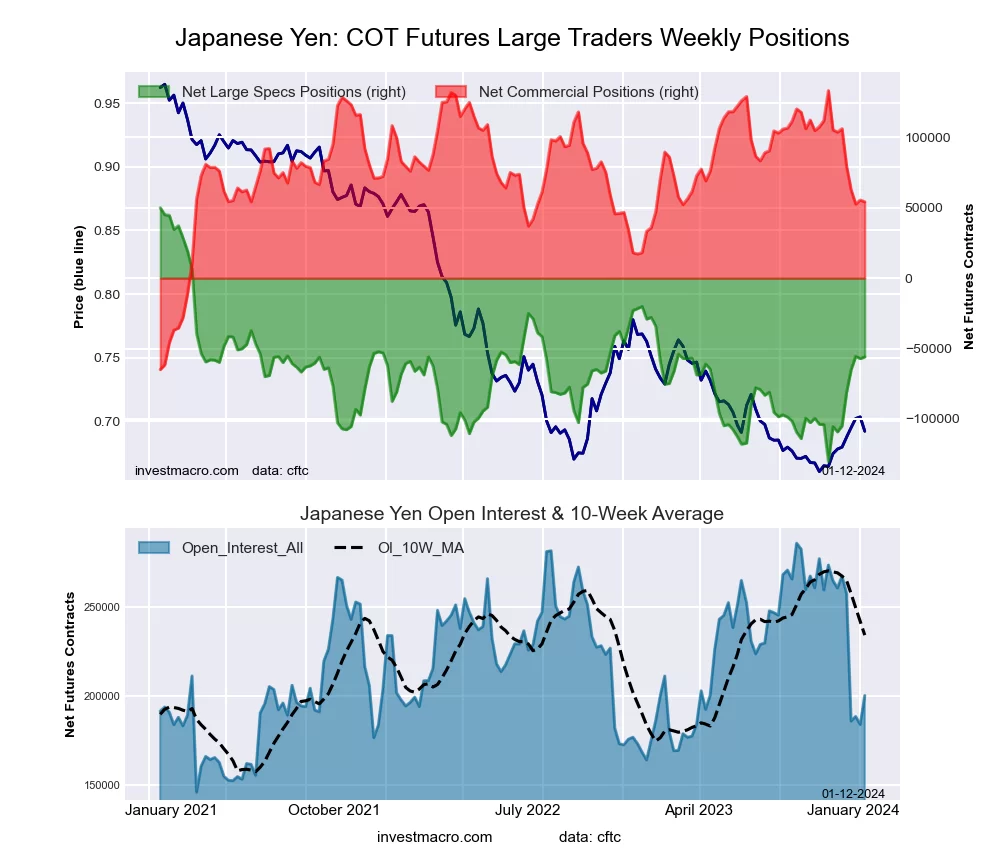
Japanese Yen Futures:
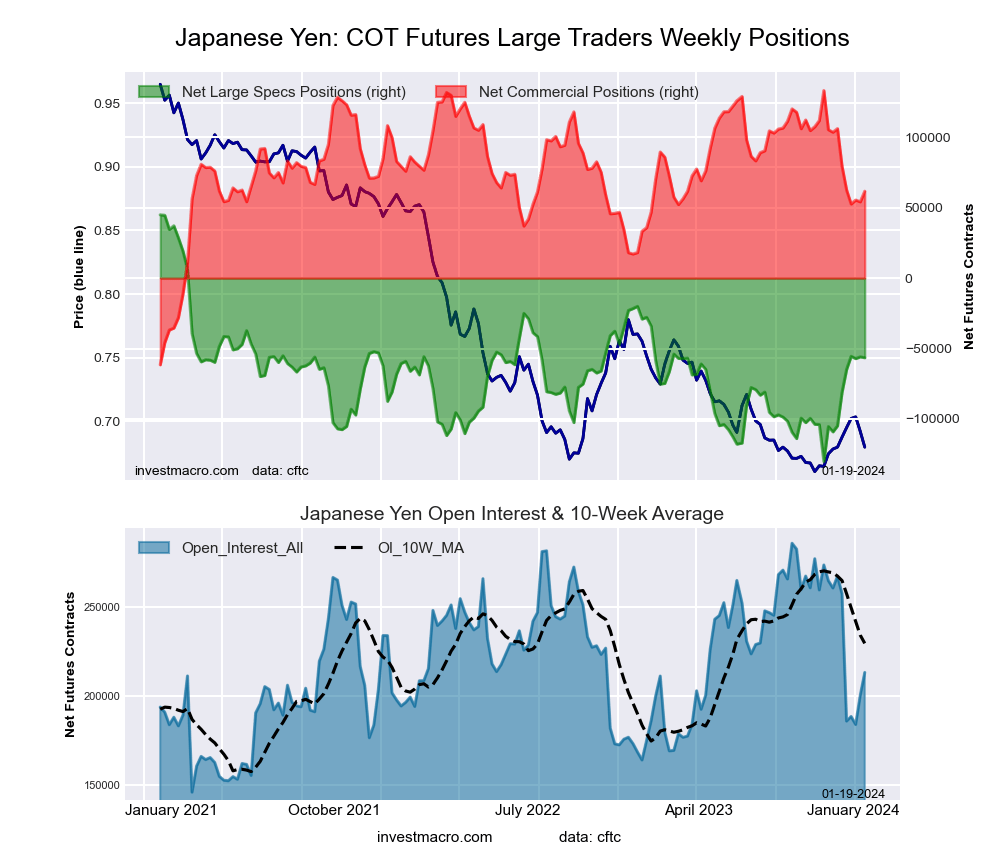 The Japanese Yen large speculator standing this week came in at a net position of -56,560 contracts in the data reported through Tuesday. This was a weekly lowering of -611 contracts from the previous week which had a total of -55,949 net contracts.
This week’s current strength score (the trader positioning range over the past three years, measured from 0 to 100) shows the speculators are currently Bearish with a score of 42.1 percent. The commercials are Bullish with a score of 63.3 percent and the small traders (not shown in chart) are Bearish with a score of 49.3 percent.
Price Trend-Following Model: Weak Uptrend
Our weekly trend-following model classifies the current market price position as: Weak Uptrend. The current action for the model is considered to be: Hold – Maintain Long Position.
| JAPANESE YEN Statistics | SPECULATORS | COMMERCIALS | SMALL TRADERS |
| – Percent of Open Interest Longs: | 20.7 | 58.6 | 18.0 |
| – Percent of Open Interest Shorts: | 47.2 | 29.7 | 20.4 |
| – Net Position: | -56,560 | 61,724 | -5,164 |
| – Gross Longs: | 44,180 | 125,048 | 38,443 |
| – Gross Shorts: | 100,740 | 63,324 | 43,607 |
| – Long to Short Ratio: | 0.4 to 1 | 2.0 to 1 | 0.9 to 1 |
| NET POSITION TREND: | | | |
| – Strength Index Score (3 Year Range Pct): | 42.1 | 63.3 | 49.3 |
| – Strength Index Reading (3 Year Range): | Bearish | Bullish | Bearish |
| NET POSITION MOVEMENT INDEX: | | | |
| – 6-Week Change in Strength Index: | 27.6 | -22.8 | -9.1 |
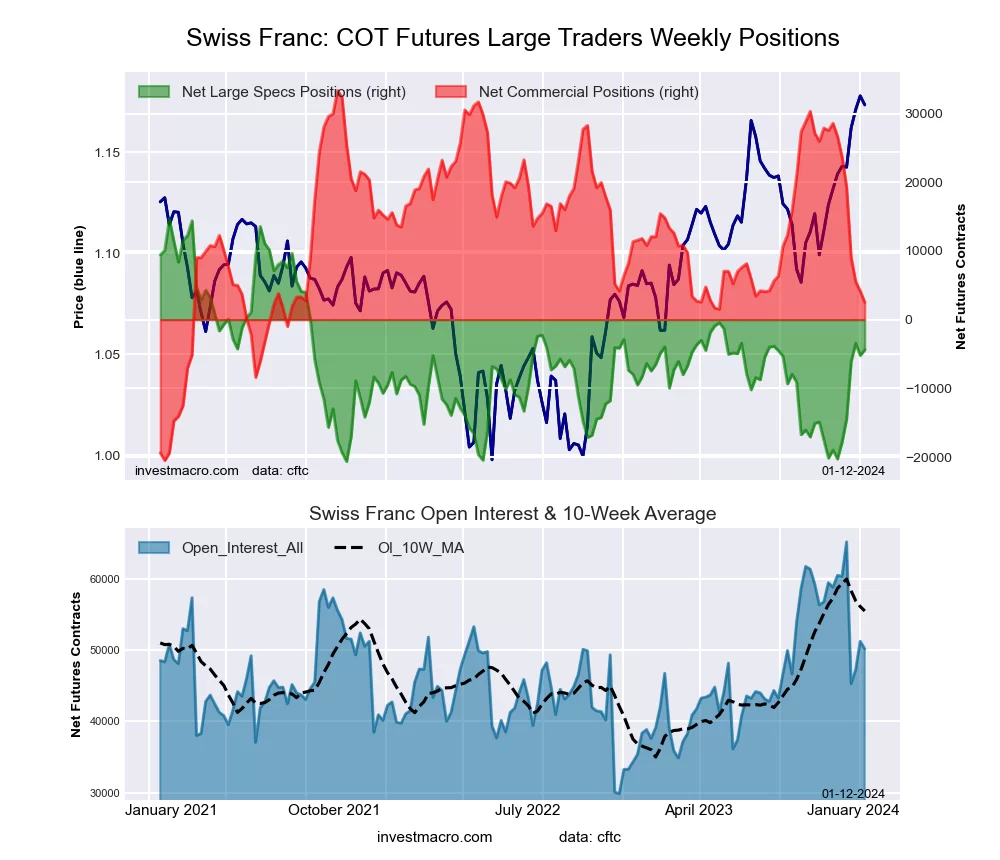
Swiss Franc Futures:
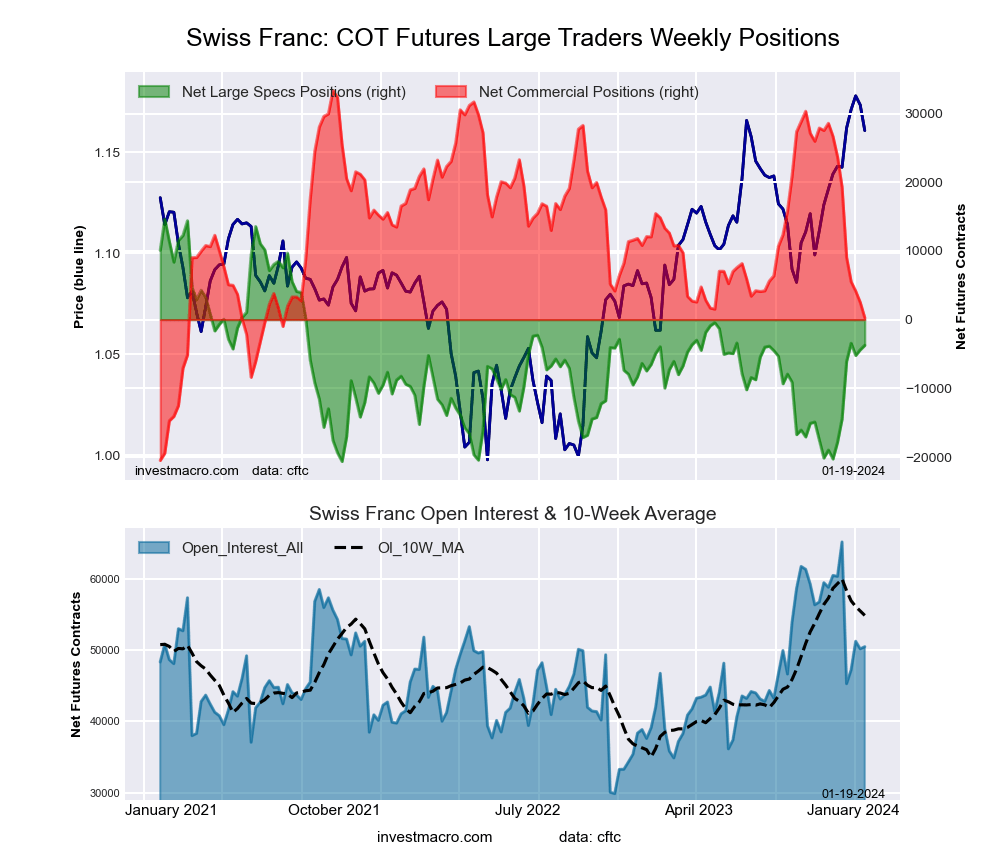 The Swiss Franc large speculator standing this week came in at a net position of -3,738 contracts in the data reported through Tuesday. This was a weekly lift of 654 contracts from the previous week which had a total of -4,392 net contracts.
This week’s current strength score (the trader positioning range over the past three years, measured from 0 to 100) shows the speculators are currently Bearish with a score of 47.9 percent. The commercials are Bearish with a score of 38.6 percent and the small traders (not shown in chart) are Bullish with a score of 74.6 percent.
Price Trend-Following Model: Uptrend
Our weekly trend-following model classifies the current market price position as: Uptrend. The current action for the model is considered to be: Hold – Maintain Long Position.
| SWISS FRANC Statistics | SPECULATORS | COMMERCIALS | SMALL TRADERS |
| – Percent of Open Interest Longs: | 21.1 | 44.5 | 33.9 |
| – Percent of Open Interest Shorts: | 28.5 | 43.9 | 27.0 |
| – Net Position: | -3,738 | 273 | 3,465 |
| – Gross Longs: | 10,627 | 22,450 | 17,114 |
| – Gross Shorts: | 14,365 | 22,177 | 13,649 |
| – Long to Short Ratio: | 0.7 to 1 | 1.0 to 1 | 1.3 to 1 |
| NET POSITION TREND: | | | |
| – Strength Index Score (3 Year Range Pct): | 47.9 | 38.6 | 74.6 |
| – Strength Index Reading (3 Year Range): | Bearish | Bearish | Bullish |
| NET POSITION MOVEMENT INDEX: | | | |
| – 6-Week Change in Strength Index: | 40.0 | -43.5 | 34.0 |
Canadian Dollar Futures:
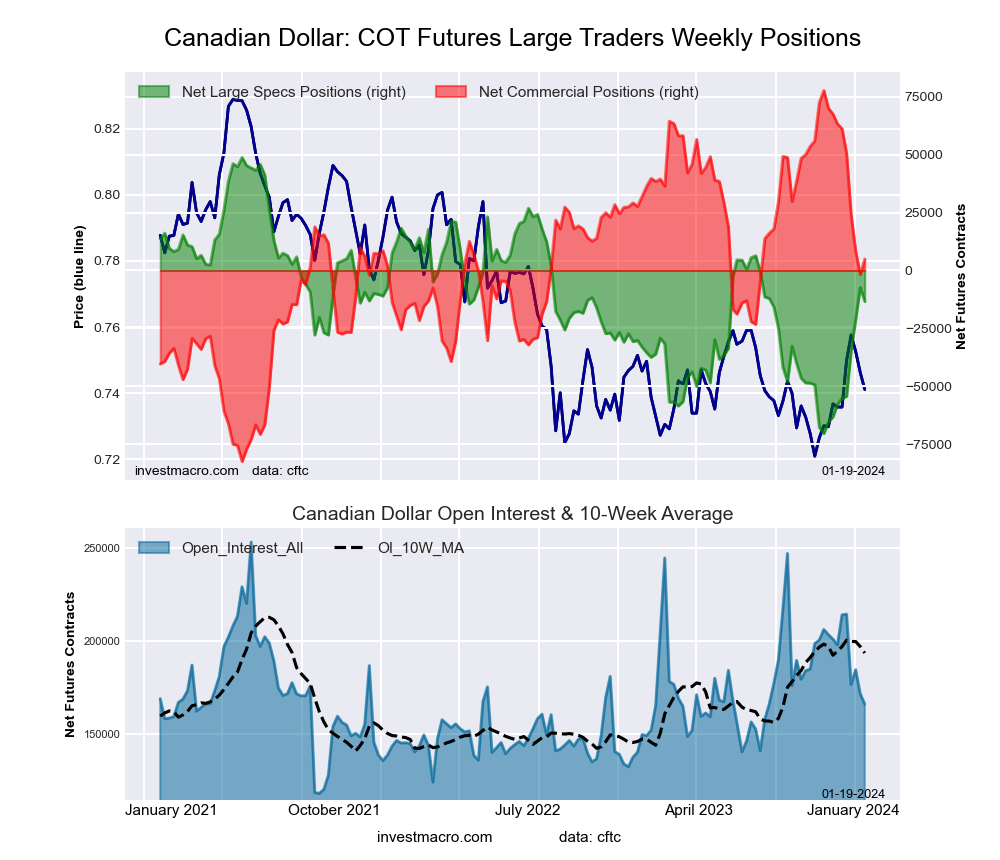 The Canadian Dollar large speculator standing this week came in at a net position of -13,388 contracts in the data reported through Tuesday. This was a weekly lowering of -6,008 contracts from the previous week which had a total of -7,380 net contracts.
This week’s current strength score (the trader positioning range over the past three years, measured from 0 to 100) shows the speculators are currently Bearish with a score of 47.8 percent. The commercials are Bullish with a score of 54.6 percent and the small traders (not shown in chart) are Bearish with a score of 41.6 percent.
Price Trend-Following Model: Uptrend
Our weekly trend-following model classifies the current market price position as: Uptrend. The current action for the model is considered to be: Hold – Maintain Long Position.
| CANADIAN DOLLAR Statistics | SPECULATORS | COMMERCIALS | SMALL TRADERS |
| – Percent of Open Interest Longs: | 23.3 | 55.3 | 19.8 |
| – Percent of Open Interest Shorts: | 31.4 | 52.3 | 14.7 |
| – Net Position: | -13,388 | 4,928 | 8,460 |
| – Gross Longs: | 38,738 | 91,783 | 32,870 |
| – Gross Shorts: | 52,126 | 86,855 | 24,410 |
| – Long to Short Ratio: | 0.7 to 1 | 1.1 to 1 | 1.3 to 1 |
| NET POSITION TREND: | | | |
| – Strength Index Score (3 Year Range Pct): | 47.8 | 54.6 | 41.6 |
| – Strength Index Reading (3 Year Range): | Bearish | Bullish | Bearish |
| NET POSITION MOVEMENT INDEX: | | | |
| – 6-Week Change in Strength Index: | 37.3 | -36.4 | 30.9 |
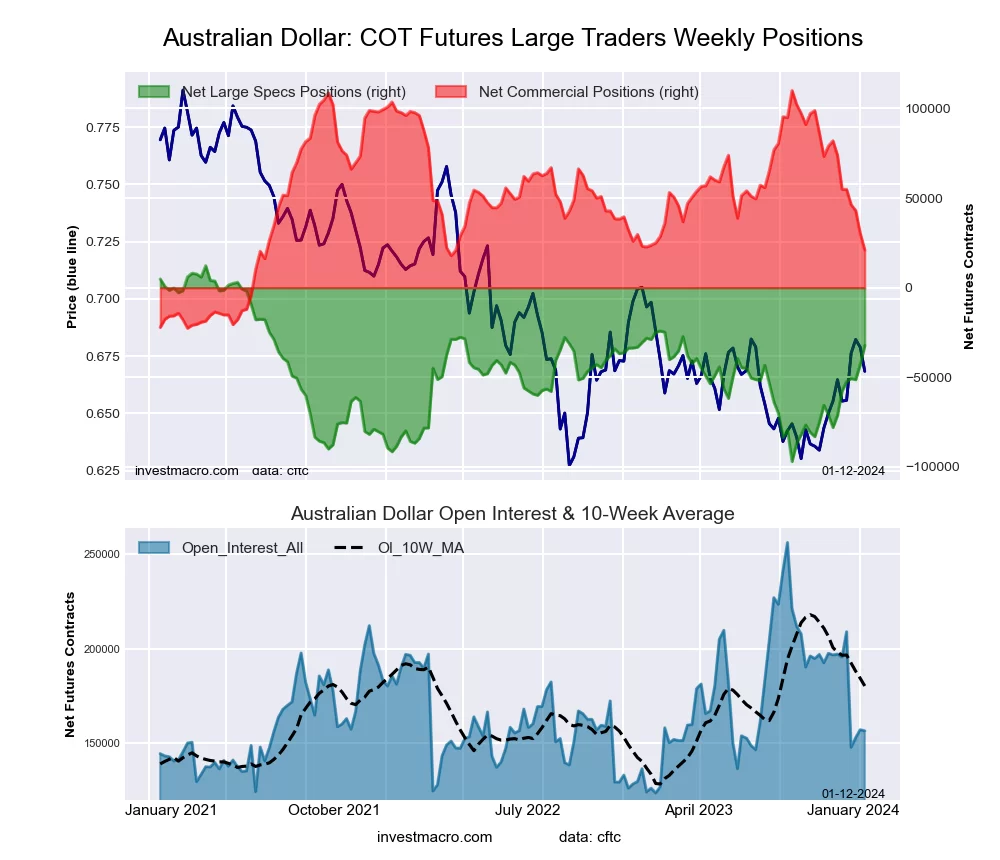
Australian Dollar Futures:
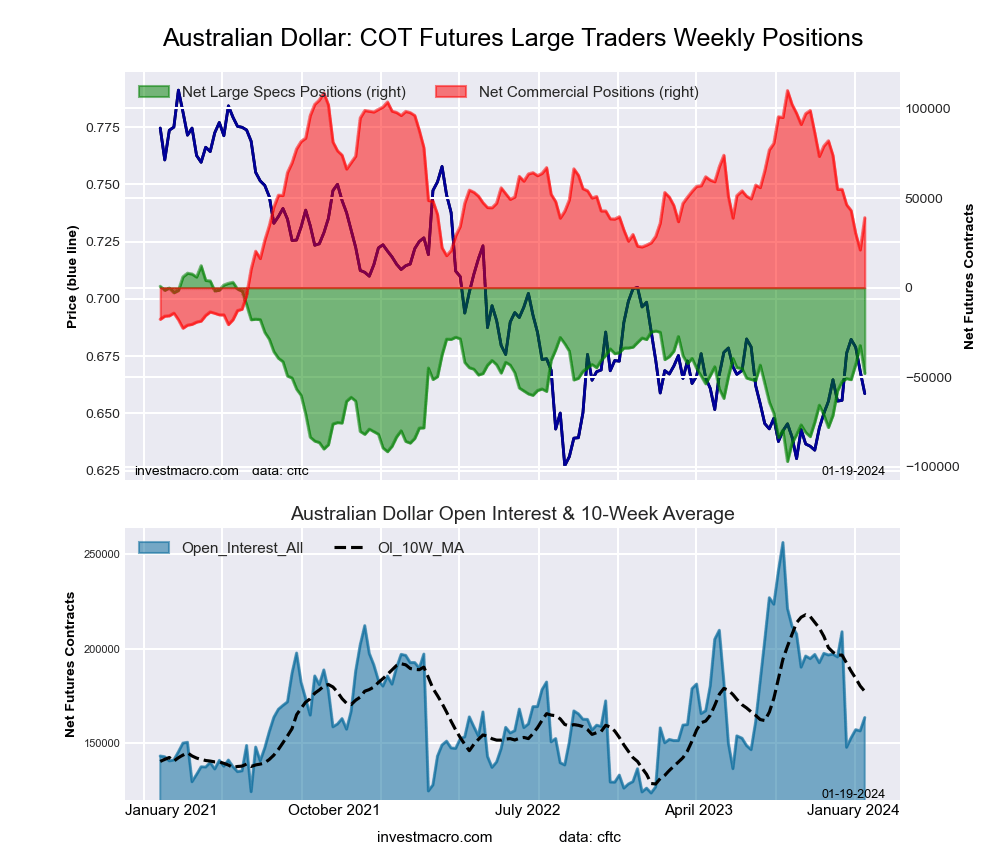 The Australian Dollar large speculator standing this week came in at a net position of -47,857 contracts in the data reported through Tuesday. This was a weekly decline of -15,583 contracts from the previous week which had a total of -32,274 net contracts.
This week’s current strength score (the trader positioning range over the past three years, measured from 0 to 100) shows the speculators are currently Bearish with a score of 44.9 percent. The commercials are Bearish with a score of 46.5 percent and the small traders (not shown in chart) are Bullish with a score of 73.9 percent.
Price Trend-Following Model: Uptrend
Our weekly trend-following model classifies the current market price position as: Uptrend. The current action for the model is considered to be: Hold – Maintain Long Position.
| AUSTRALIAN DOLLAR Statistics | SPECULATORS | COMMERCIALS | SMALL TRADERS |
| – Percent of Open Interest Longs: | 28.0 | 51.3 | 16.5 |
| – Percent of Open Interest Shorts: | 57.3 | 27.5 | 11.1 |
| – Net Position: | -47,857 | 39,044 | 8,813 |
| – Gross Longs: | 45,812 | 83,911 | 26,937 |
| – Gross Shorts: | 93,669 | 44,867 | 18,124 |
| – Long to Short Ratio: | 0.5 to 1 | 1.9 to 1 | 1.5 to 1 |
| NET POSITION TREND: | | | |
| – Strength Index Score (3 Year Range Pct): | 44.9 | 46.5 | 73.9 |
| – Strength Index Reading (3 Year Range): | Bearish | Bearish | Bullish |
| NET POSITION MOVEMENT INDEX: | | | |
| – 6-Week Change in Strength Index: | 9.0 | -12.0 | 14.7 |
New Zealand Dollar Futures:
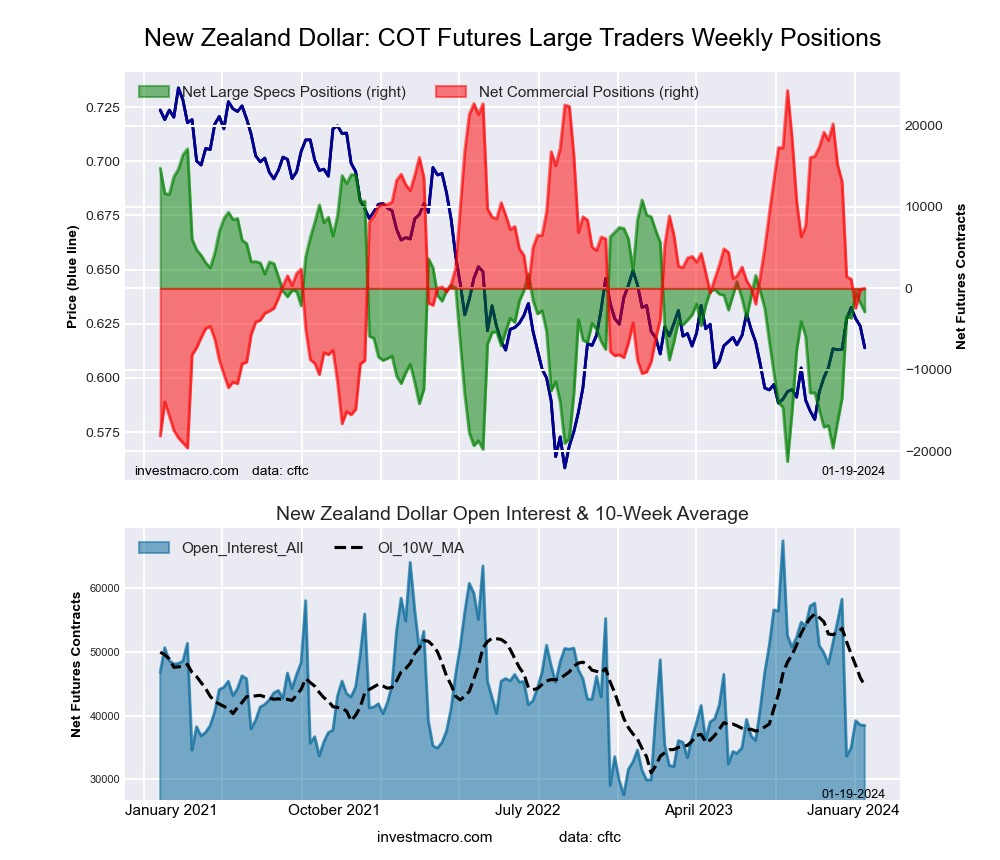 The New Zealand Dollar large speculator standing this week came in at a net position of -2,882 contracts in the data reported through Tuesday. This was a weekly fall of -1,115 contracts from the previous week which had a total of -1,767 net contracts.
This week’s current strength score (the trader positioning range over the past three years, measured from 0 to 100) shows the speculators are currently Bearish with a score of 47.9 percent. The commercials are Bearish with a score of 44.7 percent and the small traders (not shown in chart) are Bullish-Extreme with a score of 85.1 percent.
Price Trend-Following Model: Uptrend
Our weekly trend-following model classifies the current market price position as: Uptrend. The current action for the model is considered to be: Hold – Maintain Long Position.
| NEW ZEALAND DOLLAR Statistics | SPECULATORS | COMMERCIALS | SMALL TRADERS |
| – Percent of Open Interest Longs: | 37.9 | 42.1 | 15.8 |
| – Percent of Open Interest Shorts: | 45.4 | 42.1 | 8.3 |
| – Net Position: | -2,882 | -1 | 2,883 |
| – Gross Longs: | 14,592 | 16,203 | 6,094 |
| – Gross Shorts: | 17,474 | 16,204 | 3,211 |
| – Long to Short Ratio: | 0.8 to 1 | 1.0 to 1 | 1.9 to 1 |
| NET POSITION TREND: | | | |
| – Strength Index Score (3 Year Range Pct): | 47.9 | 44.7 | 85.1 |
| – Strength Index Reading (3 Year Range): | Bearish | Bearish | Bullish-Extreme |
| NET POSITION MOVEMENT INDEX: | | | |
| – 6-Week Change in Strength Index: | 35.3 | -34.7 | 19.8 |
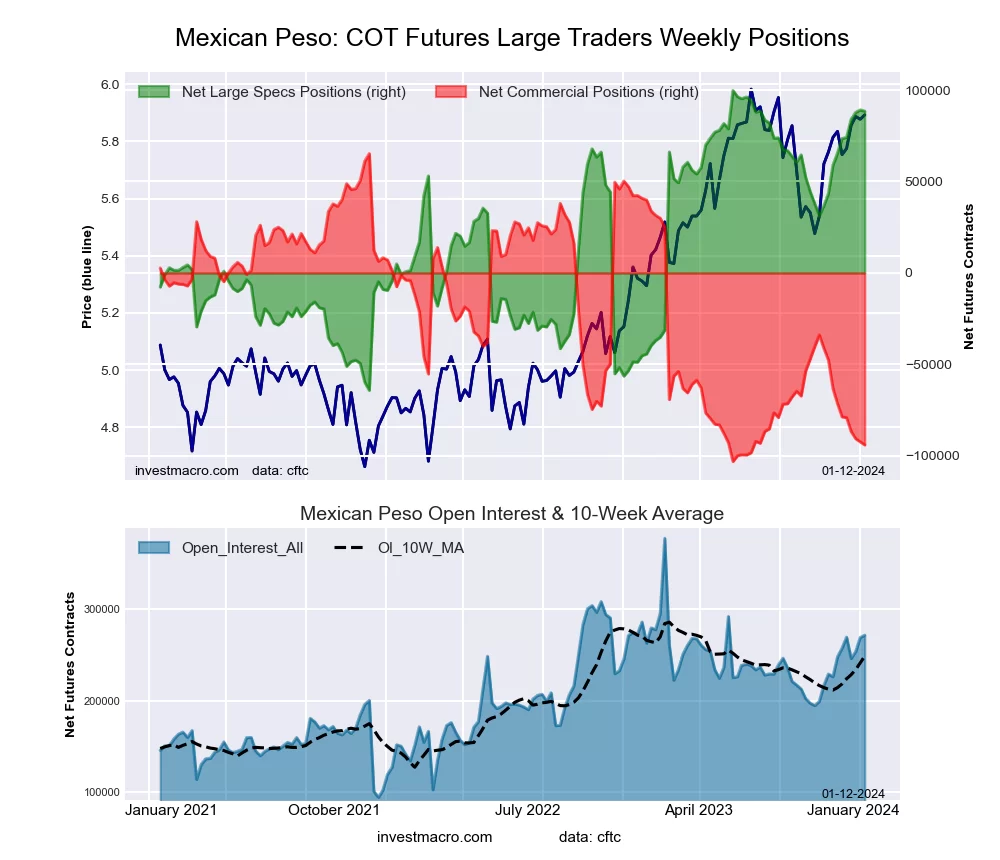
Mexican Peso Futures:
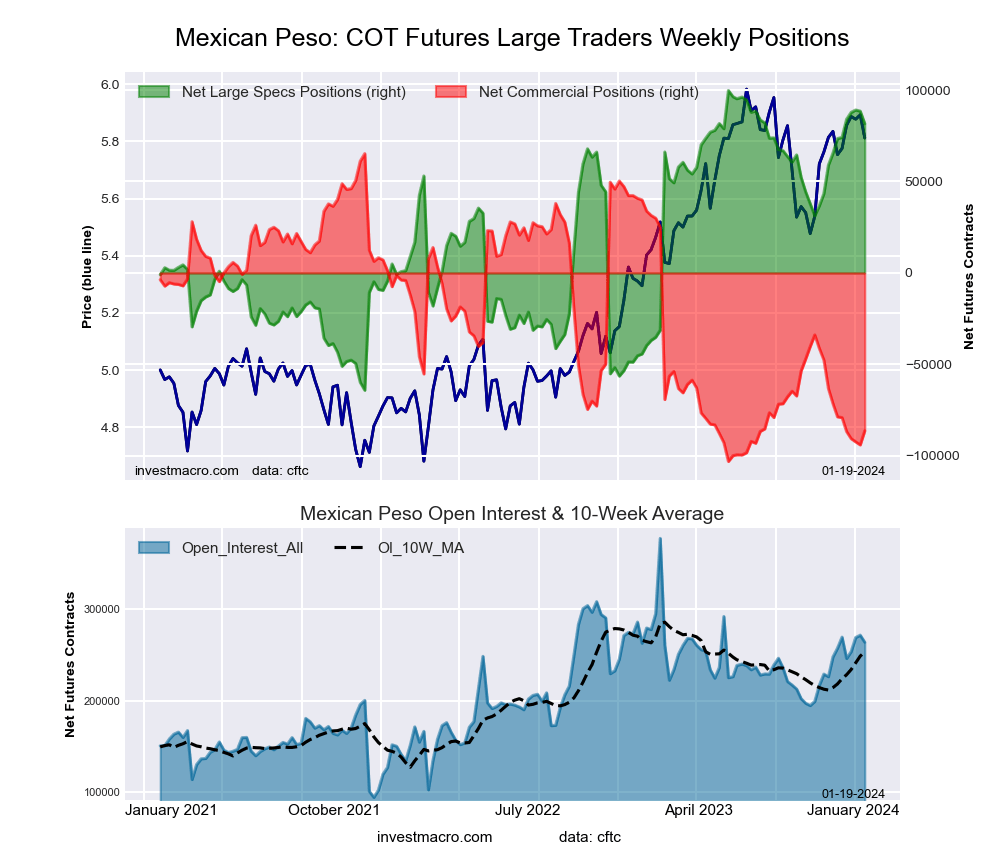 The Mexican Peso large speculator standing this week came in at a net position of 81,602 contracts in the data reported through Tuesday. This was a weekly decrease of -6,837 contracts from the previous week which had a total of 88,439 net contracts.
This week’s current strength score (the trader positioning range over the past three years, measured from 0 to 100) shows the speculators are currently Bullish-Extreme with a score of 88.9 percent. The commercials are Bearish-Extreme with a score of 10.0 percent and the small traders (not shown in chart) are Bearish with a score of 41.0 percent.
Price Trend-Following Model: Uptrend
Our weekly trend-following model classifies the current market price position as: Uptrend. The current action for the model is considered to be: Hold – Maintain Long Position.
| MEXICAN PESO Statistics | SPECULATORS | COMMERCIALS | SMALL TRADERS |
| – Percent of Open Interest Longs: | 50.7 | 43.7 | 2.9 |
| – Percent of Open Interest Shorts: | 19.8 | 76.4 | 1.1 |
| – Net Position: | 81,602 | -86,271 | 4,669 |
| – Gross Longs: | 133,691 | 115,050 | 7,623 |
| – Gross Shorts: | 52,089 | 201,321 | 2,954 |
| – Long to Short Ratio: | 2.6 to 1 | 0.6 to 1 | 2.6 to 1 |
| NET POSITION TREND: | | | |
| – Strength Index Score (3 Year Range Pct): | 88.9 | 10.0 | 41.0 |
| – Strength Index Reading (3 Year Range): | Bullish-Extreme | Bearish-Extreme | Bearish |
| NET POSITION MOVEMENT INDEX: | | | |
| – 6-Week Change in Strength Index: | 5.0 | -4.5 | -3.3 |
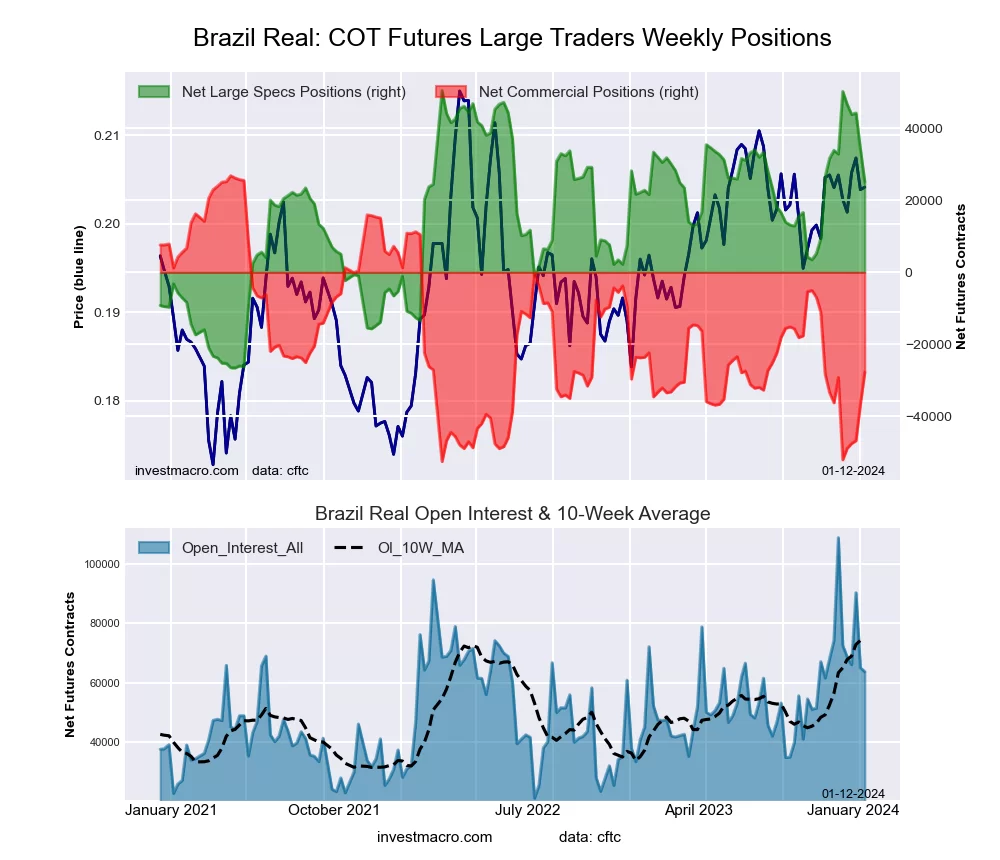
Brazilian Real Futures:
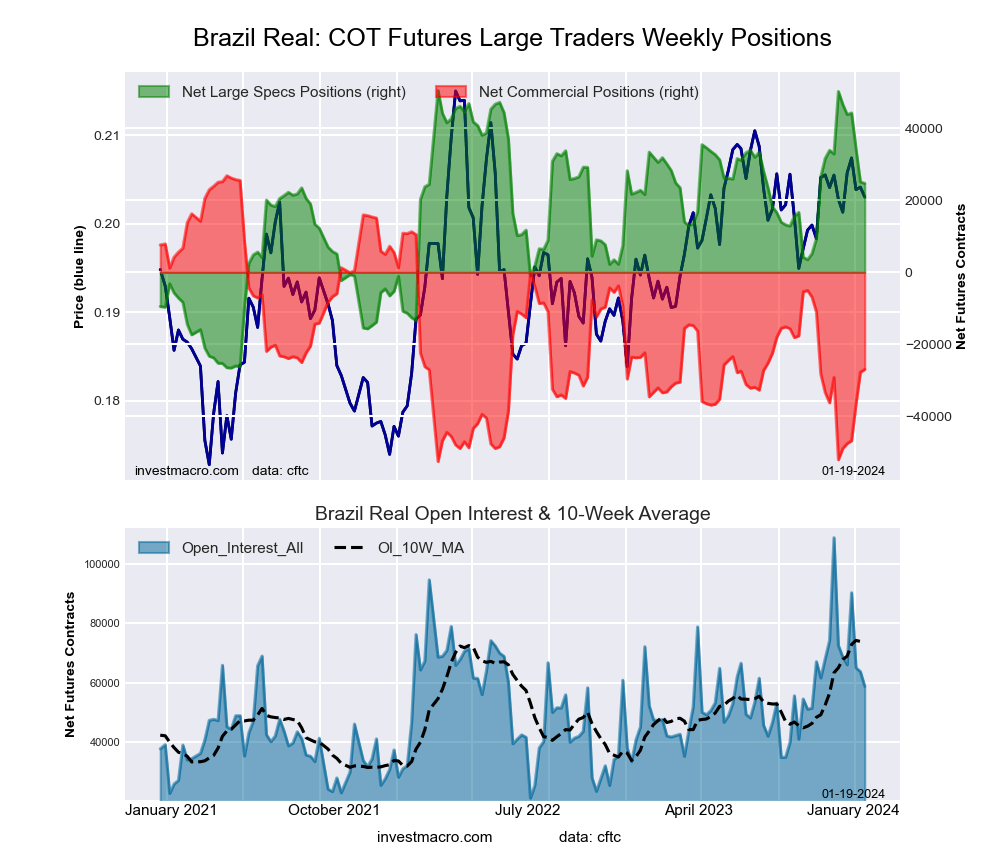 The Brazilian Real large speculator standing this week came in at a net position of 24,695 contracts in the data reported through Tuesday. This was a weekly lowering of -419 contracts from the previous week which had a total of 25,114 net contracts.
This week’s current strength score (the trader positioning range over the past three years, measured from 0 to 100) shows the speculators are currently Bullish with a score of 66.5 percent. The commercials are Bearish with a score of 32.2 percent and the small traders (not shown in chart) are Bullish with a score of 55.7 percent.
Price Trend-Following Model: Uptrend
Our weekly trend-following model classifies the current market price position as: Uptrend. The current action for the model is considered to be: Hold – Maintain Long Position.
| BRAZIL REAL Statistics | SPECULATORS | COMMERCIALS | SMALL TRADERS |
| – Percent of Open Interest Longs: | 67.1 | 24.9 | 6.3 |
| – Percent of Open Interest Shorts: | 25.1 | 70.8 | 2.5 |
| – Net Position: | 24,695 | -26,977 | 2,282 |
| – Gross Longs: | 39,441 | 14,622 | 3,731 |
| – Gross Shorts: | 14,746 | 41,599 | 1,449 |
| – Long to Short Ratio: | 2.7 to 1 | 0.4 to 1 | 2.6 to 1 |
| NET POSITION TREND: | | | |
| – Strength Index Score (3 Year Range Pct): | 66.5 | 32.2 | 55.7 |
| – Strength Index Reading (3 Year Range): | Bullish | Bearish | Bullish |
| NET POSITION MOVEMENT INDEX: | | | |
| – 6-Week Change in Strength Index: | -33.1 | 31.6 | 4.1 |
Bitcoin Futures:
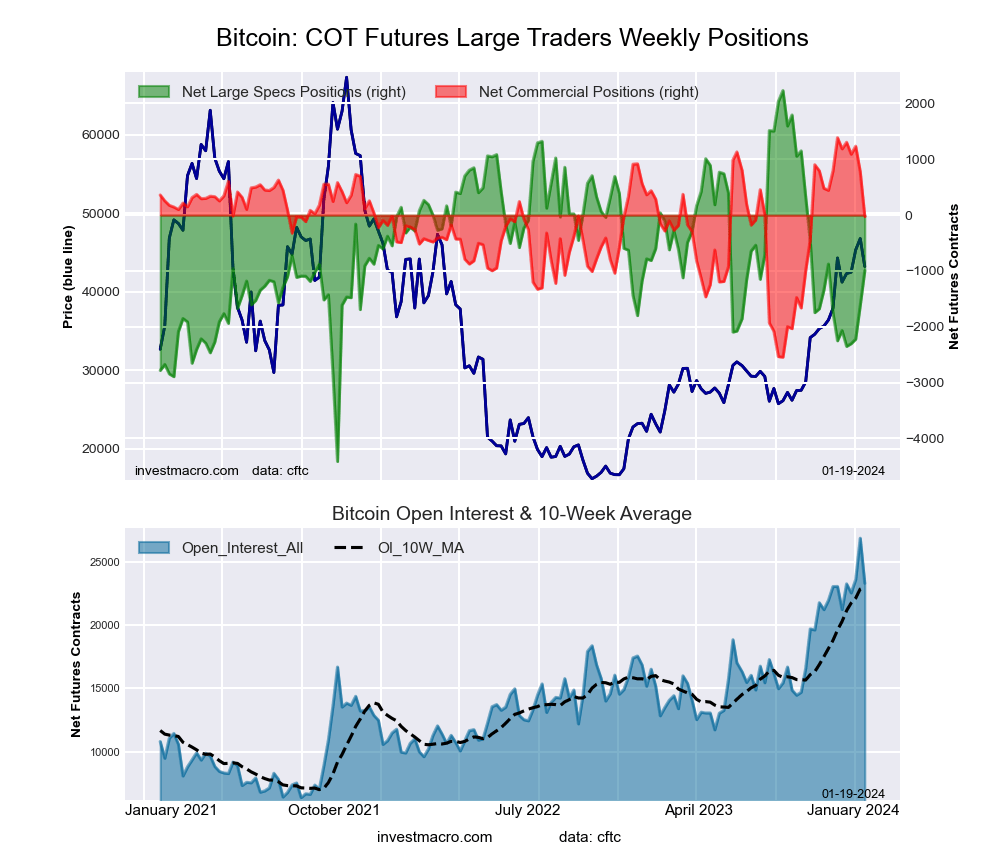 The Bitcoin large speculator standing this week came in at a net position of -994 contracts in the data reported through Tuesday. This was a weekly advance of 624 contracts from the previous week which had a total of -1,618 net contracts.
This week’s current strength score (the trader positioning range over the past three years, measured from 0 to 100) shows the speculators are currently Bullish with a score of 51.4 percent. The commercials are Bullish with a score of 64.1 percent and the small traders (not shown in chart) are Bearish with a score of 36.1 percent.
Price Trend-Following Model: Uptrend
Our weekly trend-following model classifies the current market price position as: Uptrend. The current action for the model is considered to be: Hold – Maintain Long Position.
| BITCOIN Statistics | SPECULATORS | COMMERCIALS | SMALL TRADERS |
| – Percent of Open Interest Longs: | 75.5 | 5.8 | 7.5 |
| – Percent of Open Interest Shorts: | 79.8 | 6.0 | 3.1 |
| – Net Position: | -994 | -25 | 1,019 |
| – Gross Longs: | 17,577 | 1,361 | 1,747 |
| – Gross Shorts: | 18,571 | 1,386 | 728 |
| – Long to Short Ratio: | 0.9 to 1 | 1.0 to 1 | 2.4 to 1 |
| NET POSITION TREND: | | | |
| – Strength Index Score (3 Year Range Pct): | 51.4 | 64.1 | 36.1 |
| – Strength Index Reading (3 Year Range): | Bullish | Bullish | Bearish |
| NET POSITION MOVEMENT INDEX: | | | |
| – 6-Week Change in Strength Index: | 18.9 | -35.9 | 3.5 |
Article By InvestMacro – Receive our weekly COT Newsletter
*COT Report: The COT data, released weekly to the public each Friday, is updated through the most recent Tuesday (data is 3 days old) and shows a quick view of how large speculators or non-commercials (for-profit traders) were positioned in the futures markets.
The CFTC categorizes trader positions according to commercial hedgers (traders who use futures contracts for hedging as part of the business), non-commercials (large traders who speculate to realize trading profits) and nonreportable traders (usually small traders/speculators) as well as their open interest (contracts open in the market at time of reporting). See CFTC criteria here.