By InvestMacro
Here are the latest charts and statistics for the Commitment of Traders (COT) reports data published by the Commodities Futures Trading Commission (CFTC).
The latest COT data is updated through Tuesday February 13th and shows a quick view of how large traders (for-profit speculators and commercial hedgers) were positioned in the futures markets.
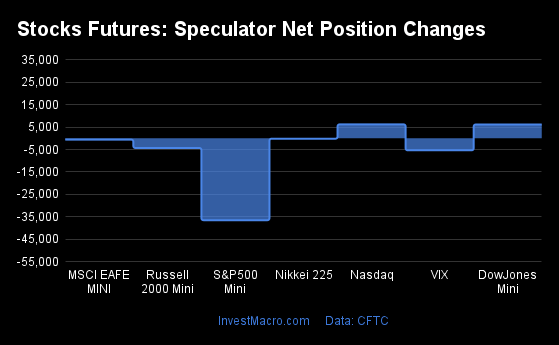
Weekly Speculator Changes led by 2-Year Bonds & 10-Year Bonds
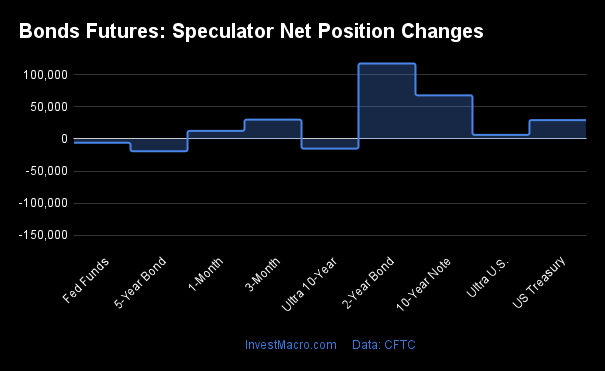
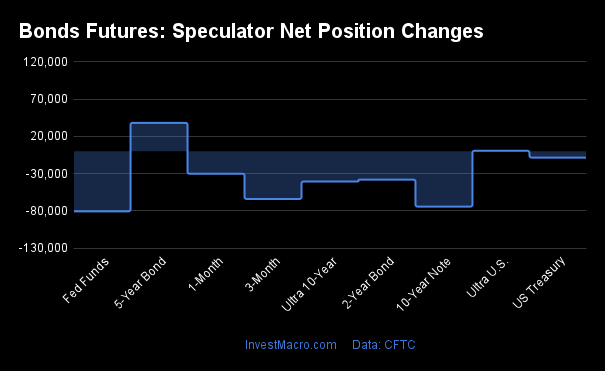
The COT bond market speculator bets were higher this week as five out of the eight bond markets we cover had higher positioning while the other three markets had lower speculator contracts.
Leading the gains for the bond markets was the 2-Year Bonds (117,595 contracts) with the 10-Year Bonds (67,943 contracts), the SOFR 3-Months (30,099 contracts), the US Treasury Bonds (29,415 contracts) and the Ultra Treasury Bonds (6,328 contracts) also showing positive weeks.
The bond markets with declines in speculator bets for the week were the 5-Year Bonds (-19,126 contracts), the Ultra 10-Year Bonds (-15,056 contracts) and the Fed Funds (-6,021 contracts) also registering lower bets on the week.
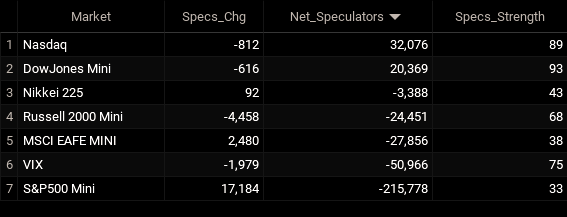
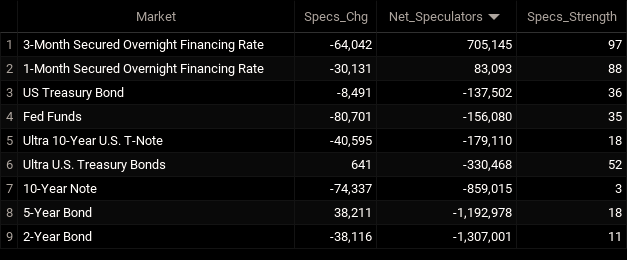
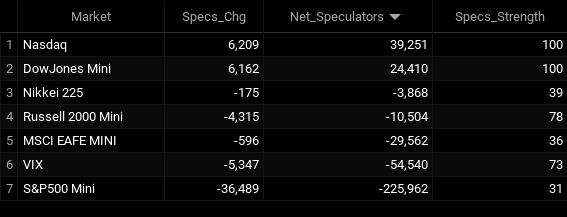
Speculators Leaderboard
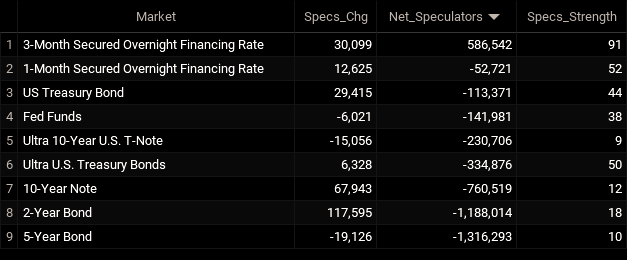
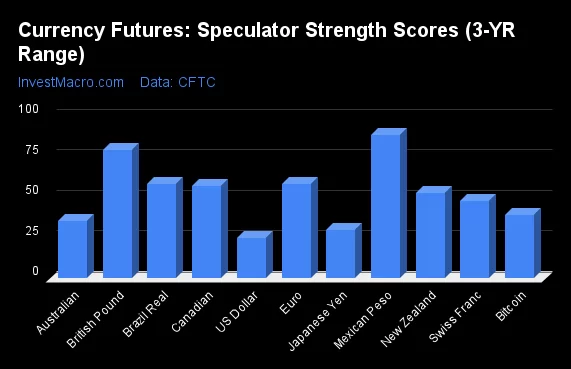
Legend: Weekly Speculators Change | Speculators Current Net Position | Speculators Strength Score compared to last 3-Years (0-100 range)
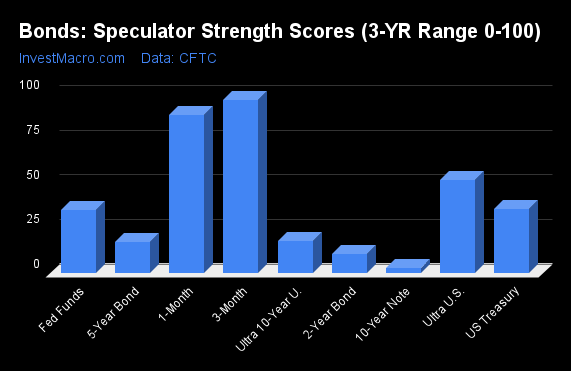
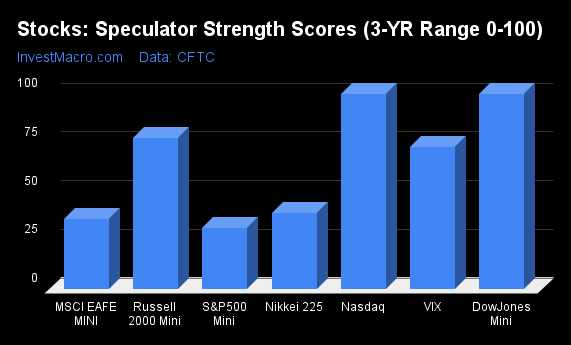
Strength Scores led by SOFR 3-Months & Ultra Treasury Bonds
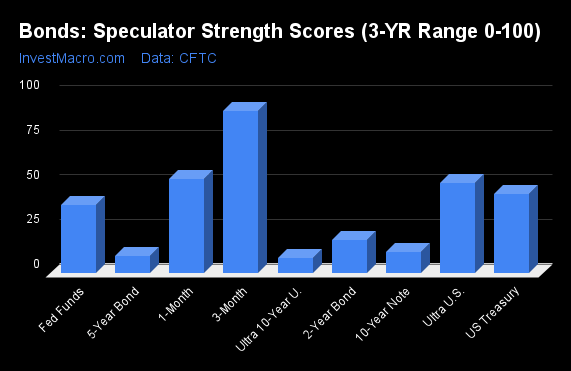
COT Strength Scores (a normalized measure of Speculator positions over a 3-Year range, from 0 to 100 where above 80 is Extreme-Bullish and below 20 is Extreme-Bearish) showed that the SOFR 3-Months (91 percent) and the Ultra Treasury Bonds (50 percent) lead the bond markets this week. The US Treasury Bonds (44 percent) comes in as the next highest in the weekly strength scores.
On the downside, the Ultra 10-Year Bonds (9 percent), the 5-Year Bonds (10 percent), the 10-Year Bonds (12 percent) and the 2-Year Bonds (18 percent) come in at the lowest strength level currently and are in Extreme-Bearish territory (below 20 percent).
Strength Statistics:
Fed Funds (38.2 percent) vs Fed Funds previous week (39.5 percent)
2-Year Bond (18.4 percent) vs 2-Year Bond previous week (10.9 percent)
5-Year Bond (9.7 percent) vs 5-Year Bond previous week (11.0 percent)
10-Year Bond (12.0 percent) vs 10-Year Bond previous week (5.7 percent)
Ultra 10-Year Bond (8.6 percent) vs Ultra 10-Year Bond previous week (11.3 percent)
US Treasury Bond (44.0 percent) vs US Treasury Bond previous week (33.7 percent)
Ultra US Treasury Bond (50.4 percent) vs Ultra US Treasury Bond previous week (47.7 percent)
SOFR 3-Months (90.6 percent) vs SOFR 3-Months previous week (89.0 percent)
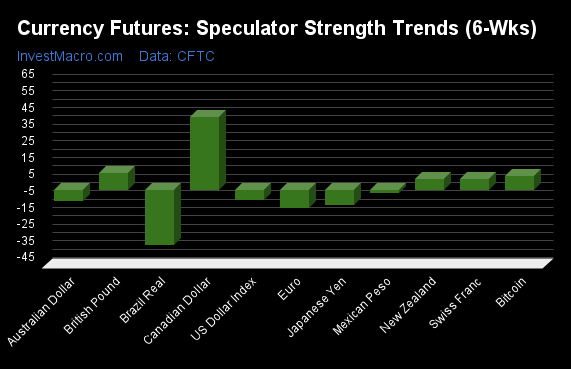
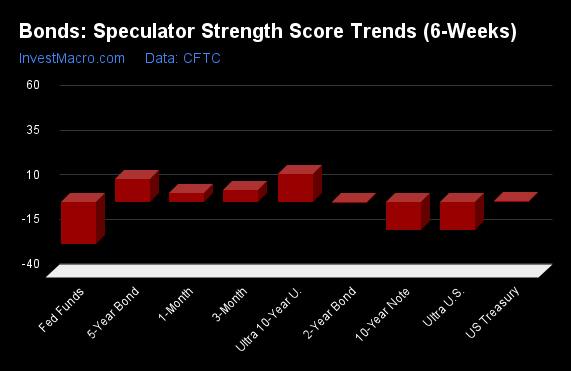
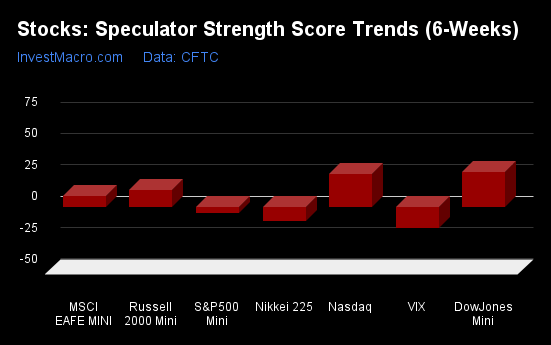
US Treasury Bonds & 10-Year Bonds top the 6-Week Strength Trends
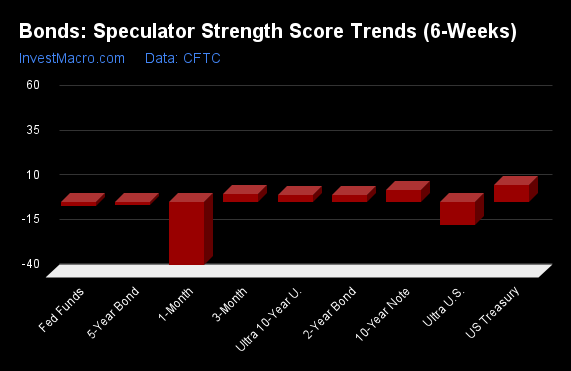
COT Strength Score Trends (or move index, calculates the 6-week changes in strength scores) showed that the US Treasury Bonds (9 percent) and the 10-Year Bonds (7 percent) lead the past six weeks trends for bonds. The 2-Year Bonds (4 percent) is the next highest positive mover in the latest trends data.
The Ultra Treasury Bonds (-13 percent) leads the downside trend scores currently with the Fed Funds (-2 percent) and the 5-Year Bonds (-2 percent) following next with lower trend scores.
Strength Trend Statistics:
Fed Funds (-2.3 percent) vs Fed Funds previous week (-5.5 percent)
2-Year Bond (3.5 percent) vs 2-Year Bond previous week (-2.6 percent)
5-Year Bond (-1.7 percent) vs 5-Year Bond previous week (1.0 percent)
10-Year Bond (6.7 percent) vs 10-Year Bond previous week (-2.2 percent)
Ultra 10-Year Bond (3.4 percent) vs Ultra 10-Year Bond previous week (11.3 percent)
US Treasury Bond (9.5 percent) vs US Treasury Bond previous week (0.3 percent)
Ultra US Treasury Bond (-13.3 percent) vs Ultra US Treasury Bond previous week (-20.8 percent)
SOFR 3-Months (4.2 percent) vs SOFR 3-Months previous week (-2.5 percent)
Secured Overnight Financing Rate (3-Month) Futures:
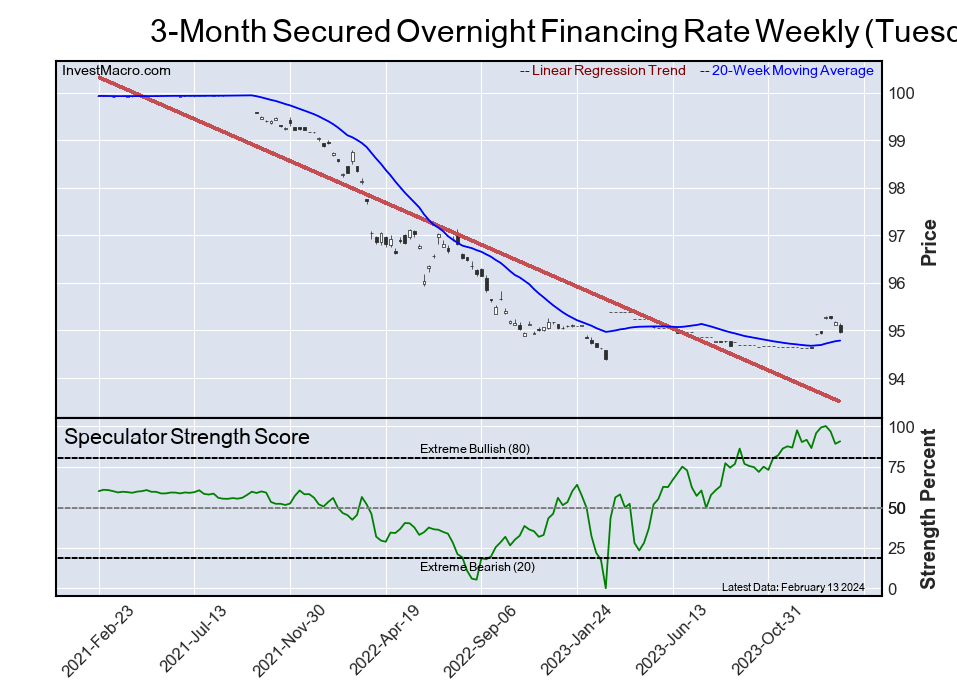
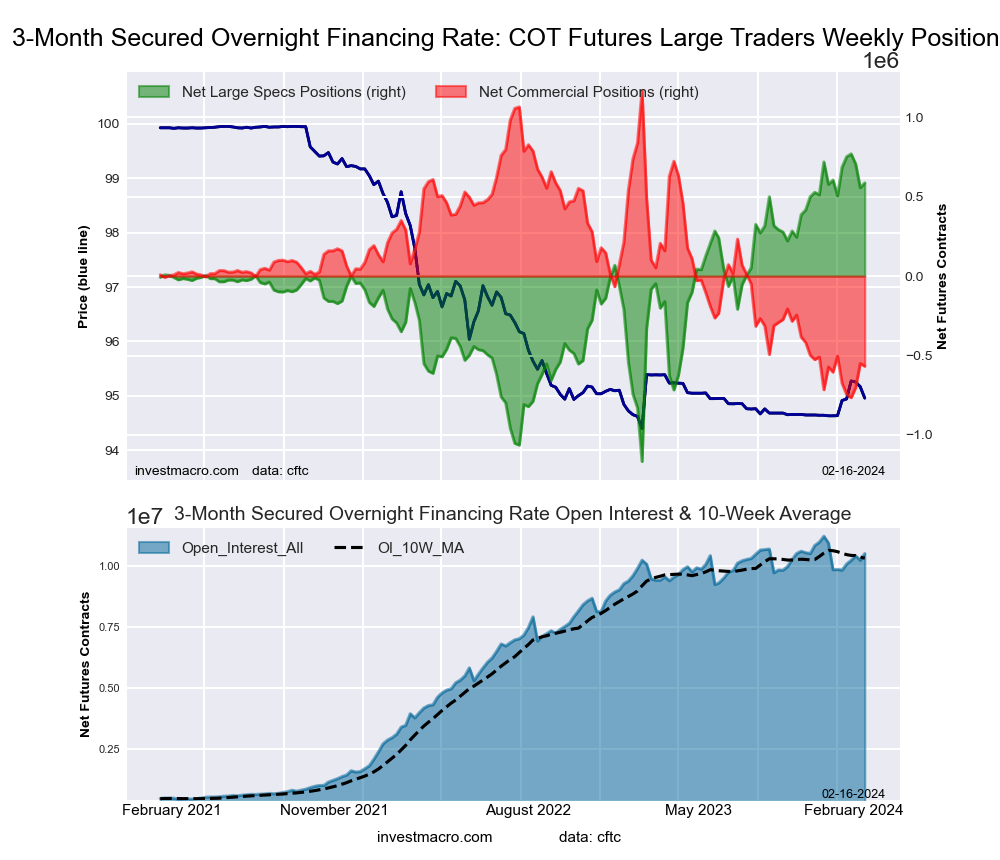 The Secured Overnight Financing Rate (3-Month) large speculator standing this week was a net position of 586,542 contracts in the data reported through Tuesday. This was a weekly lift of 30,099 contracts from the previous week which had a total of 556,443 net contracts.
This week’s current strength score (the trader positioning range over the past three years, measured from 0 to 100) shows the speculators are currently Bullish-Extreme with a score of 90.6 percent. The commercials are Bearish-Extreme with a score of 10.2 percent and the small traders (not shown in chart) are Bullish with a score of 77.2 percent.
Price Trend-Following Model: Weak Uptrend
Our weekly trend-following model classifies the current market price position as: Weak Uptrend. The current action for the model is considered to be: Hold – Maintain Long Position.
| SOFR 3-Months Statistics | SPECULATORS | COMMERCIALS | SMALL TRADERS |
| – Percent of Open Interest Longs: | 18.2 | 51.2 | 0.3 |
| – Percent of Open Interest Shorts: | 12.6 | 56.6 | 0.5 |
| – Net Position: | 586,542 | -567,164 | -19,378 |
| – Gross Longs: | 1,910,959 | 5,376,976 | 34,146 |
| – Gross Shorts: | 1,324,417 | 5,944,140 | 53,524 |
| – Long to Short Ratio: | 1.4 to 1 | 0.9 to 1 | 0.6 to 1 |
| NET POSITION TREND: | |||
| – Strength Index Score (3 Year Range Pct): | 90.6 | 10.2 | 77.2 |
| – Strength Index Reading (3 Year Range): | Bullish-Extreme | Bearish-Extreme | Bullish |
| NET POSITION MOVEMENT INDEX: | |||
| – 6-Week Change in Strength Index: | 4.2 | -3.3 | -9.4 |
30-Day Federal Funds Futures:
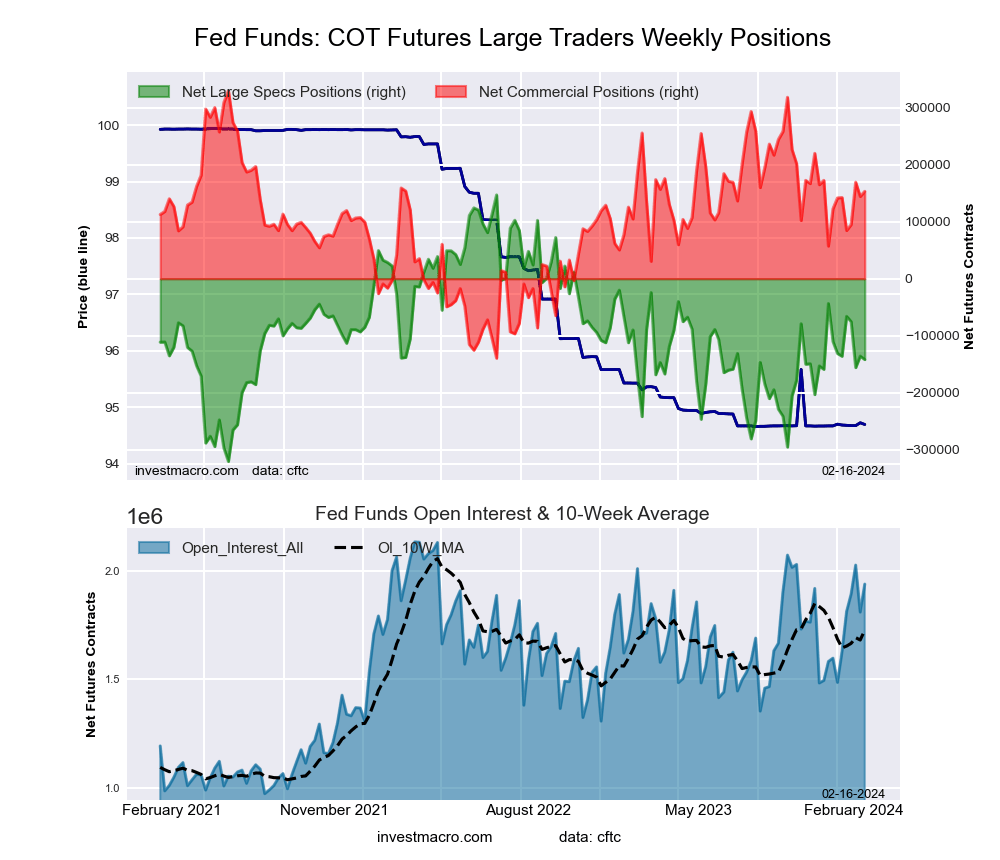 The 30-Day Federal Funds large speculator standing this week was a net position of -141,981 contracts in the data reported through Tuesday. This was a weekly decline of -6,021 contracts from the previous week which had a total of -135,960 net contracts.
This week’s current strength score (the trader positioning range over the past three years, measured from 0 to 100) shows the speculators are currently Bearish with a score of 38.2 percent. The commercials are Bullish with a score of 62.3 percent and the small traders (not shown in chart) are Bullish with a score of 68.5 percent.
Price Trend-Following Model: Downtrend
Our weekly trend-following model classifies the current market price position as: Downtrend. The current action for the model is considered to be: Hold – Maintain Short Position.
| 30-Day Federal Funds Statistics | SPECULATORS | COMMERCIALS | SMALL TRADERS |
| – Percent of Open Interest Longs: | 13.4 | 69.5 | 1.7 |
| – Percent of Open Interest Shorts: | 20.7 | 61.6 | 2.3 |
| – Net Position: | -141,981 | 153,433 | -11,452 |
| – Gross Longs: | 259,866 | 1,346,488 | 33,686 |
| – Gross Shorts: | 401,847 | 1,193,055 | 45,138 |
| – Long to Short Ratio: | 0.6 to 1 | 1.1 to 1 | 0.7 to 1 |
| NET POSITION TREND: | |||
| – Strength Index Score (3 Year Range Pct): | 38.2 | 62.3 | 68.5 |
| – Strength Index Reading (3 Year Range): | Bearish | Bullish | Bullish |
| NET POSITION MOVEMENT INDEX: | |||
| – 6-Week Change in Strength Index: | -2.3 | 2.5 | -1.7 |
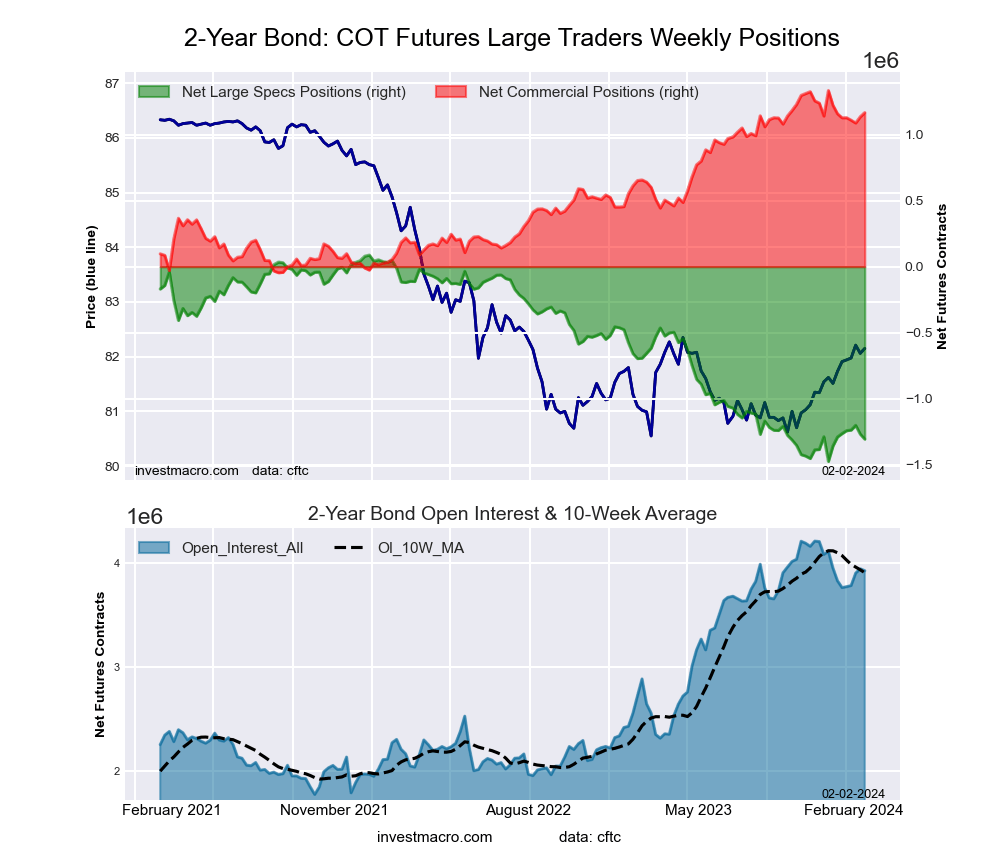
2-Year Treasury Note Futures:
 The 2-Year Treasury Note large speculator standing this week was a net position of -1,188,014 contracts in the data reported through Tuesday. This was a weekly gain of 117,595 contracts from the previous week which had a total of -1,305,609 net contracts.
This week’s current strength score (the trader positioning range over the past three years, measured from 0 to 100) shows the speculators are currently Bearish-Extreme with a score of 18.4 percent. The commercials are Bullish with a score of 79.6 percent and the small traders (not shown in chart) are Bullish-Extreme with a score of 95.5 percent.
Price Trend-Following Model: Uptrend
Our weekly trend-following model classifies the current market price position as: Uptrend. The current action for the model is considered to be: Hold – Maintain Long Position.
| 2-Year Treasury Note Statistics | SPECULATORS | COMMERCIALS | SMALL TRADERS |
| – Percent of Open Interest Longs: | 9.4 | 81.9 | 6.6 |
| – Percent of Open Interest Shorts: | 39.3 | 55.4 | 3.2 |
| – Net Position: | -1,188,014 | 1,052,479 | 135,535 |
| – Gross Longs: | 374,316 | 3,254,831 | 263,751 |
| – Gross Shorts: | 1,562,330 | 2,202,352 | 128,216 |
| – Long to Short Ratio: | 0.2 to 1 | 1.5 to 1 | 2.1 to 1 |
| NET POSITION TREND: | |||
| – Strength Index Score (3 Year Range Pct): | 18.4 | 79.6 | 95.5 |
| – Strength Index Reading (3 Year Range): | Bearish-Extreme | Bullish | Bullish-Extreme |
| NET POSITION MOVEMENT INDEX: | |||
| – 6-Week Change in Strength Index: | 3.5 | -5.5 | 8.1 |
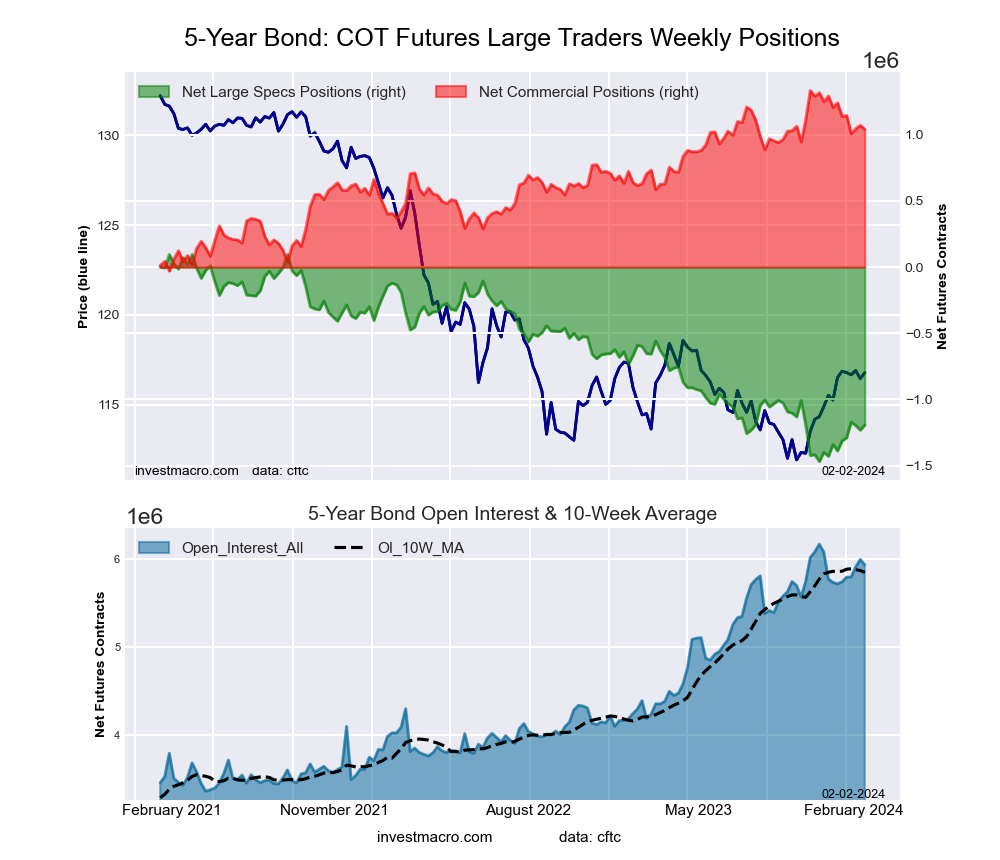
5-Year Treasury Note Futures:
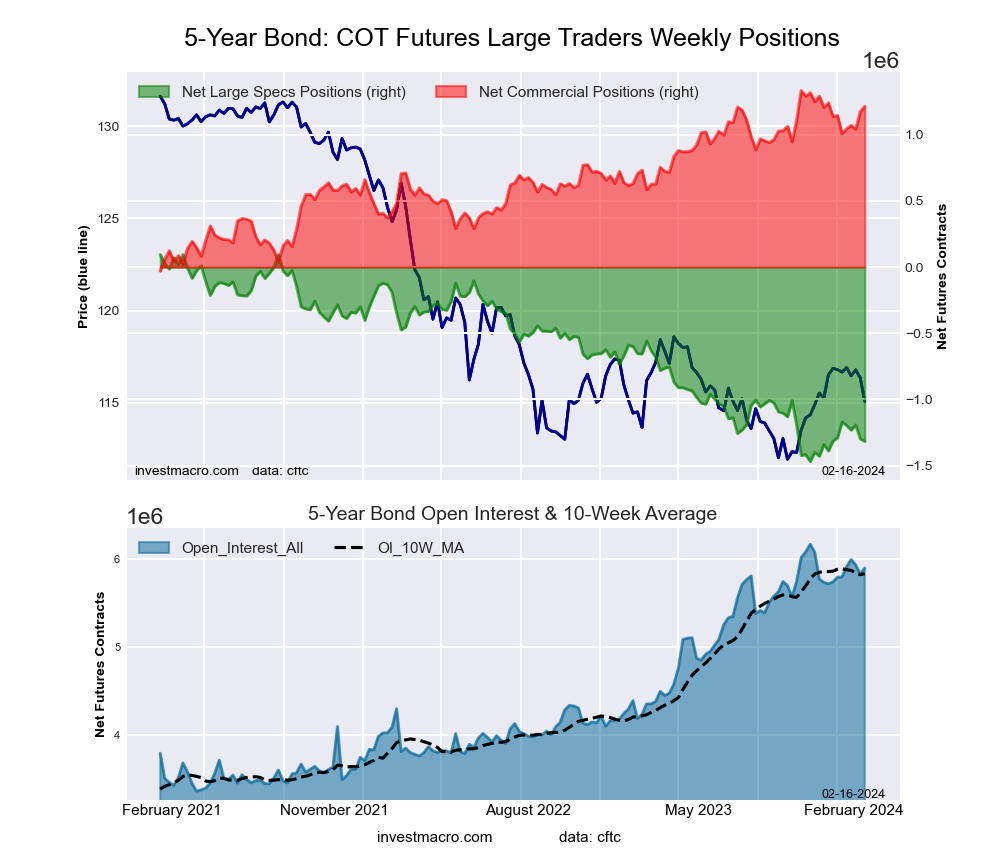 The 5-Year Treasury Note large speculator standing this week was a net position of -1,316,293 contracts in the data reported through Tuesday. This was a weekly reduction of -19,126 contracts from the previous week which had a total of -1,297,167 net contracts.
This week’s current strength score (the trader positioning range over the past three years, measured from 0 to 100) shows the speculators are currently Bearish-Extreme with a score of 9.7 percent. The commercials are Bullish-Extreme with a score of 91.3 percent and the small traders (not shown in chart) are Bullish-Extreme with a score of 84.2 percent.
Price Trend-Following Model: Uptrend
Our weekly trend-following model classifies the current market price position as: Uptrend. The current action for the model is considered to be: Hold – Maintain Long Position.
| 5-Year Treasury Note Statistics | SPECULATORS | COMMERCIALS | SMALL TRADERS |
| – Percent of Open Interest Longs: | 7.1 | 84.7 | 6.7 |
| – Percent of Open Interest Shorts: | 29.4 | 64.1 | 5.0 |
| – Net Position: | -1,316,293 | 1,215,390 | 100,903 |
| – Gross Longs: | 417,558 | 4,996,200 | 397,262 |
| – Gross Shorts: | 1,733,851 | 3,780,810 | 296,359 |
| – Long to Short Ratio: | 0.2 to 1 | 1.3 to 1 | 1.3 to 1 |
| NET POSITION TREND: | |||
| – Strength Index Score (3 Year Range Pct): | 9.7 | 91.3 | 84.2 |
| – Strength Index Reading (3 Year Range): | Bearish-Extreme | Bullish-Extreme | Bullish-Extreme |
| NET POSITION MOVEMENT INDEX: | |||
| – 6-Week Change in Strength Index: | -1.7 | 5.0 | -8.9 |
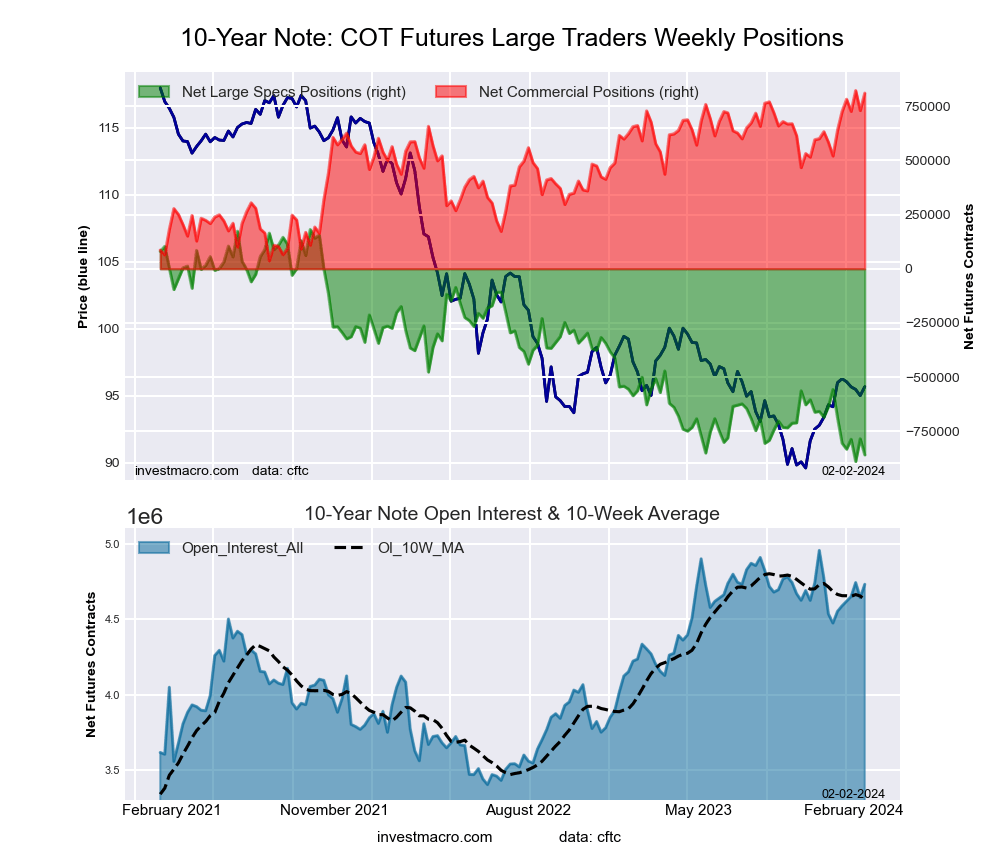
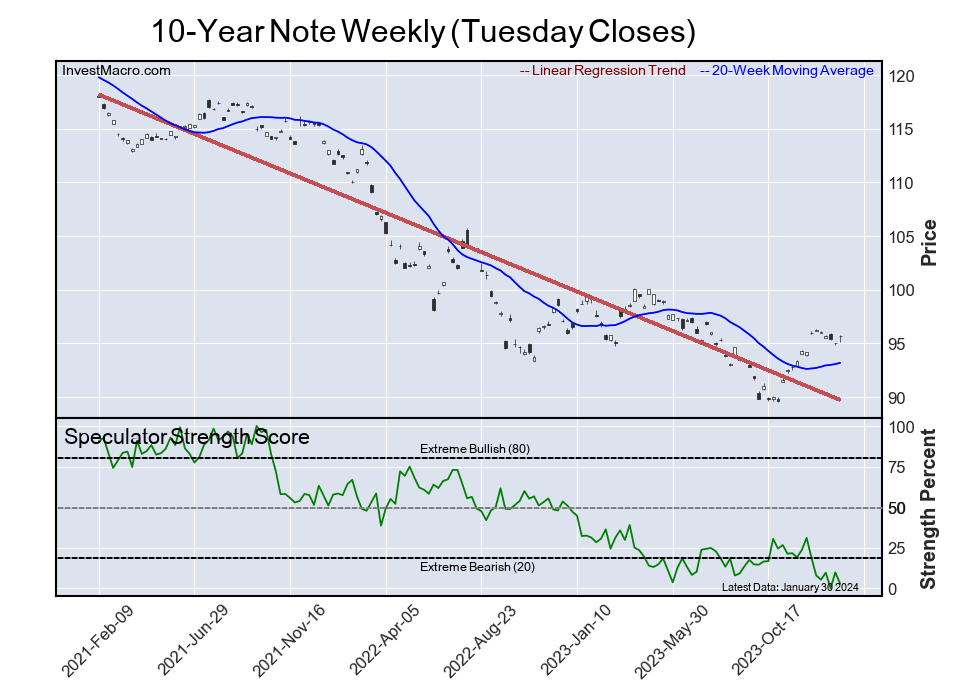
10-Year Treasury Note Futures:
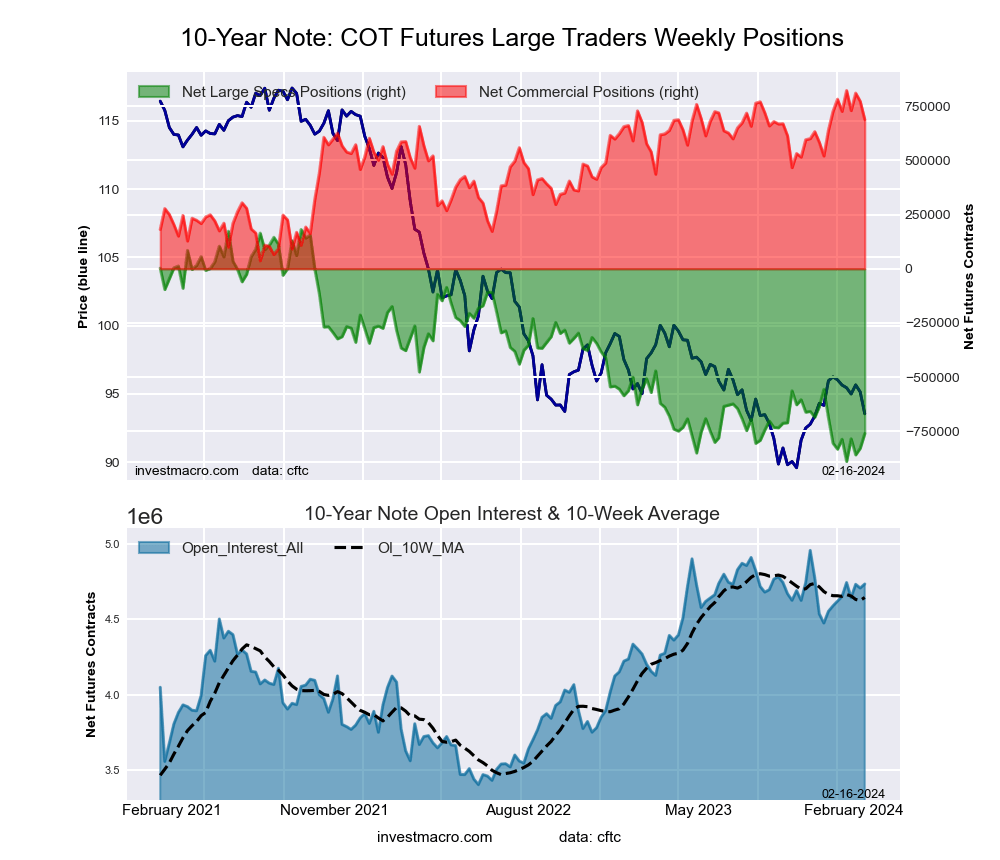 The 10-Year Treasury Note large speculator standing this week was a net position of -760,519 contracts in the data reported through Tuesday. This was a weekly boost of 67,943 contracts from the previous week which had a total of -828,462 net contracts.
This week’s current strength score (the trader positioning range over the past three years, measured from 0 to 100) shows the speculators are currently Bearish-Extreme with a score of 12.0 percent. The commercials are Bullish-Extreme with a score of 82.9 percent and the small traders (not shown in chart) are Bullish-Extreme with a score of 89.2 percent.
Price Trend-Following Model: Uptrend
Our weekly trend-following model classifies the current market price position as: Uptrend. The current action for the model is considered to be: Hold – Maintain Long Position.
| 10-Year Treasury Note Statistics | SPECULATORS | COMMERCIALS | SMALL TRADERS |
| – Percent of Open Interest Longs: | 10.3 | 78.4 | 9.1 |
| – Percent of Open Interest Shorts: | 26.4 | 63.9 | 7.6 |
| – Net Position: | -760,519 | 688,569 | 71,950 |
| – Gross Longs: | 489,605 | 3,713,618 | 432,020 |
| – Gross Shorts: | 1,250,124 | 3,025,049 | 360,070 |
| – Long to Short Ratio: | 0.4 to 1 | 1.2 to 1 | 1.2 to 1 |
| NET POSITION TREND: | |||
| – Strength Index Score (3 Year Range Pct): | 12.0 | 82.9 | 89.2 |
| – Strength Index Reading (3 Year Range): | Bearish-Extreme | Bullish-Extreme | Bullish-Extreme |
| NET POSITION MOVEMENT INDEX: | |||
| – 6-Week Change in Strength Index: | 6.7 | -12.0 | 4.8 |
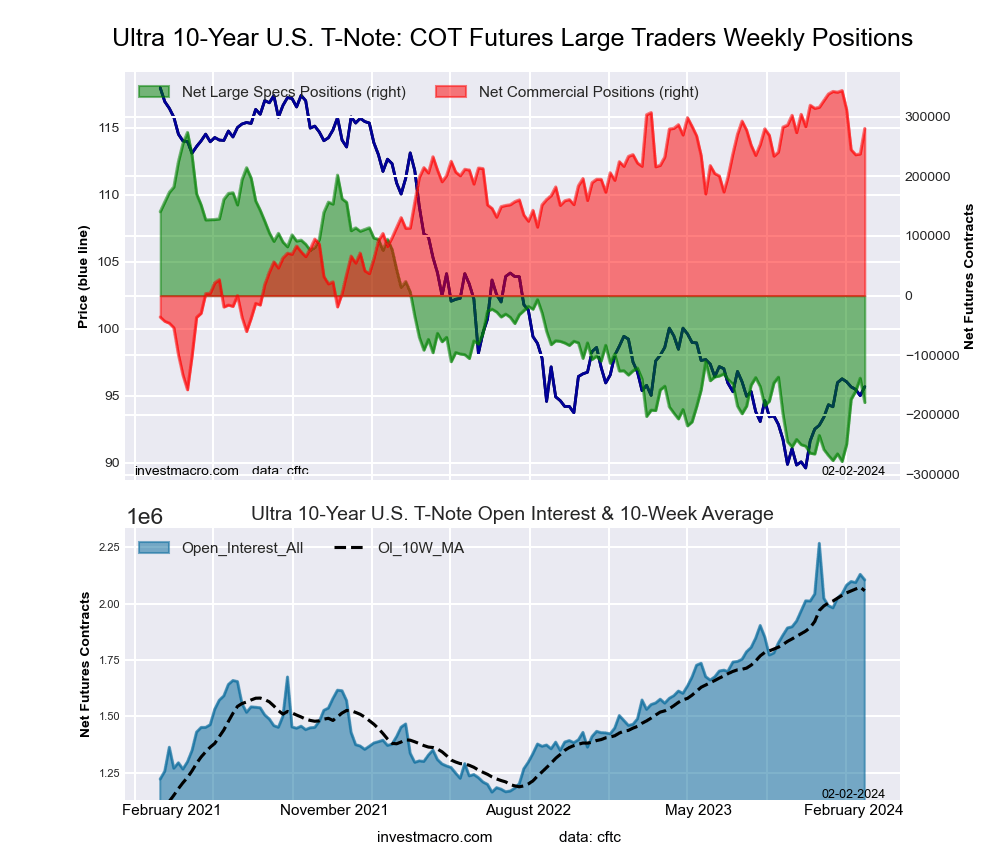
Ultra 10-Year Notes Futures:
 The Ultra 10-Year Notes large speculator standing this week was a net position of -230,706 contracts in the data reported through Tuesday. This was a weekly reduction of -15,056 contracts from the previous week which had a total of -215,650 net contracts.
This week’s current strength score (the trader positioning range over the past three years, measured from 0 to 100) shows the speculators are currently Bearish-Extreme with a score of 8.6 percent. The commercials are Bullish-Extreme with a score of 93.9 percent and the small traders (not shown in chart) are Bullish with a score of 64.8 percent.
Price Trend-Following Model: Weak Uptrend
Our weekly trend-following model classifies the current market price position as: Weak Uptrend. The current action for the model is considered to be: Hold – Maintain Long Position.
| Ultra 10-Year Notes Statistics | SPECULATORS | COMMERCIALS | SMALL TRADERS |
| – Percent of Open Interest Longs: | 12.7 | 76.6 | 9.0 |
| – Percent of Open Interest Shorts: | 23.2 | 62.3 | 12.7 |
| – Net Position: | -230,706 | 313,523 | -82,817 |
| – Gross Longs: | 279,753 | 1,686,833 | 197,906 |
| – Gross Shorts: | 510,459 | 1,373,310 | 280,723 |
| – Long to Short Ratio: | 0.5 to 1 | 1.2 to 1 | 0.7 to 1 |
| NET POSITION TREND: | |||
| – Strength Index Score (3 Year Range Pct): | 8.6 | 93.9 | 64.8 |
| – Strength Index Reading (3 Year Range): | Bearish-Extreme | Bullish-Extreme | Bullish |
| NET POSITION MOVEMENT INDEX: | |||
| – 6-Week Change in Strength Index: | 3.4 | 0.3 | -12.0 |
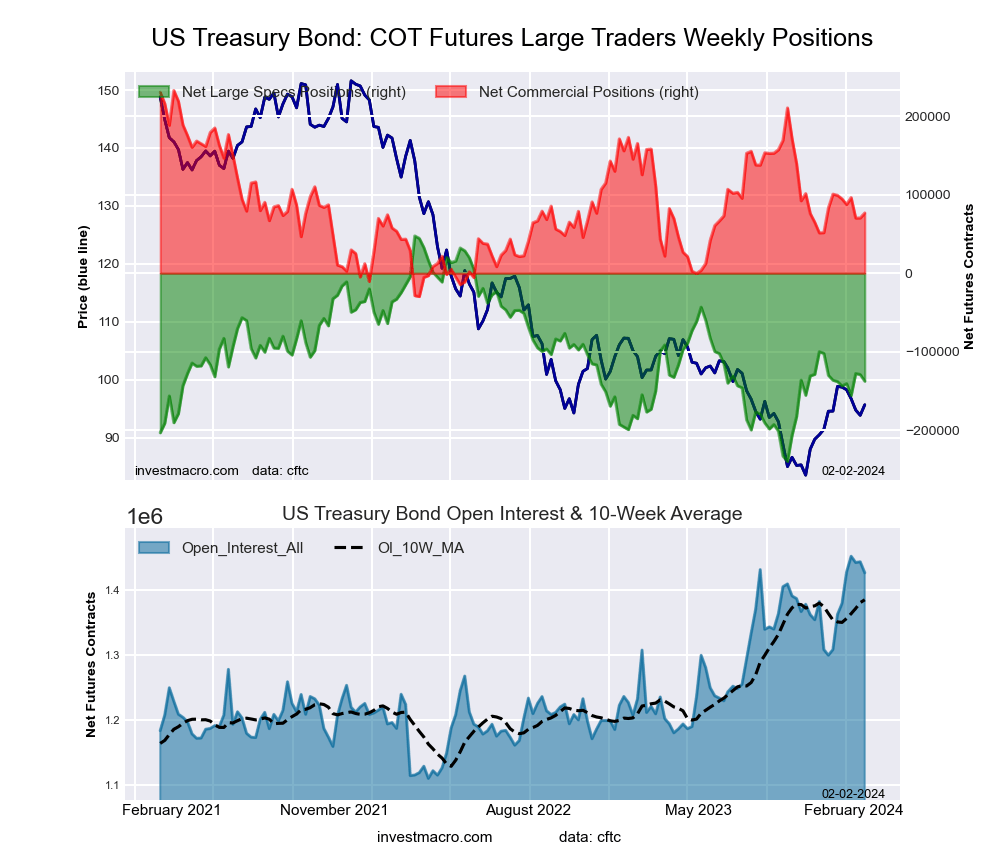
US Treasury Bonds Futures:
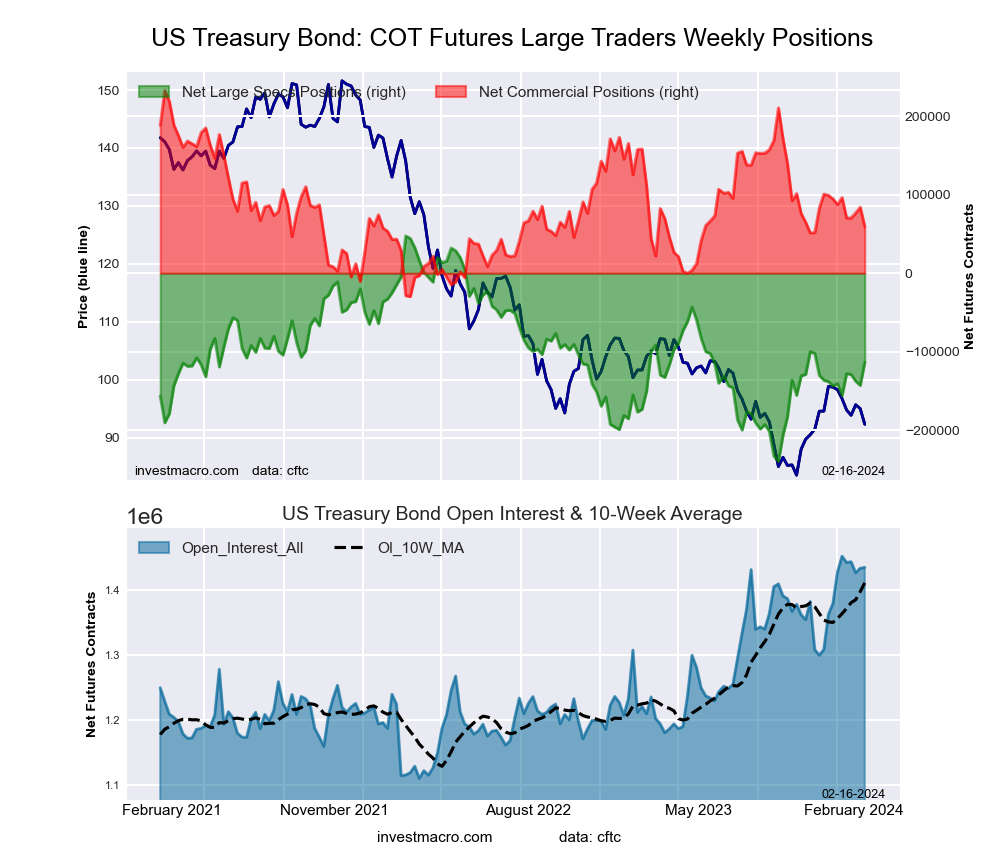 The US Treasury Bonds large speculator standing this week was a net position of -113,371 contracts in the data reported through Tuesday. This was a weekly advance of 29,415 contracts from the previous week which had a total of -142,786 net contracts.
This week’s current strength score (the trader positioning range over the past three years, measured from 0 to 100) shows the speculators are currently Bearish with a score of 44.0 percent. The commercials are Bearish with a score of 33.9 percent and the small traders (not shown in chart) are Bullish-Extreme with a score of 88.0 percent.
Price Trend-Following Model: Uptrend
Our weekly trend-following model classifies the current market price position as: Uptrend. The current action for the model is considered to be: Hold – Maintain Long Position.
| US Treasury Bonds Statistics | SPECULATORS | COMMERCIALS | SMALL TRADERS |
| – Percent of Open Interest Longs: | 12.9 | 71.8 | 14.4 |
| – Percent of Open Interest Shorts: | 20.8 | 67.6 | 10.6 |
| – Net Position: | -113,371 | 59,063 | 54,308 |
| – Gross Longs: | 185,581 | 1,029,694 | 205,953 |
| – Gross Shorts: | 298,952 | 970,631 | 151,645 |
| – Long to Short Ratio: | 0.6 to 1 | 1.1 to 1 | 1.4 to 1 |
| NET POSITION TREND: | |||
| – Strength Index Score (3 Year Range Pct): | 44.0 | 33.9 | 88.0 |
| – Strength Index Reading (3 Year Range): | Bearish | Bearish | Bullish-Extreme |
| NET POSITION MOVEMENT INDEX: | |||
| – 6-Week Change in Strength Index: | 9.5 | -10.8 | 0.8 |
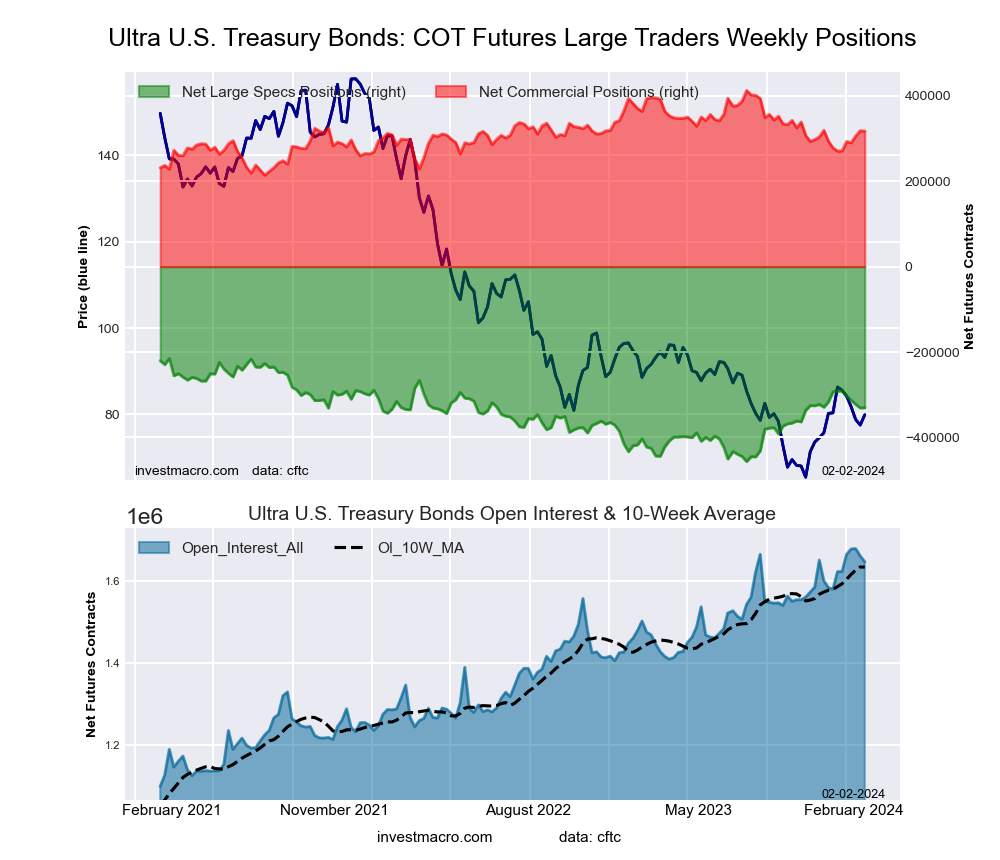
Ultra US Treasury Bonds Futures:
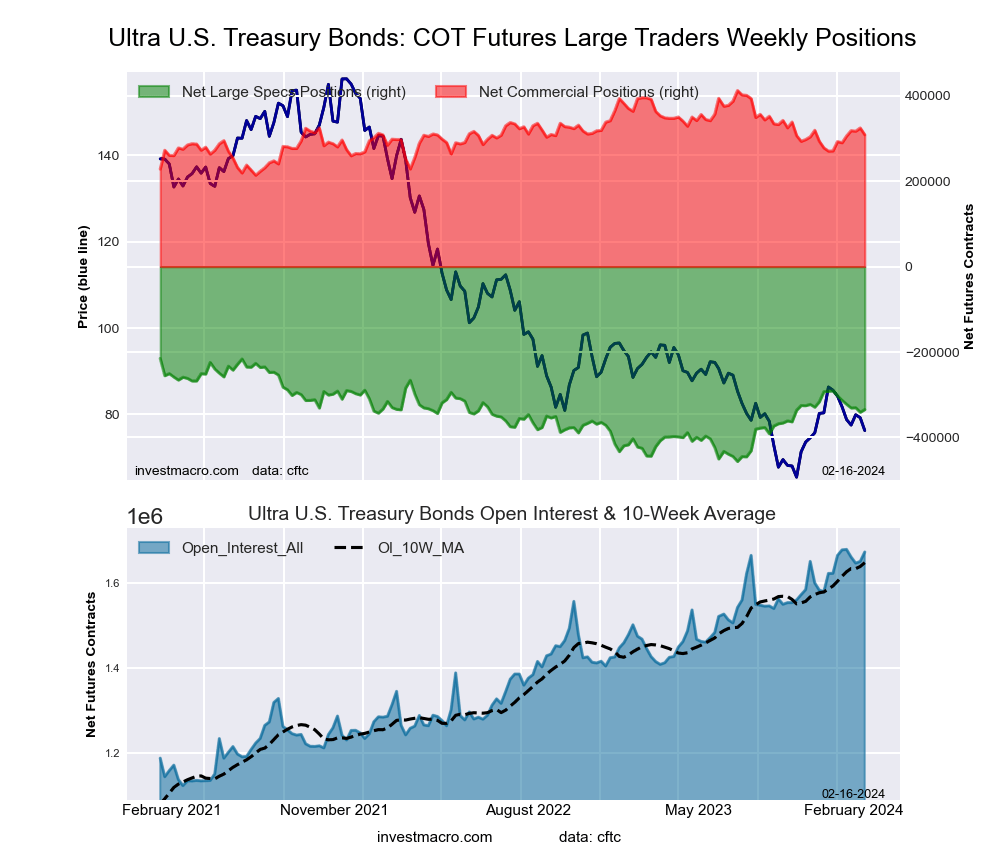 The Ultra US Treasury Bonds large speculator standing this week was a net position of -334,876 contracts in the data reported through Tuesday. This was a weekly lift of 6,328 contracts from the previous week which had a total of -341,204 net contracts.
This week’s current strength score (the trader positioning range over the past three years, measured from 0 to 100) shows the speculators are currently Bullish with a score of 50.4 percent. The commercials are Bearish with a score of 47.8 percent and the small traders (not shown in chart) are Bullish with a score of 61.6 percent.
Price Trend-Following Model: Uptrend
Our weekly trend-following model classifies the current market price position as: Uptrend. The current action for the model is considered to be: Hold – Maintain Long Position.
| Ultra US Treasury Bonds Statistics | SPECULATORS | COMMERCIALS | SMALL TRADERS |
| – Percent of Open Interest Longs: | 9.9 | 79.5 | 10.2 |
| – Percent of Open Interest Shorts: | 29.9 | 61.1 | 8.7 |
| – Net Position: | -334,876 | 309,005 | 25,871 |
| – Gross Longs: | 165,750 | 1,330,881 | 170,951 |
| – Gross Shorts: | 500,626 | 1,021,876 | 145,080 |
| – Long to Short Ratio: | 0.3 to 1 | 1.3 to 1 | 1.2 to 1 |
| NET POSITION TREND: | |||
| – Strength Index Score (3 Year Range Pct): | 50.4 | 47.8 | 61.6 |
| – Strength Index Reading (3 Year Range): | Bullish | Bearish | Bullish |
| NET POSITION MOVEMENT INDEX: | |||
| – 6-Week Change in Strength Index: | -13.3 | 8.0 | 15.2 |
Article By InvestMacro – Receive our weekly COT Newsletter
*COT Report: The COT data, released weekly to the public each Friday, is updated through the most recent Tuesday (data is 3 days old) and shows a quick view of how large speculators or non-commercials (for-profit traders) were positioned in the futures markets.
The CFTC categorizes trader positions according to commercial hedgers (traders who use futures contracts for hedging as part of the business), non-commercials (large traders who speculate to realize trading profits) and nonreportable traders (usually small traders/speculators) as well as their open interest (contracts open in the market at time of reporting). See CFTC criteria here.